![]() | ||||||||||||||||||||||||||||||||||||||||
| ||||||||||||||||||||||||||||||||||||||||
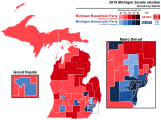
38 seats in the Michigan Senate 20 seats needed for a majority | ||||||||||||||||||||||||||||||||||||||||
---|---|---|---|---|---|---|---|---|---|---|---|---|---|---|---|---|---|---|---|---|---|---|---|---|---|---|---|---|---|---|---|---|---|---|---|---|---|---|---|---|
| ||||||||||||||||||||||||||||||||||||||||
![]() Results: Democratic hold Democratic gain Republican hold | ||||||||||||||||||||||||||||||||||||||||
|
Elections in Michigan |
---|
![]() |
The Michigan Senate elections of 2018 took place on November 6, 2018, [1] alongside elections for Michigan's governor, Class I United States Senator, attorney general, and secretary of state, as well as elections for Michigan's 14 seats in the United States House of Representatives and all 110 seats in the Michigan House of Representatives, to elect the 38 members that would comprise the Michigan Senate. The Republican, Democratic, and Libertarian parties chose their nominees in a partisan primary on August 7, 2018. [1] The Working Class Party, U.S. Taxpayers Party, Green Party, and Natural Law Party chose their nominees at state party conventions. [2]
Under the Michigan Constitution, members of the state senate may serve only two four-year terms, and members of the House of Representatives are limited to three two-year terms. Michigan has what are considered the toughest term limits in the country. [3] After the 2018 midterm elections, nearly 70 percent of the state Senate and 20 percent of the state House would be forced to leave office because of term limits. [4] The following members are prevented by term limits from seeking re-election to the Senate in 2018. This list does not include members that are eligible for re-election, but instead chose to seek other office or to retire.
Seats where the margin of victory was under 10%:
District 1 • District 2 • District 3 • District 4 • District 5 • District 6 • District 7 • District 8 • District 9 • District 10 • District 11 • District 12 • District 13 • District 14 • District 15 • District 16 • District 17 • District 18 • District 19 • District 20 • District 21 • District 22 • District 23 • District 24 • District 25 • District 26 • District 27 • District 28 • District 29 • District 30 • District 31 • District 32 • District 33 • District 34 • District 35 • District 36 • District 37 • District 38 |
Pending official certification by the Michigan Board of State Canvassers, the following candidates, listed alphabetically, advanced to the November general election.
2 | Current member of House |
3 | Former legislator |
Party | Candidate | Votes | % | |
---|---|---|---|---|
Democratic | Stephanie Chang 2 | 60,874 | 72.27% | |
Republican | Pauline Montie | 20,154 | 23.93% | |
Green | David Bullock | 3,204 | 3.80% | |
Total votes | 261,214 | 100% | ||
Democratic hold |
Party | Candidate | Votes | % | |
---|---|---|---|---|
Democratic | Adam Hollier | 53,890 | 75.71% | |
Republican | Lisa Papas | 17,285 | 24.29% | |
Total votes | 71,175 | 100% | ||
Democratic hold |
Party | Candidate | Votes | % | |
---|---|---|---|---|
Democratic | Sylvia Santana 2 | 58,211 | 81.75% | |
Republican | Kathy Stecker | 10,907 | 15.32% | |
Working Class | Hali McEachern | 2,089 | 2.93% | |
Total votes | 71,207 | 100% | ||
Democratic hold |
Party | Candidate | Votes | % | |
---|---|---|---|---|
Democratic | Marshall Bullock | 57,469 | 78.36% | |
Republican | Angela Savino | 15,868 | 21.64% | |
Total votes | 73,337 | 100% | ||
Democratic hold |
Party | Candidate | Votes | % | |
---|---|---|---|---|
Democratic | Betty Jean Alexander | 69,203 | 77.65% | |
Republican | DeShawn Wilkins | 16,044 | 18.00% | |
Working Class | Larry Betts | 3,879 | 4.35% | |
Total votes | 89,126 | 100% | ||
Democratic hold |
Party | Candidate | Votes | % | |
---|---|---|---|---|
Democratic | Erika Geiss 2 | 60,783 | 61.34% | |
Republican | Brenda Jones | 38,301 | 38.66% | |
Total votes | 99,084 | 100% | ||
Democratic hold |
Party | Candidate | Votes | % | |||
---|---|---|---|---|---|---|
Democratic | Dayna Polehanki | 69,428 | 50.56% | |||
Republican | Laura Cox 2 | 65,009 | 47.34% | |||
Libertarian | Joseph H. LeBlanc | 2,890 | 2.10% | |||
Total votes | 137,327 | 100% | ||||
Democratic gain from Republican |
Party | Candidate | Votes | % | |
---|---|---|---|---|
Republican | Peter Lucido 2 | 76,165 | 61.76% | |
Democratic | Paul R. Francis | 47,151 | 38.24% | |
Total votes | 123,316 | 100% | ||
Republican hold |
Party | Candidate | Votes | % | |
---|---|---|---|---|
Democratic | Paul Wojno 3 | 65,730 | 65.90% | |
Republican | Jeff Bonnell | 34,012 | 34.10% | |
Total votes | 99,742 | 100% | ||
Democratic hold |
Party | Candidate | Votes | % | |
---|---|---|---|---|
Republican | Michael D. MacDonald | 57,565 | 51.02% | |
Democratic | Henry Yanez 2 | 52,392 | 46.43% | |
Libertarian | Mike Saliba | 2,874 | 2.55% | |
Total votes | 112,831 | 100% | ||
Republican hold |
Party | Candidate | Votes | % | |
---|---|---|---|---|
Democratic | Jeremy Moss 2 | 97,192 | 76.43% | |
Republican | Boris Tuman | 26,829 | 21.10% | |
Libertarian | James K. Young | 3,145 | 2.47% | |
Total votes | 127,166 | 100% | ||
Democratic hold |
Party | Candidate | Votes | % | |||
---|---|---|---|---|---|---|
Democratic | Rosemary Bayer | 59,297 | 49.39% | |||
Republican | Mike McCready2 | 58,362 | 48.61% | |||
Libertarian | Jeff Pittel | 2,403 | 2.00% | |||
Total votes | 120,062 | 100% | ||||
Democratic gain from Republican |
Party | Candidate | Votes | % | |||
---|---|---|---|---|---|---|
Democratic | Mallory McMorrow | 73,138 | 51.89% | |||
Republican | Marty Knollenberg (incumbent) | 67,798 | 48.11% | |||
Total votes | 140,936 | 100% | ||||
Democratic gain from Republican |
Party | Candidate | Votes | % | |
---|---|---|---|---|
Republican | Ruth Johnson 3 | 64,273 | 55.68% | |
Democratic | Renee Watson | 48,580 | 42.09% | |
Green | Jessica Smith | 2,580 | 2.24% | |
Total votes | 115,433 | 100% | ||
Republican hold |
Party | Candidate | Votes | % | |
---|---|---|---|---|
Republican | Jim Runestad 2 | 67,351 | 51.69% | |
Democratic | Julia Pulver | 62,935 | 48.31% | |
Total votes | 130,286 | 100% | ||
Republican hold |
Party | Candidate | Votes | % | |
---|---|---|---|---|
Republican | Mike Shirkey 1 | 56,981 | 62.71% | |
Democratic | Val Cochran Toops | 31,129 | 34.26% | |
Libertarian | Ronald A. Muszynski | 2,760 | 3.04% | |
Total votes | 90,870 | 100% | ||
Republican hold |
Party | Candidate | Votes | % | |
---|---|---|---|---|
Republican | Dale Zorn (incumbent) | 57,947 | 57.89% | |
Democratic | Bill LaVoy 3 | 39,255 | 39.21% | |
Libertarian | Chad McNamara | 2,905 | 2.90% | |
Total votes | 100,107 | 100% | ||
Republican hold |
Party | Candidate | Votes | % | |
---|---|---|---|---|
Democratic | Jeff Irwin 3 | 96,876 | 76.61% | |
Republican | Martin Church | 26,619 | 21.05% | |
Working Class | Thomas Repasky | 2,954 | 2.34% | |
Total votes | 126,449 | 100% | ||
Democratic hold |
Party | Candidate | Votes | % | |
---|---|---|---|---|
Republican | John Bizon 2 | 56,213 | 58.41% | |
Democratic | Jason Noble | 37,081 | 38.53% | |
Libertarian | Joseph P. Gillotte | 2,941 | 3.06% | |
Total votes | 96,235 | 100% | ||
Republican hold |
Party | Candidate | Votes | % | |||
---|---|---|---|---|---|---|
Democratic | Sean McCann 3 | 60,523 | 53.09% | |||
Republican | Margaret O'Brien (incumbent) | 48,197 | 42.28% | |||
Libertarian | Lorence Wenke 3 | 5,273 | 4.63% | |||
Total votes | 113,993 | 100% | ||||
Democratic gain from Republican |
Party | Candidate | Votes | % | |
---|---|---|---|---|
Republican | Kim LaSata 2 | 56,296 | 58.20% | |
Democratic | Ian Haight | 40,433 | 41.80% | |
Total votes | 96,729 | 100% | ||
Republican hold |
Party | Candidate | Votes | % | |
---|---|---|---|---|
Republican | Lana Theis 2 | 76,038 | 55.97% | |
Democratic | Adam Dreher | 57,163 | 42.08% | |
Green | Eric Borregard | 2,658 | 1.96% | |
Total votes | 135,859 | 100% | ||
Republican hold |
Party | Candidate | Votes | % | |
---|---|---|---|---|
Democratic | Curtis Hertel Jr. (incumbent) | 73,184 | 68.46% | |
Republican | Andrea Pollock | 33,718 | 31.54% | |
Total votes | 106,902 | 100% | ||
Democratic hold |
Party | Candidate | Votes | % | |
---|---|---|---|---|
Republican | Tom Barrett 2 | 66,969 | 53.53% | |
Democratic | Kelly Rossman-McKinney | 54,350 | 43.45% | |
Libertarian | Katie Nepton | 2,064 | 1.65% | |
Constitution | Matthew Shepard | 1,711 | 1.37% | |
Total votes | 125,094 | 100% | ||
Republican hold |
Party | Candidate | Votes | % | |
---|---|---|---|---|
Republican | Dan Lauwers 2 | 66,926 | 63.96% | |
Democratic | Debbie Bourgois | 37,715 | 36.04% | |
Total votes | 104,641 | 100% | ||
Republican hold |
Party | Candidate | Votes | % | |
---|---|---|---|---|
Republican | Aric Nesbitt 3 | 61,509 | 56.67% | |
Democratic | Garnet Lewis | 43,495 | 40.08% | |
Libertarian | Erwin Haas | 2,375 | 2.19% | |
Green | Robert M. Alway | 1,153 | 1.06% | |
Total votes | 108,532 | 100% | ||
Republican hold |
Party | Candidate | Votes | % | |
---|---|---|---|---|
Democratic | Jim Ananich (incumbent) | 59,108 | 71.17% | |
Republican | Donna Kekesis | 23,942 | 28.83% | |
Total votes | 83,050 | 100% | ||
Democratic hold |
Party | Candidate | Votes | % | |
---|---|---|---|---|
Republican | Peter MacGregor (incumbent) | 68,749 | 58.39% | |
Democratic | Craig Beach | 45,937 | 39.01% | |
Libertarian | Nathan Hewer | 3,059 | 2.60% | |
Total votes | 117,745 | 100% | ||
Republican hold |
Party | Candidate | Votes | % | |||
---|---|---|---|---|---|---|
Democratic | Winnie Brinks 2 | 70,715 | 56.92% | |||
Republican | Chris Afendoulis 2 | 50,225 | 40.43% | |||
Libertarian | Robert VanNoller | 1,840 | 1.48% | |||
Working Class | Louis Palus | 1,445 | 1.16% | |||
Total votes | 124,225 | 100% | ||||
Democratic gain from Republican |
Party | Candidate | Votes | % | |
---|---|---|---|---|
Republican | Roger Victory 2 | 79,323 | 63.25% | |
Democratic | Jeanette Schipper | 42,904 | 34.21% | |
Libertarian | Mary Buzuma | 3,189 | 2.54% | |
Total votes | 125,416 | 100% | ||
Republican hold |
Party | Candidate | Votes | % | |
---|---|---|---|---|
Republican | Kevin Daley 3 | 63,394 | 60.24% | |
Democratic | Cynthia A. Luczak | 41,833 | 39.76% | |
Total votes | 105,227 | 100% | ||
Republican hold |
Party | Candidate | Votes | % | |
---|---|---|---|---|
Republican | Kenneth Horn 1 | 62,375 | 55.48% | |
Democratic | Phil Phelps 2 | 50,058 | 44.52% | |
Total votes | 112,433 | 100% | ||
Republican hold |
Party | Candidate | Votes | % | |
---|---|---|---|---|
Republican | Rick Outman 3 | 49,856 | 58.75% | |
Democratic | Mark Bignell | 32,375 | 38.15% | |
Constitution | Christopher Comden | 2,633 | 3.10% | |
Total votes | 84,864 | 100% | ||
Republican hold |
Party | Candidate | Votes | % | |
---|---|---|---|---|
Republican | Jon Bumstead 3 | 50,313 | 50.74% | |
Democratic | Poppy Sias-Hernandez | 45,941 | 46.33% | |
Libertarian | Max Riekse | 2,896 | 2.92% | |
Total votes | 99,150 | 100% | ||
Republican hold |
Party | Candidate | Votes | % | |
---|---|---|---|---|
Republican | Curt VanderWall 2 | 73,688 | 63.17% | |
Democratic | Mike Taillard | 39,923 | 34.23% | |
Libertarian | Timothy Coon | 3,031 | 2.60% | |
Total votes | 116,642 | 100% | ||
Republican hold |
Party | Candidate | Votes | % | |
---|---|---|---|---|
Republican | Jim Stamas (incumbent) | 71,013 | 64.29% | |
Democratic | Joe Weir | 39,440 | 35.71% | |
Total votes | 110,453 | 100% | ||
Republican hold |
Party | Candidate | Votes | % | |
---|---|---|---|---|
Republican | Wayne Schmidt (incumbent) | 73,338 | 58.95% | |
Democratic | Jim Page | 51,076 | 41.05% | |
Total votes | 124,414 | 100% | ||
Republican hold |
Party | Candidate | Votes | % | |
---|---|---|---|---|
Republican | Ed McBroom 3 | 59,290 | 54.63% | |
Democratic | Scott Dianda 2 | 47,279 | 43.57% | |
Green | Wade Paul Roberts | 1,952 | 1.80% | |
Total votes | 108,521 | 100% | ||
Republican hold |