| ||||||||||||||||||||||
All 141 seats in the Maryland House of Delegates 71 seats needed for a majority | ||||||||||||||||||||||
---|---|---|---|---|---|---|---|---|---|---|---|---|---|---|---|---|---|---|---|---|---|---|
| ||||||||||||||||||||||
Results: Democratic gain Republican gain Democratic hold Republican hold | ||||||||||||||||||||||
|
Elections in Maryland |
---|
Government |
The 2014 Maryland House of Delegates elections were held on November 4, 2014, as part of the biennial United States elections. All 141 of Maryland's state delegates were up for reelection.
District 1A • District 1B • District 1C • District 2A • District 2B • District 3A • District 3B • District 4 • District 5 • District 6 • District 7 • District 8 • District 9A • District 9B • District 10 • District 11 • District 12 • District 13 • District 14 • District 15 • District 16 • District 17 • District 18 • District 19 • District 20 • District 21 • District 22 • District 23A • District 23B • District 24 • District 25 • District 26 • District 27A • District 27B • District 27C • District 28 • District 29A • District 29B • District 29C • District 30A • District 30B • District 31A • District 31B • District 32 • District 33 • District 34A • District 34B • District 35A • District 35B • District 36 • District 37A • District 37B • District 38A • District 38B • District 38C • District 39 • District 40 • District 41 • District 42A • District 42B • District 43 • District 44A • District 44B • District 45 • District 46 • District 47A • District 47B |
All election results are from the Maryland State Board of Elections. [38] [39]
Party | Candidate | Votes | % | |
---|---|---|---|---|
Republican | Wendell R. Beitzel (incumbent) | 10,637 | 99.1 | |
Write-in | 100 | 0.9 | ||
Republican hold |
Party | Candidate | Votes | % | |
---|---|---|---|---|
Republican | Jason C. Buckel | 6,664 | 58.9 | |
Democratic | Kevin Kelly (incumbent) | 4,623 | 40.9 | |
Write-in | 21 | 0.2 | ||
Republican gain from Democratic |
Party | Candidate | Votes | % | |
---|---|---|---|---|
Republican | Mike McKay | 1,568 | 56.2 | |
Republican | Ray Givens | 1,222 | 43.8 |
Party | Candidate | Votes | % | |
---|---|---|---|---|
Republican | Mike McKay | 6,388 | 57.0 | |
Democratic | Nick Scarpelli | 4,809 | 42.9 | |
Write-in | 9 | 0.1 | ||
Republican hold |
Party | Candidate | Votes | % | |
---|---|---|---|---|
Republican | Neil Parrott | 5,362 | 45.8 | |
Republican | Andrew A. Serafini (incumbent) | 5,178 | 44.2 | |
Republican | David C. Hanlin | 1,180 | 10.1 |
Party | Candidate | Votes | % | |
---|---|---|---|---|
Republican | Neil C. Parrott | 17,599 | 36.0 | |
Republican | Andrew A. Serafini (incumbent) | 17,528 | 35.9 | |
Democratic | Elizabeth Paul | 8,279 | 16.9 | |
Democratic | Charles Bailey | 5,419 | 11.1 | |
Write-in | 22 | 0.0 | ||
Republican hold | ||||
Republican hold |
Party | Candidate | Votes | % | |
---|---|---|---|---|
Republican | Brett Wilson | 3,846 | 54.3 | |
Democratic | John P. Donoghue (incumbent) | 3,232 | 45.6 | |
Write-in | 7 | 0.1 | ||
Republican gain from Democratic |
Party | Candidate | Votes | % | |
---|---|---|---|---|
Democratic | Carol L. Krimm | 3,087 | 36.3 | |
Democratic | Karen Lewis Young | 2,938 | 34.5 | |
Democratic | Roger Wilson | 1,938 | 22.8 | |
Democratic | Nicholas Bouquet | 549 | 6.4 |
Party | Candidate | Votes | % | |
---|---|---|---|---|
Democratic | Carol L. Krimm | 11,654 | 28.0 | |
Democratic | Karen Lewis Young | 10,944 | 26.3 | |
Republican | Paul Smith | 9,930 | 23.9 | |
Republican | Victoria Wilkins | 8,981 | 21.6 | |
Write-in | 47 | 0.1 | ||
Democratic gain from Republican | ||||
Democratic hold |
Party | Candidate | Votes | % | |
---|---|---|---|---|
Republican | William Folden | 1,566 | 54.0 | |
Republican | Darren Shay Wigfield | 1,334 | 46.0 |
Party | Candidate | Votes | % | |
---|---|---|---|---|
Republican | William Folden | 7,522 | 56.3 | |
Democratic | Stephen Slater | 5,818 | 43.6 | |
Write-in | 18 | 0.1 | ||
Republican hold |
Party | Candidate | Votes | % | |
---|---|---|---|---|
Republican | Kathy Afzali (incumbent) | 9,440 | 27.4 | |
Republican | Kelly M. Schulz (incumbent) | 8,274 | 24.0 | |
Republican | David E. Vogt III | 6,499 | 18.9 | |
Republican | Wendi W. Peters | 5,417 | 15.7 | |
Republican | Barrie Ciliberti | 4,816 | 14.0 |
Party | Candidate | Votes | % | |
---|---|---|---|---|
Republican | Kelly Schulz (incumbent) | 33,753 | 31.0 | |
Republican | Kathy Afzali (incumbent) | 31,128 | 28.5 | |
Republican | David E. Vogt, III | 27,313 | 25.1 | |
Democratic | Gene Stanton | 16,493 | 15.1 | |
Write-in | 346 | 0.3 | ||
Republican hold | ||||
Republican hold |
Party | Candidate | Votes | % | |
---|---|---|---|---|
Republican | Justin Ready (incumbent) | 10,567 | 25.0 | |
Republican | Susan Krebs (incumbent) | 7,665 | 18.1 | |
Republican | Haven Shoemaker | 7,308 | 17.3 | |
Republican | Joshua Stonko | 5,813 | 13.8 | |
Republican | Donald B. Elliott (incumbent) | 4,064 | 9.6 | |
Republican | Kevin R. Utz | 4,024 | 9.5 | |
Republican | Carmen Amedori | 2,819 | 6.7 |
Party | Candidate | Votes | % | |
---|---|---|---|---|
Republican | Susan Krebs (incumbent) | 35,701 | 28.6 | |
Republican | Justin Ready (incumbent) | 34,789 | 27.9 | |
Republican | Haven Shoemaker | 33,985 | 27.2 | |
Democratic | Dorothy G. Scanlan | 11,737 | 9.4 | |
Democratic | Zachary Hands | 8,210 | 6.6 | |
Write-in | 351 | 0.3 | ||
Republican hold | ||||
Republican hold |
Party | Candidate | Votes | % | |
---|---|---|---|---|
Democratic | Michael H. Weir Jr. (incumbent) | 4,282 | 19.3 | |
Democratic | Nicholas C. D'Adamo, Jr. | 3,525 | 15.9 | |
Democratic | Jake Mohorovic | 2,900 | 13.1 | |
Democratic | Ed Crizer | 2,785 | 12.5 | |
Democratic | Anna Pearce | 2,591 | 11.7 | |
Democratic | Eric Washington | 1,955 | 8.8 | |
Democratic | Rick Roberts | 1,429 | 6.4 | |
Democratic | Larry Harmel | 1,168 | 5.3 | |
Democratic | Steven Charles Brown | 589 | 2.7 | |
Democratic | Jonathan H. Campbell | 577 | 2.6 | |
Democratic | Marcus A. Foreman | 396 | 1.8 |
Party | Candidate | Votes | % | |
---|---|---|---|---|
Republican | Robert B. Long | 2,139 | 24.4 | |
Republican | Ric Metzgar | 1,707 | 19.5 | |
Republican | Robin Grammer Jr. | 1,224 | 14.0 | |
Republican | Roger Zajdel | 994 | 11.3 | |
Republican | Domenico "Dan" Liberatore | 860 | 9.8 | |
Republican | Mitchell J. Toland, Jr. | 701 | 8.0 | |
Republican | Carl H. Magee, Jr. | 577 | 6.6 | |
Republican | Gary Sparks | 450 | 5.1 | |
Republican | Jerzy Samotyj | 122 | 1.4 |
Party | Candidate | Votes | % | |
---|---|---|---|---|
Republican | Robert B. Long | 16,796 | 21.2 | |
Republican | Ric Metzgar | 15,176 | 19.1 | |
Republican | Robin Grammer Jr. | 14,582 | 18.4 | |
Democratic | Nicholas C. D'Adamo, Jr. | 11,599 | 14.6 | |
Democratic | Mike Weir, Jr. (incumbent) | 11,503 | 14.5 | |
Democratic | Jake Mohorovic | 9,526 | 12.0 | |
Write-in | 97 | 0.1 | ||
Republican gain from Democratic | ||||
Republican gain from Democratic |
Party | Candidate | Votes | % | |
---|---|---|---|---|
Republican | Pat McDonough (incumbent) | 6,971 | 29.0 | |
Republican | Kathy Szeliga (incumbent) | 6,125 | 25.5 | |
Republican | Richard Impallaria (incumbent) | 5,790 | 24.1 | |
Republican | David Seman | 3,483 | 14.5 | |
Republican | Tina Sutherland | 1,675 | 7.0 |
Party | Candidate | Votes | % | |
---|---|---|---|---|
Republican | Pat McDonough (incumbent) | 35,627 | 26.9 | |
Republican | Kathy Szeliga (incumbent) | 33,197 | 25.0 | |
Republican | Rick Impallaria (incumbent) | 32,560 | 24.6 | |
Democratic | Bob Bowie, Jr. | 11,154 | 8.4 | |
Democratic | Norman Gifford, Jr. | 10,192 | 7.7 | |
Democratic | Pete Definbaugh | 9,707 | 7.3 | |
Write-in | 145 | 0.1 | ||
Republican hold | ||||
Republican hold |
Party | Candidate | Votes | % | |
---|---|---|---|---|
Democratic | Eric Bromwell (incumbent) | 5,601 | 22.8 | |
Democratic | Renee Smith | 4,632 | 18.9 | |
Democratic | Bill Paulshock | 4,512 | 18.4 | |
Democratic | Harry Bhandari | 3,828 | 15.6 | |
Democratic | Debbie Schillinger | 3,124 | 12.7 | |
Democratic | Steve Verch | 1,752 | 7.1 | |
Democratic | Kyle Arndreas Williams | 1,114 | 4.5 |
Party | Candidate | Votes | % | |
---|---|---|---|---|
Republican | Christian Miele | 20,164 | 19.4 | |
Republican | John W. E. Cluster Jr. (incumbent) | 19,938 | 19.2 | |
Democratic | Eric Bromwell (incumbent) | 17,361 | 16.7 | |
Democratic | Bill Paulshock | 15,899 | 15.3 | |
Republican | Norma Secoura | 15,660 | 15.1 | |
Democratic | Renee Smith | 14,704 | 14.2 | |
Write-in | 87 | 0.1 | ||
Democratic hold | ||||
Republican hold | ||||
Republican hold |
Party | Candidate | Votes | % | |
---|---|---|---|---|
Republican | Warren E. Miller (incumbent) | 3,354 | 29.2 | |
Republican | Trent Kittleman | 2,574 | 22.4 | |
Republican | Frank Mirabile | 2,509 | 21.8 | |
Republican | Kyle Lorton | 1,620 | 14.1 | |
Republican | Christopher Bouchat | 1,426 | 12.4 |
Party | Candidate | Votes | % | |
---|---|---|---|---|
Republican | Trent Kittleman | 24,371 | 37.5 | |
Republican | Warren E. Miller (incumbent) | 21,553 | 33.1 | |
Democratic | Walter E. Carson | 10,144 | 15.6 | |
Democratic | James Ward Morrow | 8,906 | 13.7 | |
Write-in | 99 | 0.2 | ||
Republican hold | ||||
Republican hold |
Party | Candidate | Votes | % | |
---|---|---|---|---|
Republican | Robert Flanagan | 1,069 | 56.3 | |
Republican | Carol Loveless | 831 | 43.7 |
Party | Candidate | Votes | % | |
---|---|---|---|---|
Democratic | Tom Coale | 2,054 | 62.1 | |
Democratic | Rich Corkran | 1,254 | 37.9 |
Party | Candidate | Votes | % | |
---|---|---|---|---|
Republican | Bob Flanagan | 8,202 | 54.9 | |
Democratic | Tom Coale | 6,736 | 45.1 | |
Write-in | 12 | 0.1 | ||
Republican hold |
Party | Candidate | Votes | % | |
---|---|---|---|---|
Democratic | Adrienne A. Jones (incumbent) | 8,995 | 25.4 | |
Democratic | Jay Jalisi | 6,146 | 17.4 | |
Democratic | Benjamin Brooks | 5,507 | 15.6 | |
Democratic | Carin Smith | 5,197 | 14.7 | |
Democratic | Robert "Rob" Johnson | 3,369 | 9.5 | |
Democratic | Chris Blake | 2,085 | 5.9 | |
Democratic | Michael Tyrone Brown, Sr. | 1,868 | 5.3 | |
Democratic | Regg J. Hatcher, Jr. | 1,121 | 3.2 | |
Democratic | Frederick Strickland | 1,104 | 3.1 |
Party | Candidate | Votes | % | |
---|---|---|---|---|
Democratic | Adrienne A. Jones (incumbent) | 24,104 | 29.6 | |
Democratic | Benjamin Brooks | 23,703 | 29.1 | |
Democratic | Jay Jalisi | 23,339 | 28.7 | |
Republican | William T. Newton | 9,906 | 12.2 | |
Write-in | 348 | 0.4 | ||
Democratic hold | ||||
Democratic hold |
Party | Candidate | Votes | % | |
---|---|---|---|---|
Democratic | Shelly L. Hettleman | 9,923 | 26.4 | |
Democratic | Dana Stein (incumbent) | 9,221 | 24.5 | |
Democratic | Dan K. Morhaim (incumbent) | 9,049 | 24.1 | |
Democratic | Theodore Levin | 3,998 | 10.6 | |
Democratic | Don Engel | 3,982 | 10.6 | |
Democratic | Alex B. Leikus | 1,434 | 3.8 |
Party | Candidate | Votes | % | |
---|---|---|---|---|
Democratic | Shelly Hettleman | 24,197 | 27.6 | |
Democratic | Dana Stein | 23,241 | 26.5 | |
Democratic | Dan Morhaim | 22,991 | 26.2 | |
Republican | Laura Harkins | 16,947 | 19.3 | |
Write-in | 308 | 0.4 | ||
Democratic hold | ||||
Democratic hold |
Party | Candidate | Votes | % | |
---|---|---|---|---|
Democratic | Clarence Lam | 6,307 | 21.3 | |
Democratic | Terri L. Hill | 6,059 | 20.5 | |
Democratic | Eric Ebersole | 4,427 | 14.9 | |
Democratic | Rebecca P. Dongarra | 3,782 | 12.8 | |
Democratic | Nick Stewart | 2,991 | 10.1 | |
Democratic | Renee McGuirk-Spence | 1,908 | 6.4 | |
Democratic | Brian S. Bailey | 1,576 | 5.3 | |
Democratic | Michael Gisriel | 1,246 | 4.2 | |
Democratic | Adam Sachs | 747 | 2.5 | |
Democratic | Jay Fred Cohen | 580 | 2.0 |
Party | Candidate | Votes | % | |
---|---|---|---|---|
Democratic | Eric Ebersole | 19,274 | 18.9 | |
Democratic | Terri L. Hill | 19,236 | 18.9 | |
Democratic | Clarence Lam | 18,568 | 18.2 | |
Republican | Joseph D."Joe" Hooe | 16,171 | 15.9 | |
Republican | Rick Martel | 14,290 | 14.0 | |
Republican | Gordon Bull | 14,146 | 13.9 | |
Write-in | 110 | 0.1 | ||
Democratic hold | ||||
Democratic hold |
Party | Candidate | Votes | % | |
---|---|---|---|---|
Democratic | Vanessa Atterbeary | 7,399 | 27.3 | |
Democratic | Shane Pendergrass (incumbent) | 7,364 | 27.1 | |
Democratic | Frank S. Turner (incumbent) | 6,941 | 25.6 | |
Democratic | Nayab Siddiqui | 4,204 | 15.5 | |
Democratic | Fred Eiland | 1,225 | 4.5 |
Party | Candidate | Votes | % | |
---|---|---|---|---|
Democratic | Shane Pendergrass | 23,167 | 20.8 | |
Democratic | Vanessa Atterbeary | 22,626 | 20.4 | |
Democratic | Frank S. Turner | 22,169 | 20.0 | |
Republican | Chris Yates | 14,598 | 13.1 | |
Republican | Danny Eaton | 14,434 | 13.0 | |
Republican | Jimmy Williams | 14,031 | 12.6 | |
Write-in | 94 | 0.1 | ||
Democratic hold | ||||
Democratic hold |
Party | Candidate | Votes | % | |
---|---|---|---|---|
Democratic | Anne Kaiser (incumbent) | 8,335 | 32.5 | |
Democratic | Craig Zucker (incumbent) | 7,922 | 30.9 | |
Democratic | Eric Luedtke (incumbent) | 6,647 | 25.9 | |
Democratic | Valerie A. Nia Shell | 2,763 | 10.8 |
Party | Candidate | Votes | % | |
---|---|---|---|---|
Democratic | Anne Kaiser (incumbent) | 21,988 | 20.2 | |
Democratic | Craig Zucker (incumbent) | 20,917 | 19.3 | |
Democratic | Eric Luedtke (incumbent) | 20,012 | 18.4 | |
Republican | Patricia Fenati | 15,392 | 14.2 | |
Republican | Sharon Trexler Begosh | 15,096 | 13.9 | |
Republican | Michael A. Ostroff | 15,086 | 13.9 | |
Write-in | 114 | 0.1 | ||
Democratic hold | ||||
Democratic hold |
Party | Candidate | Votes | % | |
---|---|---|---|---|
Democratic | Kathleen Dumais (incumbent) | 6,156 | 30.6 | |
Democratic | Aruna Miller (incumbent) | 5,748 | 28.6 | |
Democratic | David Fraser-Hidalgo (incumbent) | 4,447 | 22.1 | |
Democratic | Bennett Rushkoff | 3,754 | 18.7 |
Party | Candidate | Votes | % | |
---|---|---|---|---|
Democratic | Kathleen Dumais (incumbent) | 19,083 | 20.6 | |
Democratic | Aruna Miller (incumbent) | 18,071 | 19.5 | |
Democratic | David Fraser-Hidalgo (incumbent) | 17,324 | 18.7 | |
Republican | Ed Edmundson | 12,913 | 13.9 | |
Republican | Christine Thron | 12,825 | 13.8 | |
Republican | Flynn Ficker | 12,355 | 13.3 | |
Write-in | 86 | 0.1 | ||
Democratic hold | ||||
Democratic hold |
Party | Candidate | Votes | % | |
---|---|---|---|---|
Democratic | Ariana Kelly (incumbent) | 10,045 | 25.6 | |
Democratic | William Frick (incumbent) | 9,088 | 23.2 | |
Democratic | Marc Korman | 8,554 | 21.8 | |
Democratic | Hrant Jamgochian | 6,005 | 15.3 | |
Democratic | Jordan P. Cooper | 2,834 | 7.2 | |
Democratic | Peter Dennis | 1,175 | 3.0 | |
Democratic | Karen Kuker-Kihl | 809 | 2.1 | |
Democratic | Gareth E. Murray | 683 | 1.7 |
Party | Candidate | Votes | % | |
---|---|---|---|---|
Democratic | William Frick (incumbent) | 26,727 | 23.0 | |
Democratic | Marc Korman | 25,755 | 22.1 | |
Democratic | Ariana Kelly (incumbent) | 25,148 | 21.6 | |
Republican | Rose Maria Li | 15,441 | 13.3 | |
Republican | John Andrews | 11,822 | 10.2 | |
Republican | Lynda del Castillo | 11,453 | 9.8 | |
Write-in | 111 | 0.1 | ||
Democratic hold | ||||
Democratic hold |
Party | Candidate | Votes | % | |
---|---|---|---|---|
Democratic | Kumar Barve (incumbent) | 5,749 | 25.4 | |
Democratic | James W. Gilchrist (incumbent) | 4,599 | 20.3 | |
Democratic | Andrew Platt | 4,596 | 20.3 | |
Democratic | Susan Hoffmann | 4,509 | 19.9 | |
Democratic | Laurie-Anne Sayles | 2,409 | 10.6 | |
Democratic | George Zamora | 798 | 3.5 |
Party | Candidate | Votes | % | |
---|---|---|---|---|
Democratic | James W. Gilchrist (incumbent) | 19,517 | 33.6 | |
Democratic | Kumar Barve (incumbent) | 19,295 | 33.2 | |
Democratic | Andrew Platt | 18,725 | 32.2 | |
Write-in | 588 | 1.0 | ||
Democratic hold | ||||
Democratic hold |
Party | Candidate | Votes | % | |
---|---|---|---|---|
Democratic | Jeff Waldstreicher (incumbent) | 7,303 | 21.6 | |
Democratic | Ana Sol Gutierrez (incumbent) | 7,181 | 21.3 | |
Democratic | Alfred C. Carr Jr. (incumbent) | 6,437 | 19.1 | |
Democratic | Emily Shetty | 3,859 | 11.4 | |
Democratic | Rick Kessler | 3,818 | 11.3 | |
Democratic | Natali Fani-Gonzalez | 2,758 | 8.2 | |
Democratic | Elizabeth Matory | 2,389 | 7.1 |
Party | Candidate | Votes | % | |
---|---|---|---|---|
Democratic | Ana Sol Gutierrez (incumbent) | 23,406 | 33.3 | |
Democratic | Al Carr (incumbent) | 23,353 | 33.2 | |
Democratic | Jeff Waldstreicher (incumbent) | 22,736 | 32.3 | |
Write-in | 868 | 1.2 | ||
Democratic hold | ||||
Democratic hold |
Party | Candidate | Votes | % | |
---|---|---|---|---|
Democratic | Benjamin F. Kramer (incumbent) | 8,196 | 28.5 | |
Democratic | Bonnie Cullison (incumbent) | 6,279 | 21.8 | |
Democratic | Maricé Morales | 4,894 | 17.0 | |
Democratic | Charlotte Crutchfield | 4,512 | 15.7 | |
Democratic | Paul Bardack | 3,679 | 12.8 | |
Democratic | Melodye A. Berry | 1,238 | 4.3 |
Party | Candidate | Votes | % | |
---|---|---|---|---|
Democratic | Ben Kramer (incumbent) | 22,238 | 29.0 | |
Democratic | Bonnie Cullison (incumbent) | 21,394 | 27.9 | |
Democratic | Maricé Morales | 20,104 | 26.2 | |
Republican | Martha Schaerr | 12,622 | 16.5 | |
Write-in | 336 | 0.4 | ||
Democratic hold | ||||
Democratic hold |
Party | Candidate | Votes | % | |
---|---|---|---|---|
Democratic | Sheila E. Hixson (incumbent) | 9,135 | 24.5 | |
Democratic | David Moon | 6,959 | 18.7 | |
Democratic | Will Smith | 6,006 | 16.1 | |
Democratic | Will Jawando | 5,620 | 15.1 | |
Democratic | Darian Unger | 4,296 | 11.5 | |
Democratic | Jonathan Shurberg | 2,997 | 8.0 | |
Democratic | Justin W. Chappell | 1,076 | 2.9 | |
Democratic | D'Juan Hopewell | 778 | 2.1 | |
Democratic | George Zokle | 397 | 1.1 |
Party | Candidate | Votes | % | |
---|---|---|---|---|
Democratic | Sheila E. Hixson (incumbent) | 23,519 | 31.6 | |
Democratic | Will Smith | 21,989 | 29.6 | |
Democratic | David Moon | 21,646 | 29.1 | |
Green | Daniel S. Robinson | 6,801 | 9.1 | |
Write-in | 407 | 0.5 | ||
Democratic hold | ||||
Democratic hold |
Party | Candidate | Votes | % | |
---|---|---|---|---|
Democratic | Barbara A. Frush (incumbent) | 18,157 | 28.7 | |
Democratic | Ben Barnes (incumbent) | 17,235 | 27.3 | |
Democratic | Joseline Peña-Melnyk (incumbent) | 16,880 | 26.7 | |
Republican | Katherine M. Butcher | 10,610 | 16.8 | |
Write-in | 284 | 0.4 | ||
Democratic hold | ||||
Democratic hold |
Party | Candidate | Votes | % | |
---|---|---|---|---|
Democratic | Alonzo T. Washington (incumbent) | 7,504 | 31.6 | |
Democratic | Tawanna P. Gaines (incumbent) | 6,284 | 26.5 | |
Democratic | Anne Healey (incumbent) | 6,117 | 25.8 | |
Democratic | Rushern Baker IV | 3,840 | 16.2 |
Party | Candidate | Votes | % | |
---|---|---|---|---|
Democratic | Tawanna P. Gaines (incumbent) | 19,174 | 31.9 | |
Democratic | Alonzo T. Washington (incumbent) | 18,677 | 31.1 | |
Democratic | Anne Healey (incumbent) | 18,214 | 30.3 | |
Republican | Lynn White | 3,910 | 6.5 | |
Write-in | 140 | 0.2 | ||
Democratic hold | ||||
Democratic hold |
Party | Candidate | Votes | % | |
---|---|---|---|---|
Democratic | Geraldine Valentino-Smith (incumbent) | 7,666 | 72.5 | |
Independent | Shukoor Ahmed | 2,869 | 27.1 | |
Write-in | 45 | 0.4 | ||
Democratic hold |
Party | Candidate | Votes | % | |
---|---|---|---|---|
Democratic | Marvin E. Holmes Jr. (incumbent) | 6,323 | 32.8 | |
Democratic | Joseph F. Vallario Jr. (incumbent) | 5,284 | 27.4 | |
Democratic | Ron Watson | 4,357 | 22.6 | |
Democratic | Thea Wilson | 2,801 | 14.5 | |
Democratic | Reginald Tyer, Jr. | 524 | 2.7 |
Party | Candidate | Votes | % | |
---|---|---|---|---|
Democratic | Marvin E. Holmes, Jr. (incumbent) | 22,518 | 47.5 | |
Democratic | Joseph F. Vallario, Jr. (incumbent) | 19,274 | 40.6 | |
Republican | Mike Hethmon | 5,494 | 11.6 | |
Write-in | 142 | 0.3 | ||
Democratic hold | ||||
Democratic hold |
Party | Candidate | Votes | % | |
---|---|---|---|---|
Democratic | Carolyn J. B. Howard (incumbent) | 7,864 | 22.0 | |
Democratic | Michael L. Vaughn (incumbent) | 6,880 | 19.3 | |
Democratic | Erek Barron | 4,849 | 13.6 | |
Democratic | Tiffany T. Alston | 4,628 | 13.0 | |
Democratic | Marva Jo Camp | 3,691 | 10.3 | |
Democratic | Greg Hall | 3,031 | 8.5 | |
Democratic | Darren Swain (incumbent) | 2,520 | 7.1 | |
Democratic | Phillip A. Raines | 1,100 | 3.1 | |
Democratic | Delaneo L. Miller | 683 | 1.9 | |
Democratic | Durand Adrian Ford | 423 | 1.2 |
Party | Candidate | Votes | % | |
---|---|---|---|---|
Democratic | Carolyn J. B. Howard (incumbent) | 25,869 | 34.1 | |
Democratic | Michael L. Vaughn (incumbent) | 23,772 | 31.3 | |
Democratic | Erek Barron | 23,450 | 30.9 | |
Republican | Cy Okoro | 2,737 | 3.6 | |
Write-in | 116 | 0.2 | ||
Democratic hold | ||||
Democratic hold |
Party | Candidate | Votes | % | |
---|---|---|---|---|
Democratic | Dereck E. Davis (incumbent) | 9,088 | 25.7 | |
Democratic | Angela Angel | 7,104 | 20.1 | |
Democratic | Darryl Barnes | 5,702 | 16.1 | |
Democratic | Juanita D. Miller | 3,804 | 10.8 | |
Democratic | Nick Charles | 3,032 | 8.6 | |
Democratic | Matthew Fogg | 1,713 | 4.8 | |
Democratic | Tony Jones | 1,498 | 4.2 | |
Democratic | Geraldine Gerry Eggleston | 1,299 | 3.7 | |
Democratic | Larry R. Greenhill | 1,094 | 3.1 | |
Democratic | Stanley Onye | 1,014 | 2.9 |
Party | Candidate | Votes | % | |
---|---|---|---|---|
Democratic | Angela Angel | 26,792 | 36.2 | |
Democratic | Dereck E. Davis (incumbent) | 23,593 | 31.9 | |
Democratic | Darryl Barnes | 23,372 | 31.6 | |
Write-in | 161 | 0.2 | ||
Democratic hold | ||||
Democratic hold |
Party | Candidate | Votes | % | |
---|---|---|---|---|
Democratic | Jay Walker | 9,428 | 24.3 | |
Democratic | Kris Valderrama (incumbent) | 8,217 | 21.2 | |
Democratic | Tony Knotts | 8,129 | 21.0 | |
Democratic | Tamara Davis Brown | 5,698 | 14.7 | |
Democratic | David Sloan | 2,782 | 7.2 | |
Democratic | Xavier A. Aragona | 1,692 | 4.4 | |
Democratic | Keith L. Gray | 1,359 | 3.5 | |
Democratic | Vernon O. Holmes, Jr. | 877 | 2.3 | |
Democratic | Leonard C. "Len" Hopkins, Sr. | 585 | 1.5 |
Party | Candidate | Votes | % | |
---|---|---|---|---|
Democratic | Tony Knotts (incumbent) | 27,487 | 35.2 | |
Democratic | Jay Walker (incumbent) | 25,434 | 32.6 | |
Democratic | Kris Valderrama (incumbent) | 24,821 | 31.8 | |
Write-in | 287 | 0.4 | ||
Democratic hold | ||||
Democratic hold |
Party | Candidate | Votes | % | |
---|---|---|---|---|
Democratic | James E. Proctor Jr. | 10,374 | 73.7 | |
Republican | Joe Crawford | 3,685 | 26.2 | |
Write-in | 21 | 0.1 | ||
Democratic hold |
Party | Candidate | Votes | % | |
---|---|---|---|---|
Democratic | Michael A. Jackson | 2,520 | 67.9 | |
Democratic | LaRhonda R. Owens | 747 | 20.1 | |
Democratic | Jacqueline Steele McCall | 443 | 11.9 |
Party | Candidate | Votes | % | |
---|---|---|---|---|
Democratic | Michael A. Jackson | 8,434 | 52.4 | |
Republican | Philip A. Parenti | 7,637 | 47.5 | |
Write-in | 23 | 0.1 | ||
Democratic hold |
Party | Candidate | Votes | % | |
---|---|---|---|---|
Republican | Mark N. Fisher (incumbent) | 9,019 | 58.1 | |
Democratic | Sue Kullen | 6,489 | 41.8 | |
Write-in | 12 | 0.1 | ||
Republican hold |
Party | Candidate | Votes | % | |
---|---|---|---|---|
Democratic | C. T. Wilson (incumbent) | 8,302 | 25.9 | |
Democratic | Sally Y. Jameson (incumbent) | 7,249 | 22.6 | |
Democratic | Edith J. Patterson | 6,644 | 20.7 | |
Democratic | Candice Quinn Kelly | 5,966 | 18.6 | |
Democratic | John Coller | 3,913 | 12.2 |
Party | Candidate | Votes | % | |
---|---|---|---|---|
Democratic | Sally Y. Jameson (incumbent) | 25,811 | 28.7 | |
Democratic | C. T. Wilson (incumbent) | 24,202 | 26.9 | |
Democratic | Edith J. Patterson | 21,421 | 23.8 | |
Republican | Jim Crawford | 17,312 | 19.2 | |
Write-in | 1,332 | 1.5 | ||
Democratic hold | ||||
Democratic hold |
Party | Candidate | Votes | % | |
---|---|---|---|---|
Republican | Matt Morgan | 1,299 | 45.4 | |
Republican | Bryan "Puff" Barthelme | 845 | 29.5 | |
Republican | Thomas Tommy McKay | 718 | 25.1 |
Party | Candidate | Votes | % | |
---|---|---|---|---|
Republican | Matt Morgan | 8,948 | 64.8 | |
Democratic | Daniel A.M. Slade | 4,840 | 35.1 | |
Write-in | 13 | 0.1 | ||
Republican gain from Democratic |
Party | Candidate | Votes | % | |
---|---|---|---|---|
Republican | Deb Rey | 5,334 | 50.3 | |
Democratic | John L. Bohanan Jr. (incumbent) | 5,258 | 49.6 | |
Write-in | 10 | 0.1 | ||
Republican gain from Democratic |
Party | Candidate | Votes | % | |
---|---|---|---|---|
Republican | Tony O'Donnell (incumbent) | 9,924 | 68.5 | |
Democratic | Len Zuza | 4,548 | 31.4 | |
Write-in | 19 | 0.1 | ||
Republican hold |
Party | Candidate | Votes | % | |
---|---|---|---|---|
Democratic | Michael E. Busch (incumbent) | 5,255 | 39.0 | |
Democratic | Chuck Ferrar | 2,854 | 21.2 | |
Democratic | Maria Triandos | 1,864 | 13.8 | |
Democratic | Cheryl Miller | 1,779 | 13.2 | |
Democratic | Laurie Sears Deppa | 794 | 5.9 | |
Democratic | Ridg Mills | 690 | 5.1 | |
Democratic | Gordon Smith | 227 | 1.7 |
Party | Candidate | Votes | % | |
---|---|---|---|---|
Republican | Herbert H. McMillan (incumbent) | 14,484 | 27.9 | |
Democratic | Michael E. Busch (incumbent) | 14,289 | 27.6 | |
Democratic | Chuck Ferrar | 11,932 | 23.0 | |
Republican | Genevieve Lindner | 11,100 | 21.4 | |
Write-in | 56 | 0.1 | ||
Republican hold | ||||
Democratic hold |
Party | Candidate | Votes | % | |
---|---|---|---|---|
Republican | Seth A. Howard | 1,398 | 52.1 | |
Republican | Jim Fredericks | 1,283 | 47.9 |
Party | Candidate | Votes | % | |
---|---|---|---|---|
Democratic | Mitchelle Stephenson | 1,389 | 62.3 | |
Democratic | Michael J. Mcnelly | 841 | 37.7 |
Party | Candidate | Votes | % | |
---|---|---|---|---|
Republican | Seth Howard | 9,496 | 63.3 | |
Democratic | Mitchelle Stephenson | 5,496 | 36.6 | |
Write-in | 10 | 0.1 | ||
Republican hold |
Party | Candidate | Votes | % | |
---|---|---|---|---|
Democratic | Ned Carey | 1,432 | 62.8 | |
Democratic | John Moran | 590 | 25.9 | |
Democratic | Robert Haynes | 259 | 11.4 |
Party | Candidate | Votes | % | |
---|---|---|---|---|
Democratic | Ned Carey | 5,221 | 52.6 | |
Republican | Terry Lynn DeGraw | 4,698 | 47.3 | |
Write-in | 9 | 0.1 | ||
Democratic gain from Republican |
Party | Candidate | Votes | % | |
---|---|---|---|---|
Republican | Nic Kipke (incumbent) | 3,920 | 31.0 | |
Republican | Meagan Simonaire | 3,075 | 24.3 | |
Republican | Gus Kurtz | 1,779 | 14.1 | |
Republican | Brian A. Chisholm | 1,607 | 12.7 | |
Republican | Faith M. Loudon | 1,017 | 8.1 | |
Republican | Don H. Dwyer Jr. (incumbent) | 890 | 7.0 | |
Republican | Paul William Drgos, Jr. | 230 | 1.8 | |
Republican | David Lee Therrien | 111 | 0.9 |
Party | Candidate | Votes | % | |
---|---|---|---|---|
Democratic | Jeremiah Chiappelli | 2,088 | 35.9 | |
Democratic | Doug Morris | 2,048 | 35.2 | |
Democratic | Stan Janor | 1,686 | 29.0 |
Party | Candidate | Votes | % | |
---|---|---|---|---|
Republican | Nic Kipke (incumbent) | 20,858 | 39.9 | |
Republican | Meagan C. Simonaire | 19,555 | 37.4 | |
Democratic | Jeremiah Chiappelli | 6,332 | 12.1 | |
Democratic | Doug Morris | 5,394 | 10.3 | |
Write-in | 88 | 0.2 | ||
Republican hold | ||||
Republican hold |
Party | Candidate | Votes | % | |
---|---|---|---|---|
Democratic | Pamela Beidle (incumbent) | 4,631 | 25.9 | |
Democratic | Mark S. Chang | 3,910 | 21.8 | |
Democratic | Theodore J. Sophocleus (incumbent) | 3,232 | 18.0 | |
Democratic | Tonja McCoy | 2,364 | 13.2 | |
Democratic | Spencer Dove | 2,357 | 13.2 | |
Democratic | Steven D. Wyatt | 1,420 | 7.9 |
Party | Candidate | Votes | % | |
---|---|---|---|---|
Republican | Tim Walters | 2,533 | 30.2 | |
Republican | Joseph Fioravante | 2,147 | 25.6 | |
Republican | Mark Angell | 2,012 | 24.0 | |
Republican | Jesse Mayer | 1,699 | 20.2 |
Party | Candidate | Votes | % | |
---|---|---|---|---|
Democratic | Pamela Beidle (incumbent) | 17,120 | 20.0 | |
Democratic | Mark S. Chang (incumbent) | 15,904 | 18.6 | |
Democratic | Theodore J. Sophocleus (incumbent) | 14,995 | 17.5 | |
Republican | Tim Walters | 13,066 | 15.3 | |
Republican | Mark Angell | 12,327 | 14.4 | |
Republican | Joseph Fioravante | 12,012 | 14.0 | |
Write-in | 85 | 0.1 | ||
Democratic hold | ||||
Democratic hold |
Party | Candidate | Votes | % | |
---|---|---|---|---|
Republican | Cathy Vitale (incumbent) | 8,188 | 29.0 | |
Republican | Sid Saab | 5,917 | 21.0 | |
Republican | Tony McConkey (incumbent) | 4,142 | 14.7 | |
Republican | Jeff Ferguson | 3,608 | 12.8 | |
Republican | Jamie Falcon | 3,595 | 12.7 | |
Republican | Nora Keenan | 1,414 | 5.0 | |
Republican | Jeff Gauges | 1,339 | 4.7 |
Party | Candidate | Votes | % | |
---|---|---|---|---|
Republican | Cathy Vitale (incumbent) | 35,987 | 26.1 | |
Republican | Sid Saab | 29,519 | 21.4 | |
Republican | Tony McConkey (incumbent) | 27,262 | 19.8 | |
Democratic | Henry Green | 15,966 | 11.6 | |
Democratic | Tom Angelis | 15,138 | 11.0 | |
Democratic | Kostas Alexakis | 13,631 | 9.9 | |
Write-in | 198 | 0.1 | ||
Republican hold | ||||
Republican hold |
Party | Candidate | Votes | % | |
---|---|---|---|---|
Democratic | Mary Ann Lisanti | 2,473 | 29.0 | |
Democratic | Marla Posey-Moss | 1,895 | 22.2 | |
Democratic | Pat Murray | 1,784 | 20.9 | |
Democratic | Steve Johnson | 1,574 | 18.4 | |
Democratic | Maria Terry | 812 | 9.5 |
Party | Candidate | Votes | % | |
---|---|---|---|---|
Republican | Glen Glass (incumbent) | 2,314 | 48.7 | |
Republican | Mike Blizzard | 1,314 | 27.7 | |
Republican | Beth Boyson | 1,120 | 23.6 |
Party | Candidate | Votes | % | |
---|---|---|---|---|
Republican | Glen Glass (incumbent) | 10,779 | 28.4 | |
Democratic | Mary Ann Lisanti | 10,015 | 26.4 | |
Republican | Mike Blizzard | 9,041 | 23.8 | |
Democratic | Marla Posey-Moss | 8,057 | 21.2 | |
Write-in | 49 | 0.1 | ||
Republican hold | ||||
Democratic hold |
Party | Candidate | Votes | % | |
---|---|---|---|---|
Democratic | Cassandra R. Beverley | 1,731 | 77.2 | |
Democratic | Jeff Dinger | 510 | 22.8 |
Party | Candidate | Votes | % | |
---|---|---|---|---|
Republican | Susan K. McComas | 11,801 | 72.7 | |
Democratic | Cassandra R. Beverley | 4,419 | 27.2 | |
Write-in | 20 | 0.1 | ||
Republican hold |
Party | Candidate | Votes | % | |
---|---|---|---|---|
Republican | Kevin Hornberger | 1,224 | 49.5 | |
Republican | John C. Mackie, Jr. | 928 | 37.6 | |
Republican | Mary Catherine Podlesak | 319 | 12.9 |
Party | Candidate | Votes | % | |
---|---|---|---|---|
Republican | Kevin Hornberger | 6,225 | 56.5 | |
Democratic | David D. Rudolph (incumbent) | 4,778 | 43.4 | |
Write-in | 13 | 0.1 | ||
Republican gain from Democratic |
Party | Candidate | Votes | % | |
---|---|---|---|---|
Republican | Andrew Cassilly | 3,866 | 34.3 | |
Republican | Teresa E. Reilly | 3,782 | 33.5 | |
Republican | Jason C. Gallion | 3,634 | 32.2 |
Party | Candidate | Votes | % | |
---|---|---|---|---|
Republican | Andrew Cassilly | 23,556 | 42.8 | |
Republican | Teresa Reilly | 21,006 | 38.1 | |
Democratic | Jeffrey Elliott | 5,952 | 10.8 | |
Democratic | Daniel Lewis Lamey | 4,495 | 8.2 | |
Write-in | 72 | 0.1 | ||
Republican hold | ||||
Republican hold |
Party | Candidate | Votes | % | |
---|---|---|---|---|
Republican | Jay A. Jacobs (incumbent) | 6,796 | 26.8 | |
Republican | Steven J. Arentz (incumbent) | 6,372 | 25.1 | |
Republican | Jefferson L. Ghrist | 4,307 | 17.0 | |
Republican | Michael D. Smigiel Sr. (incumbent) | 4,163 | 16.4 | |
Republican | Alan McCarthy | 2,067 | 8.1 | |
Republican | J. D. Uhler | 1,048 | 4.1 | |
Republican | Rod Heinze | 641 | 2.5 |
Party | Candidate | Votes | % | |
---|---|---|---|---|
Republican | Jay A. Jacobs (incumbent) | 33,579 | 29.7 | |
Republican | Jeff Ghrist | 27,259 | 24.1 | |
Republican | Steve Arentz (incumbent) | 25,516 | 22.6 | |
Democratic | Irving Pinder | 14,045 | 12.4 | |
Democratic | Robert Alan Thornton, Jr. | 12,184 | 10.8 | |
Write-in | 313 | 0.3 | ||
Republican hold | ||||
Republican hold |
Party | Candidate | Votes | % | |
---|---|---|---|---|
Democratic | Sheree Sample-Hughes | 6,204 | 98.5 | |
Write-in | 94 | 1.5 | ||
Democratic hold |
Party | Candidate | Votes | % | |
---|---|---|---|---|
Republican | Johnny Mautz | 5,896 | 35.8 | |
Republican | Christopher T. Adams | 4,030 | 24.5 | |
Republican | Rene Desmarais | 3,082 | 18.7 | |
Republican | Karen Tolley | 1,850 | 11.2 | |
Republican | Allen Nelson | 1,604 | 9.7 |
Party | Candidate | Votes | % | |
---|---|---|---|---|
Republican | Johnny Mautz | 21,057 | 39.8 | |
Republican | Christopher T. Adams | 16,046 | 30.3 | |
Democratic | Keasha N. Haythe | 7,957 | 15.0 | |
Democratic | Rodney Benjamin | 7,852 | 14.8 | |
Write-in | 27 | 0.1 | ||
Republican hold | ||||
Republican hold |
Party | Candidate | Votes | % | |
---|---|---|---|---|
Republican | Charles J. Otto (incumbent) | 7,431 | 60.5 | |
Democratic | Percy J. Purnell, Jr. | 4,838 | 39.4 | |
Write-in | 10 | 0.1 | ||
Republican hold |
Party | Candidate | Votes | % | |
---|---|---|---|---|
Republican | Carl Anderton Jr. | 5,617 | 52.2 | |
Democratic | Norman Conway (incumbent) | 5,133 | 47.7 | |
Write-in | 5 | 0.0 | ||
Republican gain from Democratic |
Party | Candidate | Votes | % | |
---|---|---|---|---|
Democratic | Judy H. Davis | 1,605 | 84.3 | |
Democratic | Mike Hindi | 298 | 15.7 |
Party | Candidate | Votes | % | |
---|---|---|---|---|
Republican | Mary Beth Carozza | 11,611 | 73.9 | |
Democratic | Judy H. Davis | 4,100 | 26.1 | |
Write-in | 3 | 0.0 | ||
Republican hold |
Party | Candidate | Votes | % | |
---|---|---|---|---|
Democratic | Charles E. Barkley (incumbent) | 15,247 | 23.0 | |
Democratic | Shane Robinson (incumbent) | 14,179 | 21.4 | |
Democratic | Kirill Reznik (incumbent) | 13,788 | 20.8 | |
Republican | Gloria Chang | 8,117 | 12.2 | |
Republican | Al Phillips | 7,565 | 11.4 | |
Republican | Xiangfei Cheng | 7,340 | 11.1 | |
Write-in | 67 | 0.1 | ||
Democratic hold | ||||
Democratic hold |
Party | Candidate | Votes | % | |
---|---|---|---|---|
Democratic | Antonio Hayes | 4,921 | 18.9 | |
Democratic | Frank M. Conaway Jr. (incumbent) | 4,324 | 16.6 | |
Democratic | Barbara A. Robinson (incumbent) | 4,243 | 16.3 | |
Democratic | Shawn Z. Tarrant (incumbent) | 4,034 | 15.5 | |
Democratic | Marvin "Doc" Cheatham | 3,496 | 13.4 | |
Democratic | Rob "Bobby" LaPin | 1,564 | 6.0 | |
Democratic | Quianna M. Cooke | 1,169 | 4.5 | |
Democratic | Douglas R. Barry | 927 | 3.6 | |
Democratic | Bill Marker | 761 | 2.9 | |
Democratic | Timothy Mercer | 665 | 2.5 |
Party | Candidate | Votes | % | |
---|---|---|---|---|
Democratic | Antonio Hayes | 14,430 | 31.7 | |
Democratic | Frank M. Conaway, Jr. (incumbent) | 13,968 | 30.7 | |
Democratic | Barbara A. Robinson (incumbent) | 13,946 | 30.6 | |
Write-in | 3,171 | 7.0 | ||
Democratic hold | ||||
Democratic hold |
Party | Candidate | Votes | % | |
---|---|---|---|---|
Democratic | Jill P. Carter (incumbent) | 12,081 | 31.0 | |
Democratic | Nathaniel T. Oaks (incumbent) | 10,226 | 26.2 | |
Democratic | Samuel I. Rosenberg (incumbent) | 9,988 | 25.6 | |
Democratic | Joyce J. Smith | 4,028 | 10.3 | |
Democratic | Michael Pearson | 2,646 | 6.8 |
Party | Candidate | Votes | % | |
---|---|---|---|---|
Democratic | Jill P. Carter (incumbent) | 24,038 | 35.1 | |
Democratic | Samuel I. "Sandy" Rosenberg (incumbent) | 22,284 | 32.6 | |
Democratic | Nathaniel T. Oaks (incumbent) | 21,551 | 31.5 | |
Write-in | 516 | 0.7 | ||
Democratic hold | ||||
Democratic hold |
Party | Candidate | Votes | % | |
---|---|---|---|---|
Democratic | Stephen W. Lafferty | 7,776 | 60.8 | |
Republican | Michael A. McAllister | 4,999 | 39.1 | |
Write-in | 18 | 0.1 | ||
Democratic hold |
Party | Candidate | Votes | % | |
---|---|---|---|---|
Republican | Susan L. M. Aumann (incumbent) | 3,987 | 40.2 | |
Republican | Chris West | 3,499 | 35.2 | |
Republican | Joseph C. Boteler III (incumbent) | 1,912 | 19.3 | |
Republican | Jesse Filamor | 531 | 5.3 |
Party | Candidate | Votes | % | |
---|---|---|---|---|
Republican | Susan L. M. Aumann (incumbent) | 23,193 | 38.8 | |
Republican | Chris West | 19,932 | 33.3 | |
Democratic | Robbie Leonard | 8,932 | 14.9 | |
Democratic | Craig J. Little | 7,677 | 12.8 | |
Write-in | 79 | 0.1 | ||
Republican hold | ||||
Republican hold |
Party | Candidate | Votes | % | |
---|---|---|---|---|
Democratic | Maggie McIntosh (incumbent) | 11,444 | 31.8 | |
Democratic | Curt Anderson (incumbent) | 11,167 | 31.0 | |
Democratic | Mary L. Washington (incumbent) | 10,563 | 29.3 | |
Democratic | Timothy Vance | 2,863 | 7.9 |
Party | Candidate | Votes | % | |
---|---|---|---|---|
Democratic | Curt Anderson (incumbent) | 23,046 | 34.1 | |
Democratic | Maggie McIntosh (incumbent) | 22,310 | 33.0 | |
Democratic | Mary Washington (incumbent) | 21,800 | 32.3 | |
Write-in | 395 | 0.6 | ||
Democratic hold |
Party | Candidate | Votes | % | |
---|---|---|---|---|
Democratic | Keith E. Haynes (incumbent) | 1,734 | 43.4 | |
Democratic | Keiffer Mitchell Jr. (incumbent) | 1,574 | 39.4 | |
Democratic | Melvin L. Stukes (incumbent) | 691 | 17.3 |
Party | Candidate | Votes | % | |
---|---|---|---|---|
Democratic | Keith E. Haynes (incumbent) | 7,497 | 99.3 | |
Write-in | 55 | 0.7 | ||
Democratic hold |
Party | Candidate | Votes | % | |
---|---|---|---|---|
Democratic | Charles E. Sydnor III | 3,849 | 23.4 | |
Democratic | Pat Young | 3,763 | 22.9 | |
Democratic | Aaron J. Barnett | 3,729 | 22.7 | |
Democratic | Rainier Harvey | 2,936 | 17.9 | |
Democratic | Bishop Barry Chapman | 1,605 | 9.8 | |
Democratic | Frederick D. Ware-Newsome | 535 | 3.3 |
Party | Candidate | Votes | % | |
---|---|---|---|---|
Democratic | Charles E. Sydnor, III (incumbent) | 16,314 | 41.8 | |
Democratic | Pat Young | 16,013 | 41.0 | |
Republican | Michael J. Russell | 6,622 | 17.0 | |
Write-in | 109 | 0.2 | ||
Democratic hold | ||||
Democratic hold |
Party | Candidate | Votes | % | |
---|---|---|---|---|
Democratic | Cheryl Glenn (incumbent) | 6,446 | 22.3 | |
Democratic | Talmadge Branch (incumbent) | 6,120 | 21.2 | |
Democratic | Cory V. McCray | 5,624 | 19.5 | |
Democratic | Robert Stokes, Sr. | 4,867 | 16.9 | |
Democratic | Kevin W. Parson | 1,842 | 6.4 | |
Democratic | Marques Dent | 1,793 | 6.2 | |
Democratic | Harry Spikes | 1,414 | 4.9 | |
Democratic | Aaron Keith Wilkes | 738 | 2.6 |
Party | Candidate | Votes | % | |
---|---|---|---|---|
Democratic | Cheryl Glenn (incumbent) | 18,197 | 29.3 | |
Democratic | Talmadge Branch (incumbent) | 18,058 | 29.1 | |
Democratic | Cory V. McCray | 17,123 | 27.6 | |
Republican | Rick Saffery | 3,078 | 5.0 | |
Republican | Larry O. Wardlow, Jr. | 2,805 | 4.5 | |
Libertarian | Ronald M. Owens-Bey | 2,734 | 4.4 | |
Write-in | 117 | 0.2 | ||
Democratic hold | ||||
Democratic hold |
Party | Candidate | Votes | % | |
---|---|---|---|---|
Democratic | Brooke Lierman | 6,014 | 28.1 | |
Democratic | Peter A. Hammen (incumbent) | 5,400 | 25.2 | |
Democratic | Luke Clippinger (incumbent) | 5,123 | 23.9 | |
Democratic | Bill Romani | 3,139 | 14.7 | |
Democratic | Liam F. Davis | 1,745 | 8.1 |
Party | Candidate | Votes | % | |
---|---|---|---|---|
Democratic | Brooke Lierman | 13,889 | 24.6 | |
Democratic | Peter A. Hammen (incumbent) | 13,217 | 23.4 | |
Democratic | Luke Clippinger (incumbent) | 12,680 | 22.5 | |
Republican | Roger D. Bedingfield | 6,113 | 10.8 | |
Republican | Joseph "Joh" Sedtal | 5,275 | 9.4 | |
Republican | Duane Shelton | 5,115 | 9.1 | |
Write-in | 117 | 0.2 | ||
Democratic hold | ||||
Democratic hold |
Party | Candidate | Votes | % | |
---|---|---|---|---|
Democratic | Jimmy Tarlau | 2,728 | 26.7 | |
Democratic | Diana M. Fennell | 2,416 | 23.7 | |
Democratic | Michael G. Summers (incumbent) | 1,740 | 17.1 | |
Democratic | Malcolm Augustine | 1,688 | 16.6 | |
Democratic | Joseph Solomon | 1,627 | 16.0 |
Party | Candidate | Votes | % | |
---|---|---|---|---|
Democratic | Diana M. Fennell | 11,198 | 52.1 | |
Democratic | Jimmy Tarlau | 8,836 | 41.1 | |
Republican | Fred Price, Jr. | 1,424 | 6.6 | |
Write-in | 55 | 0.3 | ||
Democratic hold | ||||
Democratic hold |
Party | Candidate | Votes | % | |
---|---|---|---|---|
Democratic | Will Campos | 3,182 | 99.3 | |
Write-in | 21 | 0.7 | ||
Democratic hold |
Richard K. Impallaria is an American politician who served as a member of the Maryland House of Delegates, representing District 7 in Baltimore and Harford counties, from 2003 to 2023.
Mary-Dulany James is an American politician who has represented District 34 in the Maryland Senate since 2023. She was previously a member of the District 34A in the Maryland House of Delegates for sixteen years, representing Harford and Cecil Counties along the U.S. Route 40 corridor. Mary-Dulany James represented district 34A, formerly district 34, for 16 years having first been elected in 1998.
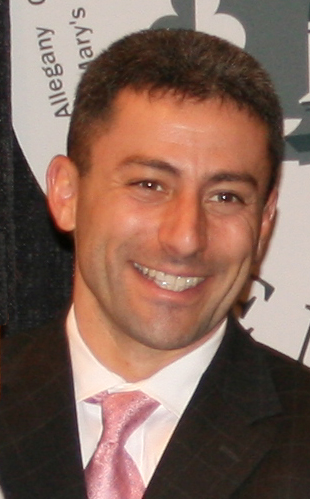
Robert Alan Zirkin is an American politician who was a member of the Maryland Senate from the 11th district from 2007 to 2020. A member of the Democratic Party, he previously represented the district in the Maryland House of Delegates from 1999 to 2007.
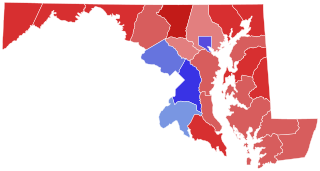
The 2014 Maryland gubernatorial election took place on November 4, 2014, to elect the governor and lieutenant governor of Maryland. Incumbent Democratic governor Martin O'Malley was term-limited and could not run for re-election to a third consecutive term.
The 1994 Maryland Senate election were held on November 8, 1994, to elect senators in all 47 districts of the Maryland Senate. Members were elected in single-member constituencies to four-year terms. These elections were held concurrently with various federal and state elections, including for Governor of Maryland.
The Maryland Attorney General election of 2014 was held on November 4, 2014, to elect the Attorney General of Maryland. Incumbent Democratic Attorney General Doug Gansler was eligible to seek a third term in office, but instead ran unsuccessfully for the Democratic nomination for Governor of Maryland.
The Maryland Comptroller election of 2014 was held on November 4, 2014, to elect the Comptroller of Maryland. Incumbent Democratic Comptroller Peter Franchot ran for re-election to a third term in office.
Elections for the Maryland Senate were held on November 6, 2018, with all 47 seats being contested. Republicans had initially hoped to break the Democrats' supermajority in the upper chamber by knocking off five incumbents, known as their "Drive for Five" plan. Though they did make a net gain of one seat, they came short of their goal. Three seats switched hands: District 9 in Carroll and Howard Counties flipped from Republican to Democratic while District 38 in Somerset, Wicomico, and Worcester Counties and District 42 in Baltimore County both flipped from Democrats to Republicans.
Charles J. Otto is an American politician and farmer serving as a Republican member of the Maryland House of Delegates representing district 38A since 2011.
The 2018 Maryland House of Delegates elections were held on November 6, 2018, as part of the biennial United States elections. All 141 of Maryland's state delegates were up for reelection.
The 2014 Maryland Senate election were held on November 4, 2014, to elect senators in all 47 districts of the Maryland Senate. Members were elected in single-member constituencies to four-year terms. These elections were held concurrently with various federal and state elections, including for Governor of Maryland.
The 2010 Maryland House of Delegates election was held on November 2, 2010, electing all 141 members of the chamber. This coincided with the election of all 47 of Maryland's state senators, along with other statewide offices.
The 2002 Maryland Senate election were held on November 5, 2002, to elect senators in all 47 districts of the Maryland Senate. Members were elected in single-member constituencies to four-year terms. These elections were held concurrently with various federal and state elections, including for Governor of Maryland.
The 2002 Maryland House of Delegates elections were held on November 5, 2002, as part of the 2002 United States elections, including the 2002 Maryland gubernatorial election. All 141 of Maryland's state delegates were up for reelection.
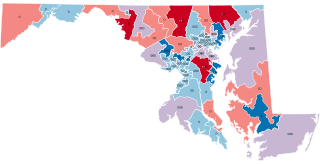
The 1998 Maryland House of Delegates elections were held on November 3, 1998, as part of the 1998 United States elections, including the 1998 Maryland gubernatorial election. All 141 of Maryland's state delegates were up for reelection.
The 1998 Maryland Senate election were held on November 3, 1998, to elect senators in all 47 districts of the Maryland Senate. Members were elected in single-member constituencies to four-year terms. These elections were held concurrently with various federal and state elections, including for Governor of Maryland.
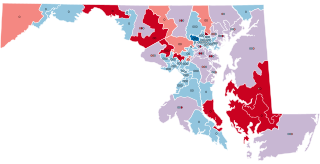
The 1994 Maryland House of Delegates elections were held on November 8, 1994, as part of the 1994 United States elections, including the 1994 Maryland gubernatorial election. All 141 of Maryland's state delegates were up for reelection.
The 1990 Maryland House of Delegates elections were held on November 6, 1990, as part of the 1990 United States elections, including the 1990 Maryland gubernatorial election. All 141 of Maryland's state delegates were up for reelection.
The 1986 Maryland House of Delegates elections were held on November 4, 1986, as part of the 1986 United States elections, including the 1986 Maryland gubernatorial election. All 141 of Maryland's state delegates were up for reelection.
The 1982 Maryland Senate elections were held on November 2, 1982, as part of the 1982 United States elections, including the 1982 Maryland gubernatorial election. All 47 of Maryland's state senators were up for reelection.