![]() | ||||||||||||||||||||||||||
| ||||||||||||||||||||||||||
Turnout | 74.00% ![]() | |||||||||||||||||||||||||
---|---|---|---|---|---|---|---|---|---|---|---|---|---|---|---|---|---|---|---|---|---|---|---|---|---|---|
| ||||||||||||||||||||||||||
| ||||||||||||||||||||||||||
|
Elections in Maryland |
---|
![]() |
![]() |
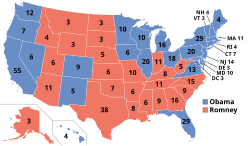
The 2012 United States presidential election in Maryland took place on November 6, 2012, as part of the 2012 United States presidential election in which all 50 states plus the District of Columbia participated. Maryland voters chose 10 electors to represent them in the Electoral College via a popular vote pitting incumbent Democratic President Barack Obama and his running mate, Vice President Joe Biden, against Republican challenger and former Massachusetts Governor Mitt Romney and his running mate, Congressman Paul Ryan.
Maryland is one of six states where Obama performed better in 2012 than in 2008, with his percentage of the vote increasing from 61.92% to 61.97%. He flipped Somerset County but lost Kent County which he won in 2008. In this election, Maryland voted 22.21% to the left of the nation at-large. [2]
As of the 2024 presidential election, this is the last time a Republican won Anne Arundel County and a Democrat won Somerset County.
![]() | This section is empty. You can help by adding to it. (June 2022) |
![]() | |||||||||||||||||||||||||||||||||||||||||
| |||||||||||||||||||||||||||||||||||||||||
| |||||||||||||||||||||||||||||||||||||||||
Romney: 30–40% 40–50% 50–60% Santorum: 40–50% 50–60% |
The Republican primary took place on April 3, 2012, the same day as the District of Columbia Republican primary and the Wisconsin Republican primary. [3] After the primary, 37 delegates were selected to attend the Republican National Convention.
Candidate | Votes | Percentage | Delegates |
---|---|---|---|
![]() | 117,527 | 49.2% | 37 |
Rick Santorum | 69,020 | 28.9% | 0 |
Newt Gingrich | 26,088 | 10.9% | 0 |
Ron Paul | 22,698 | 9.5% | 0 |
Jon Huntsman, Jr. | 1,406 | 0.6% | 0 |
Rick Perry | 1,041 | 0.4% | 0 |
Buddy Roemer | 858 | 0.4% | 0 |
Fred Karger | 342 | 0.1% | 0 |
Unprojected delegates: | 3 | ||
Total: | 238,987 | 100% | 37 |
Elections in Maryland |
---|
![]() |
![]() |
![]() | |
---|---|
Democratic Party | |
Republican Party | |
Minor parties | |
Related races | |
| |
Candidate | Delegates | Percentage |
---|---|---|
Jill Stein | 5 | 83% |
Roseanne Barr | 1 | 17% |
Others | - | - |
Total | 6 | 100% |
Candidate | Delegates | Percentage |
---|---|---|
Gary Johnson | 9 | 64% |
R. Lee Wrights | 4 | 29% |
Carl Person | 1 | 7% |
Others | - | - |
Total | 14 | 100% |
Source | Ranking | As of |
---|---|---|
Huffington Post [9] | Safe D | November 6, 2012 |
CNN [10] | Safe D | November 6, 2012 |
New York Times [11] | Safe D | November 6, 2012 |
Washington Post [12] | Safe D | November 6, 2012 |
RealClearPolitics [13] | Solid D | November 6, 2012 |
Sabato's Crystal Ball [14] | Solid D | November 5, 2012 |
FiveThirtyEight [15] | Solid D | November 6, 2012 |
2012 United States presidential election in Maryland [16] | ||||||
---|---|---|---|---|---|---|
Party | Candidate | Running mate | Votes | Percentage | Electoral votes | |
Democratic | Barack Obama (incumbent) | Joe Biden (incumbent) | 1,677,844 | 61.97% | 10 | |
Republican | Mitt Romney | Paul Ryan | 971,869 | 35.90% | 0 | |
Libertarian | Gary Johnson | Jim Gray | 30,195 | 1.12% | 0 | |
Green | Jill Stein | Cheri Honkala | 17,110 | 0.63% | 0 | |
Others | 10,309 | 0.38% | 0 | |||
Totals | 2,707,327 | 100.00% | 10 | |||
Voter turnout (registered voters) | 69.4% |
County | Barack Obama Democratic | Mitt Romney Republican | Various candidates Other parties | Margin | Total votes cast | ||||
---|---|---|---|---|---|---|---|---|---|
# | % | # | % | # | % | # | % | ||
Allegany | 9,805 | 32.85% | 19,230 | 64.42% | 815 | 2.73% | -9,425 | -31.57% | 29,850 |
Anne Arundel | 126,635 | 48.68% | 126,832 | 48.75% | 6,688 | 2.57% | -197 | -0.07% | 260,155 |
Baltimore | 220,322 | 57.26% | 154,908 | 40.26% | 9,552 | 2.48% | 65,414 | 17.00% | 384,782 |
Baltimore City | 221,478 | 87.19% | 28,171 | 11.09% | 4,356 | 1.71% | 193,307 | 76.10% | 254,005 |
Calvert | 20,529 | 45.10% | 23,952 | 52.62% | 1,037 | 2.28% | -3,423 | -7.52% | 45,518 |
Caroline | 4,970 | 37.21% | 8,098 | 60.63% | 289 | 2.16% | -3,128 | -23.42% | 13,357 |
Carroll | 27,939 | 31.92% | 56,761 | 64.84% | 2,836 | 3.24% | -28,822 | -32.92% | 87,536 |
Cecil | 16,557 | 38.98% | 24,806 | 58.39% | 1,117 | 2.63% | -8,249 | -19.41% | 42,480 |
Charles | 48,774 | 64.84% | 25,178 | 33.47% | 1,270 | 1.69% | 23,596 | 31.37% | 75,222 |
Dorchester | 7,257 | 46.99% | 7,976 | 51.64% | 211 | 1.37% | -719 | -4.65% | 15,444 |
Frederick | 55,146 | 47.09% | 58,798 | 50.21% | 3,171 | 2.71% | -3,652 | -3.12% | 117,115 |
Garrett | 3,124 | 23.74% | 9,743 | 74.05% | 290 | 2.20% | -6,619 | -50.31% | 13,157 |
Harford | 49,729 | 39.48% | 72,911 | 57.89% | 3,314 | 2.63% | -23,182 | -18.41% | 125,954 |
Howard | 91,393 | 59.69% | 57,758 | 37.72% | 3,957 | 2.58% | 33,635 | 21.97% | 153,108 |
Kent | 4,842 | 48.89% | 4,870 | 49.17% | 192 | 1.94% | -28 | -0.28% | 9,904 |
Montgomery | 323,400 | 70.92% | 123,353 | 27.05% | 9,239 | 2.03% | 200,047 | 43.87% | 455,992 |
Prince George's | 347,938 | 89.73% | 35,734 | 9.22% | 4,072 | 1.05% | 312,204 | 80.51% | 387,744 |
Queen Anne's | 8,556 | 34.38% | 15,823 | 63.58% | 509 | 2.05% | -7,267 | -29.20% | 24,888 |
St. Mary's | 19,711 | 41.22% | 26,797 | 56.03% | 1,316 | 2.75% | -7,086 | -14.81% | 47,824 |
Somerset | 5,240 | 50.39% | 5,042 | 48.49% | 117 | 1.13% | 198 | 1.90% | 10,399 |
Talbot | 8,808 | 43.05% | 11,339 | 55.42% | 312 | 1.53% | -2,531 | -12.37% | 20,459 |
Washington | 25,042 | 39.90% | 36,074 | 57.48% | 1,639 | 2.61% | -11,032 | -17.58% | 62,755 |
Wicomico | 19,635 | 46.46% | 21,764 | 51.50% | 860 | 2.04% | -2,129 | -5.04% | 42,259 |
Worcester | 11,014 | 40.17% | 15,951 | 58.17% | 455 | 1.66% | -4,937 | -18.00% | 27,420 |
Totals | 1,677,844 | 61.97% | 971,869 | 35.90% | 57,614 | 2.13% | 705,975 | 26.07% | 2,707,327 |
Obama won seven of the state's eight congressional districts. [17]
District | Obama | Romney | Representative |
---|---|---|---|
1st | 38% | 60% | Andy Harris |
2nd | 63% | 35% | Dutch Ruppersberger |
3rd | 61% | 37% | John Sarbanes |
4th | 78% | 21% | Donna Edwards |
5th | 66% | 32% | Steny Hoyer |
6th | 55% | 43% | John Delaney |
7th | 76% | 22% | Elijah Cummings |
8th | 62% | 36% | Chris Van Hollen |