2012 United States presidential election in Montana

Last updated

2012 United States presidential election in Montana
Flag of Montana.svg
  2008 November 6, 2012 2016  
  Mitt Romney by Gage Skidmore 6 cropped.jpg President Barack Obama, 2012 portrait crop.jpg
Nominee Mitt Romney Barack Obama
Party Republican Democratic
Home state Massachusetts Illinois
Running mate Paul Ryan Joe Biden
Electoral vote30
Popular vote267,928201,839
Percentage55.30%41.66%

Montana Presidential Election Results 2012.svg
County results

President before election

Barack Obama
Democratic

Elected President

Barack Obama
Democratic

The 2012 United States presidential election in Montana took place on November 6, 2012, as part of the 2012 United States presidential election in which all 50 states plus the District of Columbia participated. Montana voters chose three electors to represent them in the Electoral College via a popular vote pitting incumbent Democratic President Barack Obama and his running mate, Vice President Joe Biden, against Republican challenger and former Massachusetts Governor Mitt Romney and his running mate, Congressman Paul Ryan.

Contents

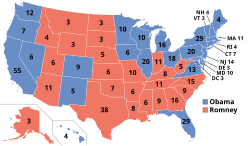
Romney carried Montana with 55.30% of the vote to Obama's 41.66%, with a 13.64% margin of victory. Montana was the second-best state performance for Libertarian candidate Gary Johnson, carrying about 3% of the vote.

Romney performed much better than John McCain had in 2008, when he narrowly won over Obama with only a 2.38% margin of victory. Romney also won over five counties that voted for Obama in 2008. Most of the counties Obama won were either majority Native American (such as Big Horn, Blaine, Glacier, and Roosevelt) or have some of Montana's most populous cities and towns, such as Missoula County (containing its namesake city, the second largest in the state and home of the University of Montana) and Silver Bow County (home to Butte and Montana Tech). As of the 2024 presidential election, this is the last time that a Republican has won Gallatin County or that a Democrat has won Hill County or Roosevelt County.

Obama remains the only Democrat since statehood to win two terms in the White House without carrying Montana either time. [1]

Primary elections

Democratic primary

Republican primary

2012 Montana Republican presidential caucuses
Flag of Montana.svg
  2008 June 16, 2012 (2012-06-16) 2016  
  Mitt Romney by Gage Skidmore 6 cropped.jpg Ron Paul by Gage Skidmore 3 (crop 2).jpg Rick Santorum by Gage Skidmore.jpg
Candidate Mitt Romney Ron Paul Rick Santorum
Home state Massachusetts Texas Pennsylvania

Montana Republican presidential primary election results by county, 2012.svg
Montana results by county
  Mitt Romney
(Note: Italicization indicates a withdrawn candidacy)
Members of the Montana delegation at the 2012 Republican National Convention Montana Delegates at 2012 RNC (cropped1).jpg
Members of the Montana delegation at the 2012 Republican National Convention

The Republican caucuses took place on June 14 to 16, 2012 as the Montana state convention. Ten days before, the state delegates were selected by the central committee in each county [2] [3] [4] 23 delegates were to have been chosen, for a total of 26 delegates to go to the national convention. Prior to selecting delegates, a non-binding primary election was held June 5, 2012. Results were announced before the Republican National Convention in August.

2012 Montana Republican presidential primary [5]
CandidateVotesPercentageDelegates
Mitt Romney 96,12168.4%
Ron Paul 20,22714.4%
Rick Santorum 12,5468.9%
Newt Gingrich 6,1074.3%
No Preference5,4563.9%
Unpledged delegates:25
Total:140,45726
Key:Withdrew prior to contest

General election

Predictions

SourceRankingAs of
Huffington Post [6] Safe RNovember 6, 2012
CNN [7] Safe RNovember 6, 2012
New York Times [8] Safe RNovember 6, 2012
Washington Post [9] Safe RNovember 6, 2012
RealClearPolitics [10] Solid RNovember 6, 2012
Sabato's Crystal Ball [11] Solid RNovember 5, 2012
FiveThirtyEight [12] Solid RNovember 6, 2012

Results

2012 United States presidential election in Montana [13]
PartyCandidateVotes%
Republican Mitt Romney 267,928 55.30
Democratic Barack Obama (incumbent)201,83941.66
Libertarian Gary Johnson 14,1652.93
OthersOthers1160.02
Total votes484,048 100.0

By county

CountyMitt Romney
Republican
Barack Obama
Democratic
Various candidates
Other parties
MarginTotal
#%#%#%#%
Beaverhead 3,28968.35%1,37128.49%1523.16%1,91839.86%4,812
Big Horn 1,66736.04%2,88262.30%771.66%-1,215-26.26%4,626
Blaine 1,17841.20%1,61656.52%652.28%-438-15.32%2,859
Broadwater 2,15271.47%76425.37%953.16%1,38846.10%3,011
Carbon 3,53360.42%2,14636.70%1682.88%1,38723.72%5,847
Carter 67885.18%9612.06%222.76%58273.12%796
Cascade 18,34553.06%15,23244.05%9992.89%3,1139.01%34,576
Chouteau 1,75862.32%97834.67%853.01%78027.65%2,821
Custer 3,37362.87%1,83334.17%1592.96%1,54028.70%5,365
Daniels 74073.49%23723.54%302.97%50349.95%1,007
Dawson 3,02968.48%1,21927.56%1753.96%1,81040.92%4,423
Deer Lodge 1,44832.47%2,86064.13%1523.40%-1,412-31.66%4,460
Fallon 1,12880.23%23716.86%412.91%89163.37%1,406
Fergus 4,25770.12%1,64027.01%1742.87%2,61743.11%6,071
Flathead 28,30964.47%13,89231.64%1,7083.89%14,41732.83%43,909
Gallatin 24,35850.84%21,96145.84%1,5893.32%2,3975.00%47,908
Garfield 62288.73%669.42%131.85%55679.31%701
Glacier 1,41531.76%2,92465.63%1162.61%-1,509-33.87%4,455
Golden Valley 35173.28%11022.96%183.76%24150.32%479
Granite 1,10764.93%53331.26%653.81%57433.67%1,705
Hill 3,16446.36%3,40349.86%2583.78%-239-3.50%6,825
Jefferson 4,05562.18%2,27234.84%1942.98%1,78327.34%6,521
Judith Basin 85470.29%33727.74%241.97%51742.55%1,215
Lake 7,13553.63%5,80543.63%3642.74%1,33010.00%13,304
Lewis and Clark 16,80350.43%15,62046.88%8952.69%1,1833.55%33,318
Liberty 70270.34%25725.75%393.91%44544.59%998
Lincoln 6,05768.13%2,55228.71%2813.16%3,50539.42%8,890
Madison 3,13069.06%1,28928.44%1132.50%1,84140.62%4,532
McCone 74575.03%22322.46%252.51%52252.57%993
Meagher 67068.93%26927.67%333.40%40141.26%972
Mineral 1,21660.17%70034.64%1055.19%51625.53%2,021
Missoula 22,65239.58%32,82457.35%1,7563.07%-10,172-17.77%57,232
Musselshell 1,83376.15%49220.44%823.41%1,34155.71%2,407
Park 4,70953.71%3,78343.15%2763.14%92610.56%8,768
Petroleum 24080.54%4916.44%93.02%19164.10%298
Phillips 1,68875.76%47121.14%693.10%1,21754.62%2,228
Pondera 1,67361.53%97535.86%712.61%69825.67%2,719
Powder River 83381.11%17016.55%242.34%66364.56%1,027
Powell 1,80665.03%88831.98%832.99%91833.05%2,777
Prairie 52073.97%16723.76%162.27%35350.21%703
Ravalli 14,30764.41%7,28532.80%6202.79%7,02231.61%22,212
Richland 3,51075.52%1,00221.56%1362.92%2,50853.96%4,648
Roosevelt 1,51441.23%2,08656.81%721.96%-572-15.58%3,672
Rosebud 2,00456.88%1,42240.36%1522.76%58216.52%3,523
Sanders 3,98067.45%1,72029.15%2013.40%2,26038.30%5,901
Sheridan 1,20762.60%66534.49%562.91%54228.11%1,928
Silver Bow 5,43032.41%10,85764.79%4692.80%-5,427-32.38%16,756
Stillwater 3,33770.97%1,24826.54%1172.49%2,08944.43%4,702
Sweet Grass 1,59475.30%47522.44%482.26%1,11952.86%2,117
Teton 2,11364.40%1,08232.98%862.62%1,03131.42%3,281
Toole 1,44068.51%58227.69%803.80%85840.82%2,102
Treasure 31970.11%11425.05%224.84%20545.06%455
Valley 2,33760.56%1,38535.89%1373.55%95224.67%3,859
Wheatland 69369.86%27227.42%272.72%42142.44%992
Wibaux 42177.39%9818.01%254.60%32359.38%544
Yellowstone 40,50058.86%26,40338.37%1,9042.77%14,09720.49%68,807
Totals267,92855.30%201,83941.66%14,7173.04%66,08913.64%484,484
County Flips:
Democratic
Hold
Republican
Hold
Gain from Democratic Montana County Flips 2012.svg
County Flips:
Counties that flipped from Democratic to Republican

By congressional district

Due to the state's low population, only one congressional district is allocated, the At-Large District. This district covers the entire state, and thus is equivalent to the statewide election results.

DistrictRomneyObamaRepresentative
At-large 55.35%41.7% Steve Daines

See also

References

  1. Leip, Dave. "Montana Election Results". US Election Atlas. Retrieved October 2, 2022.
  2. "Primary and Caucus Printable Calendar". CNN . Retrieved January 11, 2012.
  3. "Presidential Primary Dates" (PDF). Federal Election Commission . Retrieved January 23, 2012.
  4. "Montana Republican Delegation 2012".
  5. unofficial election results Archived 2014-10-21 at the Wayback Machine . Secretary of State. June 22, 2012. Retrieved July 2, 2012.
  6. "Huffington Post Election Dashboard". HuffPost . Archived from the original on August 13, 2013.
  7. "America's Choice 2012 Election Center: CNN Electoral Map". CNN . Archived from the original on January 19, 2013.
  8. "Election 2012 - The Electoral Map: Building a Path to Victory". The New York Times . Archived from the original on July 8, 2012.
  9. "2012 Presidential Election Results" . The Washington Post. Archived from the original on July 26, 2012.
  10. "RealClearPolitics - 2012 Election Maps - Battle for White House". Archived from the original on June 8, 2011.
  11. "PROJECTION: OBAMA WILL LIKELY WIN SECOND TERM".
  12. "Nate Silver's political calculations predict 2012 election outcome".
  13. Election results