2012 United States presidential election in New York

Last updated

2012 United States presidential election in New York
Flag of New York (1901-2020).svg
  2008 November 6, 2012 2016  
Turnout59.2% Decrease2.svg 4.2 pp
  President Barack Obama, 2012 portrait crop.jpg Mitt Romney by Gage Skidmore 6 cropped.jpg
Nominee Barack Obama Mitt Romney
Party Democratic Republican
Alliance Working Families Conservative
Home state Illinois Massachusetts
Running mate Joe Biden Paul Ryan
Electoral vote290
Popular vote4,485,7412,490,431
Percentage63.35%35.17%

New York Presidential Election Results 2012.svg
New York Presidential Results 2012 by Municipality.svg
NY-12-pres-districts.svg

President before election

Barack Obama
Democratic

Elected President

Barack Obama
Democratic

The 2012 United States presidential election in New York took place on November 6, 2012, as part of the 2012 United States presidential election in which all 50 states plus the District of Columbia participated. Voters chose 29 electors to represent them in the Electoral College via a popular vote pitting incumbent Democratic President Barack Obama and his running mate, Vice President Joe Biden, against Republican challenger and former Massachusetts Governor Mitt Romney and his running mate, Congressman Paul Ryan.

Contents

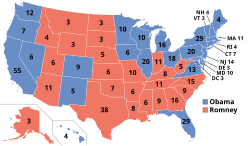
Barack Obama carried the state of New York by a landslide margin, winning 63.35% of the vote to Mitt Romney's 35.17%. [1] As in previous elections, the Democratic ticket easily won, for the most part due to racking up very large margins in New York City (which in and of itself makes up 42.2% of the state's population) and its metropolitan area. The city alone garnered Obama 1,995,241 votes (or 81.19% of the vote in the city). He also managed to win Staten Island (Richmond County), despite failing to carry it in 2008. Putnam County, which McCain won in 2008, was the only county in the NYC metropolitan area that Obama lost to Romney. The rest of his votes mostly came from Albany, Buffalo, Ithaca, Rochester, Syracuse, and their respective metropolitan areas, giving him a solid 28.18% lead over Romney. Obama even won in many rural counties. The Republicans won only in some rural parts of upstate and western New York.

New York was 1 of only 6 states to swing in President Obama's favor from 2008 to 2012, giving him the largest percentage of the vote for any presidential candidate in the state since 1964 and the second largest Democratic vote share in the state in history. Similar to New Jersey, some news outlets, such as the New York Times, have proposed that Obama's improved performance in these states – as opposed to worsened performances in areas like the Rust Belt – was due to his handling of Hurricane Sandy, which made landfall on October 29. [2] Mayor of New York City Michael Bloomberg, a Republican-turned-Independent, endorsed Obama due to the federal government's handling of the hurricane. [3]

As of the 2020 presidential election, this is the last time the Democratic nominee won the following counties: Cayuga, Cortland, Franklin, Madison, Niagara, Orange, Oswego, Otsego, Richmond (Staten Island), Seneca, St. Lawrence, Suffolk, Sullivan, Warren, and Washington. This is also the last presidential election in New York in which the Democratic nominee won more counties than the Republican nominee. In subsequent elections, despite Republicans winning more counties, they have been unable to break through the huge Democratic advantage in New York City and its suburbs, ensuring that the state has remained solidly blue.

Primary elections

Democratic primary

Incumbent President Barack Obama ran uncontested in the Democratic primary, and it was therefore cancelled. [4]

Republican primary

2012 New York Republican presidential primary
Flag of New York (1901-2020).svg
  2008 April 24, 2012 (2012-04-24) 2016  
  Mitt Romney by Gage Skidmore 6 cropped.jpg Ron Paul by Gage Skidmore 3 (crop 2).jpg
Candidate Mitt Romney Ron Paul
Home state Massachusetts Texas
Delegate count920
Popular vote118,91227,699
Percentage62.42%14.54%

  Newt Gingrich by Gage Skidmore 3 (cropped).jpg Rick Santorum by Gage Skidmore.jpg
Candidate Newt Gingrich Rick Santorum
Home state Georgia Pennsylvania
Delegate count00
Popular vote23,99018,997
Percentage12.59%9.97%

New York Republican Presidential Primary Election Results by County, 2012.svg
New York results by county
  Mitt Romney
(Note: Italicization indicates a withdrawn candidacy)
2012 New York Republican presidential primary [5]
CandidateVotesPercentageProjected delegate count
AP CNN
FOX
America Symbol.svg Mitt Romney 118,91262.42%9292
Ron Paul 27,69914.54%00
Newt Gingrich 23,99012.59%10
Rick Santorum (withdrawn)18,9979.97%00
Blank8100.43%00
Void1060.06%00
Scattering10.00%00
Unprojected delegates:2395
Total:190,515100.00%959595

The 2012 New York Republican presidential primary took place on April 24, 2012. [6] [7]

By county, Romney won a plurality in every county, and a majority in all but six: Niagara, Cattaraugus, Wyoming, Orleans, Schuyler, Herkimer and Oswego.

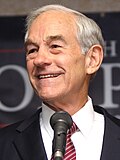
Paul finished second in most counties. Santorum finished second in Otsego County. Gingrich finished second in two geographic areas: a cluster of counties in the Catskills and Hudson Valley (Orange, Rockland, Sullivan, and Westchester) and in most of the counties of Western New York (Allegany, Cattaraugus, Erie, Genesee, Niagara, and Wyoming), in addition to Herkimer and Oneida counties. [5] Gingrich's relative strength in Western New York, as well as in Herkimer, can be attributed to the continued popularity and efforts of Carl Paladino, who carried those counties in the previous gubernatorial election and campaigned on Gingrich's behalf. The majority of New York politicians had endorsed Romney while the primary election was still competitive.

General election

Candidate ballot access

Write-in candidate access:

Results

2012 United States presidential election in New York [8]
PartyCandidateRunning mateVotesPercentageElectoral votes
Democratic Barack Obama4,337,62261.25%
Working Families Barack Obama148,1192.09%
Total Barack H. Obama (Incumbent) Joseph R. Biden Jr. (Incumbent)4,485,74163.35%29
Republican Mitt Romney2,228,06031.46%
Conservative Mitt Romney262,3713.71%
Total Willard M. Romney Paul D. Ryan 2,490,43135.17%0
Libertarian Gary Johnson Jim Gray 47,2560.67%0
Green Jill Stein Cheri Honkala 39,9820.56%0
Write-InsWrite-Ins9,0760.13%0
Constitution Virgil Goode Jim Clymer6,2740.09%0
Socialism and Liberation Peta Lindsay Yari Osorio 2,0500.03%0
Justice (Write-in) Rocky Anderson (Write-in) Luis J. Rodriguez 217<0.01%0
Freedom Socialist (Write-in)Stephen DurhamChristina López34<0.01%0
America's (Write-in) Tom Hoefling J.D. Ellis34<0.01%0
Socialist Workers (Write-in) James Harris Maura DeLuca 27<0.01%0
Socialist Equality (Write-in) Jerry White Phyllis Scherrer19<0.01%0
Twelve Visions (Write-in)Jill ReedTom Cary12<0.01%0
American Third Position (Write-in) Merlin Miller Virginia Abernethy 6<0.01%0
Totals7,081,159100.00%29
Voter Turnout (Registered)59.2%

New York City results

2012 Presidential Election in New York City Manhattan The Bronx Brooklyn Queens Staten Island Total
Democratic-
Working Families
Barack Obama 502,674339,211604,443470,73278,1811,995,24181.19%
83.7%91.45%82.02%79.08%50.7%
Republican-
Conservative
Mitt Romney 89,55929,967124,551118,58974,223436,88917.78%
14.92%8.08%16.9%19.9%48.14%
Green Jill Stein 3,2416483,6162,12145710,0830.4%
0.5%0.1%0.4%0.35%0.29%
Libertarian Gary Johnson 2,5745292,0742,0507707,9970.32%
0.69%0.07%0.3%0.34%0.49%
OthersOthers2,2435832,2981,7535497,4260.29%
0.37%0.16%0.31%0.29%0.35%
TOTAL600,291370,938736,982595,245154,1802,457,636100.00%

Results by county

CountyBarack Obama
Democratic
Mitt Romney
Republican
Various candidates
Other parties
MarginTotal votes cast
# %# %# %# %
Albany 87,55664.49%45,06433.19%3,1472.32%42,49231.30%135,767
Allegany 6,13936.21%10,39061.29%4242.50%-4,251-25.08%16,953
Bronx 339,21191.45%29,9678.08%1,7600.47%309,24483.37%370,938
Broome 41,97051.46%37,64146.15%1,9542.39%4,3295.31%81,565
Cattaraugus 12,64942.49%16,56955.66%5491.85%-3,920-13.17%29,767
Cayuga 17,00754.58%13,45443.18%7002.24%3,55311.40%31,161
Chautauqua 23,81245.05%27,97152.92%1,0692.03%-4,159-7.87%52,852
Chemung 16,79747.98%17,61250.31%6011.71%-815-2.33%35,010
Chenango 9,11647.20%9,71350.29%4852.51%-597-3.09%19,314
Clinton 18,96161.85%11,11536.26%5801.89%7,84625.59%30,656
Columbia 16,22155.69%12,22541.97%6832.34%3,99613.72%29,129
Cortland 10,48253.41%8,69544.31%4472.28%1,7879.10%19,624
Delaware 8,30444.55%9,93853.32%3962.13%-1,634-8.77%18,638
Dutchess 65,31252.80%56,02545.29%2,3681.91%9,2877.51%123,705
Erie 237,35657.31%169,67540.97%7,1641.72%67,68116.34%414,195
Essex 9,78458.53%6,64739.76%2861.71%3,13718.77%16,717
Franklin 9,89462.09%5,74036.02%3001.89%4,15426.07%15,934
Fulton 8,60743.47%10,81454.62%3781.91%-2,207-11.15%19,799
Genesee 9,60138.80%14,60759.03%5382.17%-5,006-20.23%24,746
Greene 9,03043.69%11,17454.06%4642.25%-2,144-10.37%20,668
Hamilton 1,12836.24%1,93262.06%531.70%-804-25.82%3,113
Herkimer 11,27345.02%13,28253.04%4851.94%-2,009-8.02%25,040
Jefferson 17,09947.89%18,12250.75%4871.36%-1,023-2.86%35,708
Kings 604,44382.02%124,55116.90%7,9881.08%479,89265.12%736,982
Lewis 4,72444.90%5,65153.71%1471.39%-927-8.81%10,522
Livingston 11,70543.72%14,44853.97%6172.31%-2,743-10.25%26,770
Madison 13,87149.37%13,62248.49%6012.14%2490.88%28,094
Monroe 193,50157.97%133,36239.95%6,9502.08%60,13918.02%333,813
Montgomery 8,49346.70%9,33451.33%3591.97%-841-4.63%18,186
Nassau 302,69553.28%259,30845.64%6,1481.08%43,3877.64%568,151
New York 502,67483.74%89,55914.92%8,0581.34%413,11568.82%600,291
Niagara 43,98649.42%43,24048.58%1,7872.00%7460.84%89,013
Oneida 40,46846.68%44,53051.36%1,7021.96%-4,062-4.68%86,700
Onondaga 122,25459.72%78,83138.51%3,6321.77%43,42321.21%204,717
Ontario 23,08748.25%23,82049.78%9461.97%-733-1.53%47,853
Orange 73,31552.13%65,36746.48%1,9461.39%7,9485.65%140,628
Orleans 5,78739.35%8,59458.44%3252.21%-2,807-19.09%14,706
Oswego 23,51552.73%19,98044.81%1,0962.46%3,5357.92%44,591
Otsego 12,11750.20%11,46147.48%5612.32%6562.72%24,139
Putnam 19,51244.00%24,08354.31%7501.69%-4,571-10.31%44,345
Queens 470,73279.08%118,58919.92%5,9241.00%352,14359.16%595,245
Rensselaer 37,40854.96%29,11342.77%1,5402.27%8,29512.19%68,061
Richmond 78,18150.71%74,22348.14%1,7761.15%3,9582.57%154,180
Rockland 65,79352.78%57,42846.07%1,4241.15%8,3656.71%124,645
Saratoga 52,95750.19%50,38247.75%2,1712.06%2,5752.44%105,510
Schenectady 36,84456.74%26,56840.92%1,5212.34%10,27615.82%64,933
Schoharie 5,42741.09%7,46756.54%3132.37%-2,040-15.45%13,207
Schuyler 3,67445.10%4,28152.55%1912.35%-607-7.45%8,146
Seneca 7,09453.48%5,88944.39%2832.13%1,2059.09%13,266
St. Lawrence 21,35357.41%15,13840.70%7001.89%6,21516.71%37,191
Steuben 15,78740.97%21,95456.98%7902.05%-6,167-16.01%38,531
Suffolk 304,07951.17%282,13147.48%8,0561.35%21,9483.69%594,266
Sullivan 15,26853.73%12,70544.71%4421.56%2,5639.02%28,415
Tioga 8,93041.36%12,11756.13%5422.51%-3,187-14.77%21,589
Tompkins 27,24468.48%11,10727.92%1,4303.60%16,13740.56%39,781
Ulster 47,75259.97%29,75937.37%2,1152.66%17,99322.60%79,626
Warren 14,80650.06%14,11947.73%6532.21%6872.33%29,578
Washington 11,52349.89%11,08548.00%4872.11%4381.89%23,095
Wayne 16,63544.30%20,06053.43%8522.27%-3,425-9.13%37,547
Westchester 240,78561.99%143,12236.84%4,5401.17%97,66325.15%388,447
Wyoming 5,66134.66%10,34863.35%3261.99%-4,687-28.69%16,335
Yates 4,48847.53%4,79850.82%1561.65%-310-3.29%9,442
Totals4,485,87763.35%2,490,49635.17%105,1631.49%1,995,38128.18%7,081,536

See full list of sources See full list of sources

County Flips:
Democratic
Hold
Gain from Republican
Republican
Hold
Gain from Democratic New York County Flips 2012.svg
County Flips:

Counties that flipped from Democratic to Republican

Counties that flipped from Republican to Democratic

By congressional district

Obama swept 24 of the state's 27 congressional districts, including three held by Republicans. [9]

DistrictObamaRomneyRepresentative
1st 49.62%49.08% Tim Bishop
2nd 51.65%47.23% Peter T. King
3rd 50.76%48.21% Steve Israel
4th 56.31%42.76% Carolyn McCarthy
5th 90.6%9.1% Gregory Meeks
6th 67.8%31.05% Grace Meng
7th 88.35%10.34% Nydia Velázquez
8th 89.26%10.14% Hakeem Jeffries
9th 85.28%13.84% Yvette Clarke
10th 73.64%25% Jerry Nadler
11th 51.6%47.32% Michael Grimm
12th 76.92%21.51% Carolyn Maloney
13th 94.64%4.56% Charles B. Rangel
14th 80.67%18.27% Joe Crowley
15th 96.75%3% Jose Serrano
16th 73.69%25.53% Eliot Engel
17th 57.07%41.84% Nita Lowey
18th 51.43%47.15% Sean Patrick Maloney
19th 52.12%45.85% Chris Gibson
20th 59.2%38.8% Paul Tonko
21st 52.24%46.07% Bill Owens
22nd 48.76%49.24% Richard L. Hanna
23rd 48.38%49.59% Tom Reed
24th 57%41.1% Dan Maffei
25th 58.77%39.41% Louise Slaughter
26th 63.94%34.31% Brian Higgins
27th 42.89%55.29% Chris Collins

Analysis

As expected, New York gave a landslide win to Obama, with 4,485,877 votes, or 63.35% of the popular vote, 28.18% lead ahead of Romney. [10] It was one of only six states to swing in Obama's favor from 2008, when he won with a 26.85% margin. [11] New York has voted solidly for the Democratic candidate in every election since Michael Dukakis in 1988, which marked the end of its status as a swing state. This was the greatest ever percentage of the vote won by a Democrat since Lyndon B. Johnson won 68.56% of the vote in his 1964 44 state-landslide.

The politics of New York State are dominated by the heavily populated area of New York City, which Barack Obama won in a historic landslide, taking 81.19% of the vote and sweeping all 5 boroughs. Obama took 1,995,241 votes in New York City, to Mitt Romney's 436,889. No other presidential candidate of either party has ever received more than 80% of the vote in New York City, and this remains the only time since 2000 that a Democrat won Staten Island, as well as all five boroughs of New York City. This was not only due to its majority liberal and extremely diverse population. His performance in New York City likely contributed to his improvement from 2008, which was unusual compared to the rest of the country where he underperformed from 2008 (particularly in areas like the Midwest and Rust Belt).

He managed to flip Staten Island, which voted for John McCain in 2008, as well as improved his margins in all other boroughs except for Manhattan. This improved performance is likely attributable to Hurricane Sandy, which made landfall on October 29 and had devastating effects on the state, killing 44 people, destroying 250,000 vehicles and 300 homes, damaging 69,000 residential units, [12] and flooding of the New York City Subway, all tunnels within the city (except for the Lincoln Tunnel), many suburban communities. [13] Areas that weren't directly affected by the hurricane were indirectly effected by power outages and major disruption to data communication. [14] Staten Island was hit hardest, with its geographical position combined with weather patterns, causing a 16 feet-high storm tide at its peak, flooding major residential areas. [15] 23 of the 44 deaths from the hurricane were in Staten Island. [16] The federal government's powerful and coordinated response to the hurricane was praised by those on both sides of the isle, garnering Mayor of New York City Michael Bloomberg's endorsement, [3] as well as praise from Republican politicians like then New Jersey Governor Chris Christie. [17] This – combined with the media's heavy criticism of Romney's support for a 40% budget cut to FEMA, which would grow to as much as 60% in the coming years – weakened Romney's performance amongst voters across city, including conservatives, especially in the borough of Staten Island. [18]

The advantage from Hurricane Sandy was also reflected in polls. Prior to the storm, nine nationwide polls listed in Real Clear Politics' database found Romney and Obama each leading in four and one tied. Seven national polls taken after the storm had shown Obama leading in three, four being tied, and Romney leading in none. In particular, a poll by Politico and George Washington University found Obama's lead increasing in the Northeast from 8 to 20% before and after the storm. [19]

Unlike many rural areas across the country, most notably in the Midwest, rural counties didn't swing especially hard against Obama this election. Most of the political landscape looked roughly the same, with the exception of Chautauqua County flipping red this election after supporting Obama by narrow margins in 2008. However, Obama tied with Romney for white voters (who make up a majority of upstate's population but a minority in New York City) according to New York Times exit polls this election, a significant decline from 2008 when he won white voters 52 to 46. [20] Discounting New York City's votes, Obama still would have carried New York State, albeit by a closer margin. Excluding New York City, Obama's vote total in the state was 2,490,636 to Romney's 2,053,607, giving Obama a 54.03%-44.54% win outside of NYC.

In terms of exit polls, Obama performed roughly as expected. He won both women and men 68 to 31 and 58 to 42, respectively, and won Black voters 94 to 5 and Hispanic voters 89 to 11. These ethnic groups collectively make up 54.6% of New York City's population, and thus hold great influence. Obama won all age groups, education levels, and income levels, though he did best amongst 18 to 29-year-olds (72 to 25), those with no college degree (66 to 34), and those with an income under $30,000 (81 to 17), respectively. Obama not only won liberals and registered Democrats, but he also won moderates and independents 63 to 36 and 50 to 44 respectively – these groups make up 42% and 23% of the electorate respectively and were thus vital for Obama to win.

See also

Related Research Articles

<span class="mw-page-title-main">2012 United States presidential election in Iowa</span>

The 2012 United States presidential election in Iowa took place on November 6, 2012, as part of the 2012 United States presidential election in which all 50 states plus the District of Columbia participated. Iowa voters chose six electors to represent them in the Electoral College via a popular vote pitting incumbent Democratic President Barack Obama and his running mate, Vice President Joe Biden, against Republican challenger and former Massachusetts Governor Mitt Romney and his running mate, Congressman Paul Ryan.

<span class="mw-page-title-main">2012 United States presidential election in Nevada</span>

The 2012 United States presidential election in Nevada took place on November 6, 2012, as part of the 2012 United States presidential election in which all 50 states plus the District of Columbia participated. State voters chose six electors to represent them in the Electoral College via a popular vote pitting incumbent Democratic President Barack Obama and his running mate, Vice President Joe Biden, against Republican challenger and former Massachusetts Governor Mitt Romney and his running mate, Congressman Paul Ryan.

<span class="mw-page-title-main">2012 United States presidential election in Michigan</span> Election in Michigan

The 2012 United States presidential election in Michigan took place on November 6, 2012, as part of the 2012 United States presidential election in which all 50 states plus the District of Columbia participated. Voters chose 16 electors to represent them in the Electoral College via a popular vote pitting incumbent Democratic President Barack Obama and his running mate, Vice President Joe Biden, against Republican challenger and former Massachusetts Governor Mitt Romney and his running mate, Congressman Paul Ryan.

<span class="mw-page-title-main">2012 United States presidential election in Washington (state)</span> Election in Washington

The 2012 United States presidential election in Washington took place on November 6, 2012, as part of the 2012 United States presidential election in which all 50 states plus the District of Columbia participated. Washington voters chose 12 electors to represent them in the Electoral College via a popular vote pitting incumbent Democratic President Barack Obama and his running mate, Vice President Joe Biden, against Republican challenger and former Massachusetts Governor Mitt Romney and his running mate, Congressman Paul Ryan.

<span class="mw-page-title-main">2012 United States presidential election in Indiana</span> Election in Indiana

The 2012 United States presidential election in Indiana took place on November 6, 2012, as part of the 2012 United States presidential election, in which all 50 states plus the District of Columbia participated. Indiana voters chose 11 electors to represent them in the Electoral College via a popular vote pitting incumbent Democratic President Barack Obama and his running mate, Vice President Joe Biden, against Republican challenger and former Governor of Massachusetts Mitt Romney and his running mate, Wisconsin Congressman Paul Ryan. Romney and Ryan carried Indiana with 54.13% of the popular vote to the Democratic ticket's 43.93%, thus winning the state's 11 electoral votes.

<span class="mw-page-title-main">2012 United States presidential election in Kentucky</span> Election in Kentucky

The 2012 United States presidential election in Kentucky took place on November 6, 2012, as part of the 2012 General Election in which all 50 states plus the District of Columbia participated. Kentucky voters chose eight electors to represent them in the Electoral College via a popular vote pitting incumbent Democratic President Barack Obama and his running mate, Vice President Joe Biden, against Republican challenger and former Massachusetts Governor Mitt Romney and his running mate, Congressman Paul Ryan.

<span class="mw-page-title-main">2012 United States presidential election in Mississippi</span> Election in Mississippi

The 2012 United States presidential election in Mississippi took place on November 6, 2012, as part of the 2012 general election in which all 50 states plus the District of Columbia participated. Mississippi voters chose six electors to represent them in the Electoral College via a popular vote pitting incumbent Democratic President Barack Obama and his running mate, Vice President Joe Biden, against Republican challenger and former Massachusetts Governor Mitt Romney and his running mate, Congressman Paul Ryan.

<span class="mw-page-title-main">2012 United States presidential election in New Jersey</span> Election in New Jersey

The 2012 United States presidential election in New Jersey took place on November 6, 2012, as part of the 2012 United States presidential election in which all 50 states plus the District of Columbia participated. Voters in the state chose 14 electors to represent them in the Electoral College via a popular vote pitting incumbent Democratic President Barack Obama and his running mate, Vice President Joe Biden, against Republican challenger and former Massachusetts Governor Mitt Romney and his running mate, Congressman Paul Ryan.

<span class="mw-page-title-main">2012 United States presidential election in North Carolina</span>

The 2012 United States presidential election in North Carolina took place on November 6, 2012, as part of the 2012 general election in which all 50 states plus the District of Columbia participated. North Carolina voters chose 15 electors to represent them in the Electoral College via a popular vote pitting incumbent Democratic President Barack Obama and his running mate, Vice President Joe Biden, against Republican challenger and former Massachusetts Governor Mitt Romney and his running mate, Congressman Paul Ryan.

<span class="mw-page-title-main">2012 United States presidential election in Ohio</span> Election in Ohio

The 2012 United States presidential election in Ohio took place on November 6, 2012, as part of the 2012 United States presidential election in which all 50 states plus the District of Columbia participated. Ohio voters chose 18 electors to represent them in the Electoral College via a popular vote pitting incumbent Democratic President Barack Obama and his running mate, Vice President Joe Biden, against Republican challenger and former Massachusetts Governor Mitt Romney and his running mate, Congressman Paul Ryan. This election continued Ohio's bellwether streak, as the state voted for the winner of the presidency in every election from 1964 to 2016.

<span class="mw-page-title-main">2012 United States presidential election in Oregon</span> Election in Oregon

The 2012 United States presidential election in Oregon took place on November 6, 2012, as part of the 2012 United States presidential election in which all 50 states plus the District of Columbia participated. Oregon voters chose seven electors to represent them in the Electoral College via a popular vote pitting incumbent Democratic President Barack Obama and his running mate, Vice President Joe Biden, against Republican challenger and former Massachusetts Governor Mitt Romney and his running mate, Representative Paul Ryan.

<span class="mw-page-title-main">2012 United States presidential election in Pennsylvania</span> Selection of Pennsylvanias presidential electors

The 2012 United States presidential election in Pennsylvania took place on November 6, 2012, as part of the 2012 United States presidential election in which all 50 states plus the District of Columbia participated. The primary election to select the Democratic and Republican candidates had been held on April 24, 2012. Pennsylvania voters chose 20 electors to represent them in the Electoral College via a popular vote pitting incumbent Democratic President Barack Obama and his running mate, Vice President Joe Biden, against Republican challenger and former Massachusetts Governor Mitt Romney and his running mate, Congressman Paul Ryan. Pennsylvania's electoral vote number was a reduction from the 2008 delegation, which had 21 electors. This change was due to reapportionment following the 2010 United States Census. Pennsylvania's 20 electoral votes are allotted on a winner-take-all basis.

<span class="mw-page-title-main">2012 United States presidential election in Rhode Island</span> Election in Rhode Island

The 2012 United States presidential election in Rhode Island took place on November 6, 2012, as part of the 2012 United States presidential election in which all 50 states plus the District of Columbia participated. Rhode Island voters chose four electors to represent them in the Electoral College via a popular vote pitting incumbent Democratic President Barack Obama and his running mate, Vice President Joe Biden, against Republican challenger and former Massachusetts Governor Mitt Romney and his running mate, Congressman Paul Ryan.

<span class="mw-page-title-main">2012 United States presidential election in Tennessee</span> Election in Tennessee

The 2012 United States presidential election in Tennessee was held on November 6, 2012, as part of the 2012 United States presidential election in which all 50 states plus the District of Columbia participated. Tennessee voters chose 11 electors to represent them in the Electoral College via a popular vote pitting incumbent Democratic President Barack Obama and his running mate, Vice President Joe Biden, against Republican challenger and former Massachusetts Governor Mitt Romney and his running mate, Congressman Paul Ryan.

<span class="mw-page-title-main">2012 United States presidential election in Virginia</span> Election in Virginia

The 2012 United States presidential election in Virginia took place on November 6, 2012, as part of the presidential election in which all 50 states plus the District of Columbia participated. Virginia voters chose 13 electors to represent them in the Electoral College via a popular vote pitting incumbent Democratic President Barack Obama and his running mate, Vice President Joe Biden, against Republican challenger and former Massachusetts Governor Mitt Romney and his running mate, Congressman Paul Ryan.

<span class="mw-page-title-main">2012 United States presidential election in Utah</span> Election in Utah

The 2012 United States presidential election in Utah took place on November 6, 2012, as part of the 2012 United States presidential election in which all 50 states plus the District of Columbia participated. Utah voters chose six electors to represent them in the Electoral College via a popular vote pitting incumbent Democratic President Barack Obama and his running mate, Vice President Joe Biden, against Republican challenger and former Massachusetts Governor Mitt Romney and his running mate, Congressman Paul Ryan.

<span class="mw-page-title-main">2012 United States presidential election in Alabama</span> Election in Alabama

The 2012 United States presidential election in Alabama took place on November 6, 2012, as part of the 2012 general election, in which all 50 states plus the District of Columbia participated. Alabama voters chose nine electors to represent them in the Electoral College via a popular vote pitting incumbent Democratic President Barack Obama and his running mate, Vice President Joe Biden, against Republican challenger and former Massachusetts Governor Mitt Romney and his running mate, Congressman Paul Ryan.

<span class="mw-page-title-main">2012 United States presidential election in Alaska</span> Election in Alaska

The 2012 United States presidential election in Alaska took place on November 6, 2012, as part of the 2012 United States presidential election in which all 50 states plus the District of Columbia participated. Alaska voters chose three electors to represent them in the Electoral College via a popular vote pitting incumbent Democratic President Barack Obama and his running mate, Vice President Joe Biden, against Republican challenger and former Massachusetts Governor Mitt Romney and his running mate, Congressman Paul Ryan.

<span class="mw-page-title-main">2012 United States presidential election in North Dakota</span> Election in North Dakota

The 2012 United States presidential election in North Dakota took place on November 6, 2012, as part of the 2012 United States presidential election in which all 50 states plus the District of Columbia participated. North Dakota voters chose three electors to represent them in the Electoral College via a popular vote pitting incumbent Democratic President Barack Obama and his running mate, Vice President Joe Biden, against Republican challenger and former Massachusetts Governor Mitt Romney and his running mate, Congressman Paul Ryan.

<span class="mw-page-title-main">2016 United States presidential election in New York</span>

The 2016 United States presidential election in New York was held on Tuesday, November 8, 2016, as part of the 2016 United States presidential election in which all 50 states plus the District of Columbia participated. New York voters chose electors to represent them in the Electoral College via a popular vote, pitting the Republican Party's nominee, businessman Donald Trump, and running mate Indiana Governor Mike Pence against Democratic Party nominee, former Secretary of State Hillary Clinton, and her running mate Virginia Senator Tim Kaine. New York has 29 electoral votes in the Electoral College.

References

  1. "2012 General Election Returns" (PDF). NYS Board of Elections. February 6, 2013. Retrieved March 4, 2013.
  2. "Opinion | A Big Storm Requires Big Government". The New York Times. October 29, 2012. ISSN   0362-4331 . Retrieved September 3, 2020.
  3. 1 2 Hernandez, Raymond (November 1, 2012). "Bloomberg Backs Obama, Citing Fallout From Storm". The New York Times. ISSN   0362-4331 . Retrieved September 3, 2020.
  4. "New York Democratic Delegation 2012". www.thegreenpapers.com. Retrieved September 3, 2020.
  5. 1 2 "Republican Party. Presidential Primary - April 24, 2012" (PDF). elections.ny.gov.
  6. "Primary and Caucus Printable Calendar". CNN . Retrieved January 11, 2012.
  7. "Presidential Primary Dates" (PDF). Federal Election Commission . Retrieved January 23, 2012.
  8. "NYS Board of Elections President and Vice-President Election Returns Nov. 6, 2012" (PDF). Retrieved May 2, 2013.
  9. "Daily Kos Elections' statewide election results by congressional and legislative districts". Daily Kos. Retrieved August 11, 2020.
  10. "New York". The New York Times. ISSN   0362-4331 . Retrieved September 3, 2020.
  11. "New York - Election Results 2008 - The New York Times". www.nytimes.com. Retrieved September 3, 2020.
  12. "About Hurricane Sandy". www1.nyc.gov. Retrieved September 3, 2020.
  13. "Hurricane Sandy - New York". www.usgs.gov. Retrieved September 3, 2020.
  14. Troianovski, Anton (November 1, 2012). "A Look inside Verizon's Flooded Communications Hub" . The Wall Street Journal . ISSN   0099-9660 . Retrieved September 3, 2020.
  15. Gammon, Crystal (November 7, 2012). "Why Hurricane Sandy Hit Staten Island So Hard". livescience.com. Retrieved September 3, 2020.
  16. Taylor, Alan. "Hurricane Sandy: Staten Island Survivors - The Atlantic". www.theatlantic.com. Retrieved September 3, 2020.
  17. "Chris Christie and Hurricane Sandy give Obama a timely boost". Los Angeles Times. November 1, 2012. Retrieved September 3, 2020.
  18. "Politics of FEMA: Mitt Romney Suggested Less Federal Involvement, Paul Ryan Budget Scrutinized". ABC News. Retrieved September 3, 2020.
  19. Cassidy, John (November 4, 2012). "How Much Did Hurricane Sandy Help Obama?". The New Yorker. Retrieved September 3, 2020.
  20. "President Exit Polls". The New York Times. ISSN   0362-4331 . Retrieved September 4, 2020.