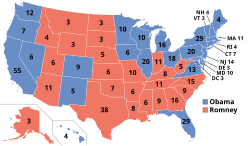
Romney easily carried Tennessee's 11 electoral votes, with 59.42% of the statewide vote to Obama's 39.04% and a 20.38% margin of victory.[2] Tennessee has not voted for a Democratic presidential nominee since 1996, when Bill Clinton of neighboring Arkansas won it along with many other Southern states, nor has the state done so with a majority of the vote share since Jimmy Carter of neighboring Georgia carried it in 1976. Thus, Tennessee has been seen as part of the modern-day red wall in the 21st century. After 1996, the state has been growing more Republican with almost each election.[3]
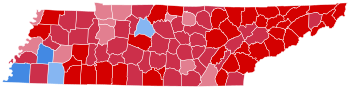
Winning Tennessee by 501,621 votes, Mitt Romney achieved his second-largest margin of victory by vote count nationwide, surpassed only by his 1,261,719-vote margin in Texas, also located in the South. Romney gained ground in every county, significantly outperforming prior GOP presidential candidates in rural areas, particularly in Middle Tennessee. Notably, Romney also flipped two counties, Houston and Jackson, to the Republican column. Both of these majority-white counties had been Democratic strongholds with their strong ties to secessionism: they had each only voted for a Republican presidential nominee once prior to this election, in 1928 and 1920, respectively.[4] Thus, Obama became the first Democrat to be elected without either county. As of the 2024 presidential election, this is the last time in which Hardeman County was won by the Democratic presidential nominee. This is also the first and only time that a Democratic president has won re-election without ever carrying Tennessee.
As consistent with the rest of the country, Obama carried heavily populated and diverse counties. The largest county, Shelby, was won by Obama by a 26.05% margin due to it being home to Memphis, Tennessee's largest city. In addition, the home of the state capital of Nashville, Davidson County, went to Obama by 18.53%. Hardeman and Haywood counties, both low-populated suburbs of Memphis, also went to Obama due to their high African American populations (42.2%[5] and 50.6%,[6] respectively). However, rural areas – including areas in the northwestern portion of the state that had long favored Democratic candidates – saw heavy margins for Romney, allowing him to offset Obama's wins in large cities. The eastern region of the state in Appalachia, some of the most historically Republican and Unionist counties in the country, saw margins of over 70% for the Republican ticket.[7] This was the first election since 1908 in which Tennessee backed the national loser a second consecutive time.
Primary results by county Obama:60–65%65–70%70–75%75–80%80–85%85–90%90–95%95–100%
The 2012 democratic primary in Tennessee took place on Super Tuesday, March 6, 2012, with Barack Obama receiving 80,355 (88.5%) votes. Other candidates received a combined total of 10,411 (11.5%) votes.[8] Tennessee had a total of 91 delegates to the 2012 Democratic National Convention, of which 82 were pledged to presidential contenders depending on the popular vote. The remaining 9 super-delegates were unbound.
Tennessee has 58 delegates to the 2012 Republican National Convention. Three superdelegates are unbound. 27 delegates are awarded by congressional district, 3 delegates for each district. If a candidate wins two-thirds of the vote in a district, he takes all 3 delegates there; if not, delegates are split 2-to-1 between the top two candidates. Another 28 delegates are awarded to the candidate who wins two-thirds of the vote statewide, or allocated proportionately among candidates winning at least 20% of the vote if no one gets two-thirds.[12]
This page is based on this Wikipedia article Text is available under the CC BY-SA 4.0 license; additional terms may apply. Images, videos and audio are available under their respective licenses.