| |||||||||||||||||||||||||||||||
16 of the 33 seats in the Tennessee State Senate 17 seats needed for a majority | |||||||||||||||||||||||||||||||
---|---|---|---|---|---|---|---|---|---|---|---|---|---|---|---|---|---|---|---|---|---|---|---|---|---|---|---|---|---|---|---|
| |||||||||||||||||||||||||||||||
Results: Republican gain Republican hold Democratic hold No Election Vote Share: 50–60% 60–70% 70–80% >90% >90% | |||||||||||||||||||||||||||||||
|
The 2012 Tennessee State Senate election was held on November 6, 2012, to elect 16 of the 33 seats for the Tennessee's State Senate. The elections coincided with the Presidential, U.S. Senate, U.S. House, and State House elections. The primary elections were held on August 2, 2012. [1]
Republicans gained 6 seats, getting a supermajority in the Senate chamber. [2] [3]
Five incumbents (4 Democrats and 1 Republican) did not run for re-election in 2012. Those incumbents are:
Party | Candidates | Votes | Seats | ||||||
---|---|---|---|---|---|---|---|---|---|
No. | % | Before | Up | Won | After | +/– | |||
Republican | 15 | 704,393 | 69.94% | 20 | 9 | 15 | 26 | 6 | |
Democratic | 10 | 302,714 | 30.06% | 13 | 7 | 1 | 7 | 6 | |
Total | 1,007,107 | 100.00% | 33 | 16 | 16 | 33 | |||
Source: |
Three races were decided by a margin of under 10%:
District | Winner | Margin |
---|---|---|
District 22 | Republican (gain) | 6.16% |
District 20 | Republican (gain) | 8.16% |
District 10 | Republican (gain) | 8.64% |
District 2 • District 4 • District 6 • District 8 • District 10 • District 12 • District 14 • District 16 • District 18 • District 20 • District 22 • District 24 • District 26 • District 28 • District 30 • District 32 |
Primary election | ||||
---|---|---|---|---|
Party | Candidate | Votes | % | |
Republican | Doug Overbey (incumbent) | 11,334 | 61.0 | |
Republican | Scott Hughes | 7,260 | 39.0 | |
Total votes | 18,594 | 100 | ||
General election | ||||
Republican | Doug Overbey (incumbent) | 60,517 | 100 | |
Total votes | 60,517 | 100 | ||
Republican hold |
Party | Candidate | Votes | % | |
---|---|---|---|---|
Republican | Ron Ramsey (incumbent) | 12,183 | 100.00% | |
Total votes | 12,183 | 100.00% |
Party | Candidate | Votes | % | |
---|---|---|---|---|
Republican | Ron Ramsey (incumbent) | 55,913 | 100.00% | |
Total votes | 55,913 | 100.00% | ||
Republican hold |
Party | Candidate | Votes | % | |
---|---|---|---|---|
Republican | Becky Duncan Massey (incumbent) | 7,260 | 100.00% | |
Total votes | 7,260 | 100.00% |
Party | Candidate | Votes | % | |
---|---|---|---|---|
Democratic | Evelyn Gill | 1,479 | 100.00% | |
Total votes | 1,479 | 100.00% |
Party | Candidate | Votes | % | |
---|---|---|---|---|
Republican | Becky Duncan Massey (incumbent) | 49,744 | 68.7 | |
Democratic | Evelyn Gill | 22,691 | 31.3 | |
Total votes | 72,435 | 100 | ||
Republican hold |
Primary election | ||||
---|---|---|---|---|
Party | Candidate | Votes | % | |
Republican | Frank Niceley | 7,021 | 44.6 | |
Republican | Cynthia Bundren Jackson | 5,432 | 34.5 | |
Republican | Jeffrey Brantley | 1,817 | 11.5 | |
Republican | Hobart Rice | 1,483 | 9.4 | |
Total votes | 15,753 | 100 | ||
General election | ||||
Republican | Frank Niceley | 43,687 | 100 | |
Total votes | 43,687 | 100 | ||
Republican hold |
Primary election | ||||
---|---|---|---|---|
Party | Candidate | Votes | % | |
Democratic | Andrae McGary | 4,302 | 61.6 | |
Democratic | David Testerman | 1,705 | 24.4 | |
Democratic | Quenston Coleman | 979 | 14.0 | |
Total votes | 6,986 | 100 | ||
Republican | Todd Gardenhire | 8,022 | 50.1 | |
Republican | Greg Vital | 7,982 | 49.9 | |
Total votes | 16,004 | 100 | ||
General election | ||||
Republican | Todd Gardenhire | 36,557 | 54.32% | |
Democratic | Andrae McGary | 30,745 | 45.68% | |
Total votes | 67,302 | 100.00% | ||
Republican gain from Democratic |
Party | Candidate | Votes | % | |
---|---|---|---|---|
Republican | Ken Yager (incumbent) | 18,037 | 100.00% | |
Total votes | 18,037 | 100.00% |
Party | Candidate | Votes | % | |
---|---|---|---|---|
Republican | Ken Yager (incumbent) | 51,076 | 100.00% | |
Total votes | 51,076 | 100.00% | ||
Republican hold |
Primary election | ||||
---|---|---|---|---|
Party | Candidate | Votes | % | |
Republican | Jim Tracy (incumbent) | 11,174 | 86.7 | |
Republican | Matt Randolph | 1,707 | 13.3 | |
Total votes | 12,881 | 100 | ||
General election | ||||
Republican | Jim Tracy (incumbent) | 50,235 | 100 | |
Total votes | 50,235 | 100 | ||
Republican hold |
Primary election | ||||
---|---|---|---|---|
Party | Candidate | Votes | % | |
Democratic | Jim Lewis | 2,937 | 27.60 | |
Democratic | Steve Roller | 2,902 | 27.27 | |
Democratic | Justin Walling | 2,878 | 27.04 | |
Democratic | Kevin Lawrence | 1,256 | 11.80 | |
Democratic | Jeff Bottoms | 670 | 6.30 | |
Total votes | 10,643 | 100.00 | ||
Republican | Janice Bowling | 8,162 | 60.1 | |
Republican | Ron Stolzfus | 2,280 | 16.8 | |
Republican | Eric Chance | 2,277 | 16.8 | |
Republican | Rod McClellan | 866 | 6.4 | |
Total votes | 13,585 | 100 | ||
General election | ||||
Republican | Janice Bowling | 40,139 | 62.9 | |
Democratic | Jim Lewis | 23,636 | 37.1 | |
Total votes | 63,775 | 100 | ||
Republican gain from Democratic |
Primary election | ||||
---|---|---|---|---|
Party | Candidate | Votes | % | |
Republican | Ferrell Haile | 8,627 | 48.2 | |
Republican | Jeff Coker | 7,527 | 42.1 | |
Republican | J. H. Tony Allers | 1,370 | 7.7 | |
Republican | Brock Ewell | 367 | 2.1 | |
Total votes | 17,891 | 100 | ||
General election | ||||
Republican | Ferrell Haile | 49,472 | 69.2 | |
Democratic | Maria Brewer | 21,970 | 30.8 | |
Total votes | 71,442 | 100 | ||
Republican hold |
Primary election | ||||
---|---|---|---|---|
Party | Candidate | Votes | % | |
Democratic | Phillip North | 5,148 | 74.3 | |
Democratic | James Baxter | 1,784 | 25.7 | |
Total votes | 6,932 | 100 | ||
Republican | Steven Dickerson | 5,378 | 48.5 | |
Republican | David Hall | 3,325 | 30.0 | |
Republican | Rob Mortenson | 2,379 | 21.5 | |
Total votes | 11,082 | 100 | ||
General election | ||||
Republican | Steven Dickerson | 46,254 | 54.08% | |
Democratic | Phillip North | 39,280 | 45.92% | |
Total votes | 85,534 | 100.00% | ||
Republican gain from Democratic |
Party | Candidate | Votes | % | |
---|---|---|---|---|
Democratic | Tim Barnes (incumbent) | 3,869 | 100.00% | |
Total votes | 3,869 | 100.00% |
Party | Candidate | Votes | % | |
---|---|---|---|---|
Republican | Mark Green | 4,849 | 100.00% | |
Total votes | 4,849 | 100.00% |
Results by county
County | Green | % | Barnes | % | Total |
---|---|---|---|---|---|
Houston | 1,317 | 45.23% | 1,595 | 54.77% | 2,912 |
Montgomery | 28,197 | 53.66% | 24,348 | 46.34% | 52,545 |
Stewart | 2,449 | 51.42% | 2,314 | 48.58% | 4,763 |
Party | Candidate | Votes | % | |
---|---|---|---|---|
Republican | Mark Green | 31,963 | 53.08% | |
Democratic | Tim Barnes (incumbent) | 28,257 | 46.92% | |
Total votes | 60,220 | 100.00% | ||
Republican gain from Democratic |
Primary election | ||||
---|---|---|---|---|
Party | Candidate | Votes | % | |
Republican | John Stevens | 5,419 | 60.9 | |
Republican | Danny Jowers | 3,476 | 39.1 | |
Total votes | 8,895 | 100 | ||
General election | ||||
Republican | John Stevens | 38,667 | 56.5 | |
Democratic | Brad Thompson | 29,807 | 43.5 | |
Total votes | 68,474 | 100 | ||
Republican gain from Democratic |
Party | Candidate | Votes | % | |
---|---|---|---|---|
Republican | Dolores Gresham (incumbent) | 12,179 | 100.00% | |
Total votes | 12,179 | 100.00% |
Party | Candidate | Votes | % | |
---|---|---|---|---|
Democratic | Meryl Rice | 5,073 | 100.00% | |
Total votes | 5,073 | 100.00% |
Party | Candidate | Votes | % | |
---|---|---|---|---|
Republican | Dolores Gresham (incumbent) | 42,990 | 60.4 | |
Democratic | Meryl Rice | 28,131 | 39.6 | |
Total votes | 71,121 | 100 | ||
Republican hold |
Primary election | |||||
---|---|---|---|---|---|
Party | Candidate | Votes | % | ||
Republican | Joey Hensley | 12,589 | 76.6 | ||
Republican | Dean Dickey | 3,847 | 23.4 | ||
Total votes | 16,436 | 100 | |||
General election | |||||
Republican | Joey Hensley | 37,361 | 55.2 | ||
Democratic | Tyler Cobb | 30,375 | 44.8 | ||
Total votes | 67,736 | 100 | |||
Republican gain from new constituency |
Primary election | ||||
---|---|---|---|---|
Party | Candidate | Votes | % | |
Democratic | Jim Kyle (incumbent) | 7,368 | 55.4 | |
Democratic | Beverly Marrero (incumbent) | 5,931 | 44.6 | |
Total votes | 13,299 | 100 | ||
General election | ||||
Democratic | Jim Kyle (incumbent) | 47,822 | 100 | |
Total votes | 47,822 | 100 | ||
Democratic hold |
Primary election | ||||
---|---|---|---|---|
Party | Candidate | Votes | % | |
Republican | Mark Norris (incumbent) | 26,592 | 88.9 | |
Republican | Woody Degan | 3,319 | 11.1 | |
Total votes | 29,911 | 100 | ||
General election | ||||
Republican | Mark Norris (incumbent) | 69,818 | 100 | |
Total votes | 69,818 | 100 | ||
Republican hold |
The North Carolina Democratic Party (NCDP) is the North Carolina affiliate of the Democratic Party. It is headquartered in the historic Goodwin House, located in Raleigh.
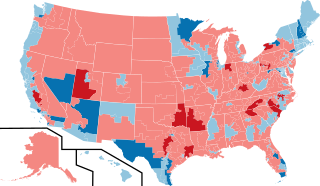
The 2012 United States House of Representatives elections were held on November 6, 2012. It coincided with the reelection of President Barack Obama. Elections were held for all 435 seats representing the 50 U.S. states and also for the delegates from the District of Columbia and five major U.S. territories. The winners of this election cycle served in the 113th United States Congress. This was the first congressional election using districts drawn up based on the 2010 United States census.
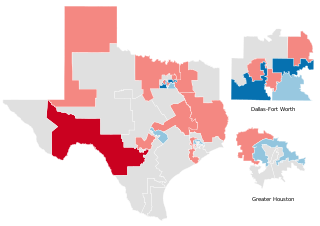
The 2018 Texas Senate elections took place as part of the biennial United States elections. Texas voters elected state senators in 15 of the state senate's 31 districts. The winners of this election served in the 86th Texas Legislature. State senators serve four-year terms in the Texas State Senate. A statewide map of Texas's state Senate districts can be obtained from the Texas Legislative Council here, and individual district maps can be obtained from the U.S. Census here.
The 2020 Texas Senate elections took place as part of the biennial United States elections. Texas voters elected state senators in 16 of the 31 state senate districts. The winners of this election served in the 87th Texas Legislature. State senators serve four-year terms in the Texas State Senate. Those elected in 2020 will only be elected for two years, however, as part of the 2-4-4 term system. A statewide map of Texas's state Senate districts can be obtained from the Texas Legislative Council. and individual district maps can be obtained from the U.S. Census.
The 2018 United States state legislative elections were held on November 6, 2018, for 87 state legislative chambers in 46 states. Across the fifty states, approximately 56 percent of all upper house seats and 92 percent of all lower house seats were up for election. Additionally, six territorial chambers in four territories and the District of Columbia were up as well.
Tennessee state elections in 2020 were held on Tuesday, November 3, 2020. Primary elections for the United States Senate, United States House of Representatives, Tennessee Senate, and Tennessee House of Representatives, as well as various judicial retention elections, were held on August 6, 2020.
The 2022 Wyoming Senate election took place on Tuesday, November 8, 2022, with the primary election held on Tuesday, August 16, 2022. Wyoming voters selected state senators in the 16 odd-numbered districts of the Senate to serve four-year terms.
The 2020 Oklahoma House of Representatives election took place as part of the biennial 2020 United States state legislative elections. Oklahoma voters elected state representatives in all 101 House districts. State Representatives serve two-year terms in the Oklahoma House of Representatives.
The 2020 Tennessee House of Representatives election was held on November 3, 2020, to elect 99 seats for the Tennessee House of Representatives. The elections coincided with the Presidential, U.S. Senate, U.S. House, and State Senate elections.
The 2022 Idaho House of Representatives elections took place on November 8, 2022. Primary elections were held on May 17, 2022. Idaho voters elected state representatives in all 70 seats of the House, electing two state representatives in each of the 35 Idaho state legislative districts. State representatives serve two-year terms in the Idaho House of Representatives.
The 2022 Idaho State Senate elections took place on November 8, 2022. Primary elections were held on May 17, 2022. Idaho voters elected state senators in all 35 seats of the Senate, electing one state senator and two state representatives in each of the 35 Idaho state legislative districts. State senators serve two-year terms in the Idaho Senate.
The 2022 Colorado Senate elections took place on November 8, 2022, along with elections in the State House of Representatives, with the primary elections held on June 28, 2022. Voters in 17 out of the 35 districts of the Colorado Senate elected their representative for a four-year term. It coincided with other Colorado elections of the same year and the biennial United States elections.
The 2022 Rhode Island House of Representatives elections took place on November 8, 2022. Primary elections were held on September 13, 2022. Rhode Island voters elected state representatives in all 75 seats of the House of Representatives to serve two-year terms.
The 2022 Missouri House of Representatives election took place on Tuesday, November 8, 2022, with the primary election held on Tuesday, August 2, 2022. Missouri voters selected state representatives in all 163 seats of the House of Representatives to serve two-year terms.
The 2022 Missouri Senate election took place on Tuesday, November 8, 2022, with the primary election held on Tuesday, August 2, 2022. Missouri voters selected state senators in the 17 even-numbered districts of the Senate to serve four-year terms.
Tennessee state elections in 2022 were held on Tuesday, November 8, 2022. Primary elections for the United States House of Representatives, governorship, Tennessee Senate, and Tennessee House of Representatives, as well as various judicial retention elections, including elections for all five Tennessee Supreme Court justices as well as general local elections, were held on August 4, 2022. There were also four constitutional amendments to the Constitution of Tennessee on the November 8 ballot.
The 2016 Tennessee State Senate election was held on November 8, 2016, to elect 16 of the 33 seats for the Tennessee's State Senate. The elections coincided with the Presidential, U.S. House, and State House elections. The primary elections were held on August 4, 2016.
The 2014 Tennessee State Senate election was held on November 4, 2014, to elect 18 of the 33 seats for the Tennessee's State Senate. The elections coincided with the Governor, U.S. Senate, U.S. House, and State House elections. The primary elections were held on August 7, 2014.
The 2012 Tennessee House of Representatives election was held on November 6, 2012, to elect 99 seats for the Tennessee House of Representatives. The elections coincided with the Presidential, U.S. Senate, U.S. House, and State Senate elections.
The 2024 Rhode Island House of Representatives elections will take place on Tuesday, November 5, 2024, with the primary election to be held on Tuesday, September 10, 2024. Rhode Island voters will select state representatives in all 75 seats of the House to serve two-year terms.