2012 United States presidential election in Nebraska

Last updated

2012 United States presidential election in Nebraska
Flag of Nebraska.svg
  2008 November 6, 2012 2016  
  Mitt Romney by Gage Skidmore 6 cropped.jpg President Barack Obama, 2012 portrait crop.jpg
Nominee Mitt Romney Barack Obama
Party Republican Democratic
Home state Massachusetts Illinois
Running mate Paul Ryan Joe Biden
Electoral vote50
Popular vote475,064302,081
Percentage59.80%38.03%

Nebraska Presidential Election Results 2012.svg
2020 U.S. House elections in Nebraska.svg

President before election

Barack Obama
Democratic

Elected President

Barack Obama
Democratic

The 2012 United States presidential election in Nebraska took place on November 6, 2012, as part of the 2012 United States presidential election in which all 50 states plus the District of Columbia participated. Voters chose five electors to represent them in the Electoral College via a popular vote pitting incumbent Democratic President Barack Obama and his running mate, Vice President Joe Biden, against Republican challenger and former Massachusetts Governor Mitt Romney and his running mate, Congressman Paul Ryan.

Contents

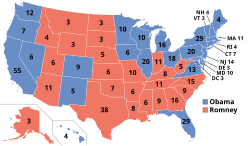
Mitt Romney carried Nebraska, taking 59.80% of the vote to Barack Obama's 38.03%, a margin of 21.77%. Nebraska is one of two states (along with Maine) which splits its electoral votes based on the winner in each congressional district. In 2012, Romney won all 3 congressional districts, thus winning all 5 of the state's electoral votes. This was a change from 2008, when the state as a whole had voted for Republican John McCain but Democrat Barack Obama still won an electoral vote from the state. Nebraska's 2nd congressional district, home to Omaha, had split with the rest of the state and awarded one of Nebraska's electoral votes to a Democratic presidential nominee for the first time since 1964. Nebraska's 2nd congressional district, Indiana, and North Carolina were the only sources of electoral votes won by Obama in 2008 that Romney managed to flip. Obama only won a single county, Thurston, largely due to its majority and increasingly politically active Native American population. He also narrowly lost three of four counties he won in 2008: Douglas, Lancaster, and Saline, home to the cities of Omaha, Lincoln, and Crete, respectively. He became the first Democrat since Grover Cleveland in 1892 to win without carrying Saline County.

As of the 2024 presidential election, this is the last time that the Democrat won Thurston County and the Republican won Douglas or Lancaster County. This was the last time until 2024 that Nebraska's 2nd congressional district did not back the overall winner of the Electoral College, and when the Democratic candidate won the presidency without carrying the district.

Primary elections

Democratic primary

The Democratic primary was not held as Barack Obama ran unopposed and had secured enough delegates for nomination. [1]

Republican primary

2012 Nebraska Republican presidential primary
Flag of Nebraska.svg
  2008 May 15, 2012 (2012-05-15) 2016  
  Mitt Romney by Gage Skidmore 6 cropped.jpg Rick Santorum by Gage Skidmore.jpg
Candidate Mitt Romney Rick Santorum
Home state Massachusetts Pennsylvania
Delegate count300
Popular vote131,43625,830
Percentage70.89%13.93%

  Ron Paul by Gage Skidmore 3 (crop 2).jpg Newt Gingrich by Gage Skidmore 3 (cropped).jpg
Candidate Ron Paul Newt Gingrich
Home state Texas Georgia
Delegate count20
Popular vote18,5089,628
Percentage9.98%5.19%

Nebraska Republican primary by county, 2012.svg
Nebraska results by county
  Mitt Romney
(Note: Italicization indicates a withdrawn candidacy)

The Republican primary was on May 15, 2012. [2] This primary was purely of an advisory nature. From June 1 to June 10 caucuses county conventions caucused to elect delegates to the state convention. These delegates were not bound to vote for any candidate, but at the state convention on July 14, elected 32 bound National delegates. 3 party leaders attended the National Convention unbound, making a total of 35 voting delegates going to the national convention from Nebraska.

2012 Nebraska Republican primary
CandidateVotesPercentageDelegates
Mitt Romney 131,43670.89%30
Rick Santorum 25,83013.93%0
Ron Paul 18,5089.98%2
Newt Gingrich 9,6285.19%0
Unpledged delegates:3
Total:185,402100.0%35
Key:Withdrew prior to contest

Convention

The State Convention was held in Grand Island on July 14, 2012.

Convention Results [3] [4]
Candidate1st2nd3rdStateParty
leaders
Total
America Symbol.svg Mitt Romney 31323232
Ron Paul 020002
Unknown000011
Total923335

General election

Predictions

SourceRankingAs of
Huffington Post [5] Safe RNovember 6, 2012
CNN [6] Safe RNovember 6, 2012
New York Times [7] Safe RNovember 6, 2012
Washington Post [8] Safe RNovember 6, 2012
RealClearPolitics [9] Solid RNovember 6, 2012
Sabato's Crystal Ball [10] Solid RNovember 5, 2012
FiveThirtyEight [11] Solid RNovember 6, 2012
SourceRanking (1st)Ranking (2nd)Ranking (3rd)As of
New York Times [12] Safe RLean R (flip)Safe RNovember 6, 2012
Sabato's Crystal Ball [13] Safe RLean R (flip)Safe RNovember 5, 2012

Results

2012 United States presidential election in Nebraska
PartyCandidateRunning mateVotesPercentageElectoral votes
Republican Mitt Romney Paul Ryan 475,06459.80%5
Democratic Barack Obama (incumbent) Joe Biden (incumbent)302,08138.03%0
Libertarian Gary Johnson Jim Gray 11,1091.40%0
Write-Ins3,7170.47%0
Independent Randall Terry Missy Smith2,4080.30%0
Totals794,379100.00%5

By county

CountyMitt Romney
Republican
Barack Obama
Democratic
Various candidates
Other parties
MarginTotal
#%#%#%#%
Adams 8,31665.64%4,06232.06%2922.30%4,25433.58%12,670
Antelope 2,59680.32%57117.67%652.01%2,02562.65%3,232
Arthur 22786.64%3011.45%51.91%19775.19%262
Banner 34684.18%5513.38%102.44%29170.80%411
Blaine 26888.45%299.57%61.98%23978.88%303
Boone 2,13876.19%61521.92%531.89%1,52354.27%2,806
Box Butte 2,86960.98%1,69235.96%1443.06%1,17725.02%4,705
Boyd 87381.51%18817.55%100.94%68563.96%1,071
Brown 1,30283.73%22414.41%291.86%1,07869.32%1,555
Buffalo 13,57069.76%5,36527.58%5182.66%8,20542.18%19,453
Burt 2,02960.12%1,29138.25%551.63%73821.87%3,375
Butler 2,73870.95%1,04527.08%761.97%1,69343.87%3,859
Cass 7,55662.04%4,36735.85%2572.11%3,18926.19%12,180
Cedar 3,27875.63%95822.10%982.27%2,32053.53%4,334
Chase 1,58484.84%25413.60%291.56%1,33071.24%1,867
Cherry 2,55783.45%43614.23%712.32%2,12169.22%3,064
Cheyenne 3,44974.19%1,08423.32%1162.49%2,36550.87%4,649
Clay 2,23275.74%66722.63%481.63%1,56553.11%2,947
Colfax 2,05166.83%96931.57%491.60%1,08235.26%3,069
Cuming 2,87672.33%1,03125.93%691.74%1,84546.40%3,976
Custer 4,29678.14%1,08319.70%1192.16%3,21358.44%5,498
Dakota 3,09450.42%2,92247.62%1201.96%1722.80%6,136
Dawes 2,47866.47%1,13230.36%1183.17%1,34636.11%3,728
Dawson 5,46069.47%2,19927.98%2002.55%3,26141.49%7,859
Deuel 76375.02%21521.14%393.84%54853.88%1,017
Dixon 1,74564.97%87032.39%712.64%87532.58%2,686
Dodge 8,99560.17%5,67337.95%2821.88%3,32222.22%14,950
Douglas 113,22050.56%106,45647.54%4,2511.90%6,7643.02%223,927
Dundy 79280.41%17617.87%171.72%61662.54%985
Fillmore 2,00769.71%80728.03%652.26%1,20041.68%2,879
Franklin 1,11272.40%38425.00%402.60%72847.40%1,536
Frontier 1,00777.16%27120.77%272.07%73656.39%1,305
Furnas 1,78279.55%42318.88%351.57%1,35960.67%2,240
Gage 5,51357.06%3,90340.40%2452.54%1,61016.66%9,661
Garden 82975.99%24222.18%201.83%58753.81%1,091
Garfield 76981.81%14915.85%222.34%62065.96%940
Gosper 73475.05%23023.52%141.43%50451.53%978
Grant 32288.71%308.26%113.03%29280.45%363
Greeley 82069.20%34028.69%252.11%48040.51%1,185
Hall 12,64662.51%7,16135.40%4222.09%5,48527.11%20,229
Hamilton 3,60073.91%1,14623.53%1252.56%2,45450.38%4,871
Harlan 1,39578.46%35419.91%291.63%1,04158.55%1,778
Hayes 47688.31%519.46%122.23%42578.85%539
Hitchcock 1,17878.80%27418.33%432.87%90460.47%1,495
Holt 3,92279.41%88217.86%1352.73%3,04061.55%4,939
Hooker 33083.54%5914.94%61.52%27168.60%395
Howard 1,89065.85%91431.85%662.30%97634.00%2,870
Jefferson 2,16662.86%1,19534.68%852.46%97128.18%3,446
Johnson 1,22559.38%79038.29%482.33%43521.09%2,063
Kearney 2,34973.87%77324.31%581.82%1,57649.56%3,180
Keith 3,04475.01%92822.87%862.12%2,11652.14%4,058
Keya Paha 39381.20%8016.53%112.27%31364.67%484
Kimball 1,23573.21%39523.41%573.38%84049.80%1,687
Knox 2,88571.48%1,05926.24%922.28%1,82645.24%4,036
Lancaster 62,43449.02%62,01548.69%2,9062.29%4190.33%127,355
Lincoln 10,72868.53%4,45028.43%4773.06%6,27840.10%15,655
Logan 35682.60%6815.78%71.62%28866.82%431
Loup 29081.01%6217.32%61.67%22863.69%358
Madison 10,06272.47%3,48525.10%3382.43%6,57747.37%13,885
McPherson 23781.44%4114.09%134.47%19667.35%291
Merrick 2,49071.37%92526.51%742.12%1,56544.86%3,489
Morrill 1,68176.76%45520.78%542.46%1,22655.98%2,190
Nance 1,10668.23%48129.67%342.10%62538.56%1,621
Nemaha 2,01262.60%1,12835.10%742.30%88427.50%3,214
Nuckolls 1,57471.84%56825.92%492.24%1,00645.92%2,191
Otoe 4,25860.99%2,56136.68%1632.33%1,69724.31%6,982
Pawnee 89967.04%40029.83%423.13%49937.21%1,341
Perkins 1,13581.42%23817.07%211.51%89764.35%1,394
Phelps 3,40077.63%88020.09%1002.28%2,52057.54%4,380
Pierce 2,70778.90%63718.57%872.53%2,07060.33%3,431
Platte 10,06174.68%3,14823.37%2641.95%6,91351.31%13,473
Polk 1,89076.92%52821.49%391.59%1,36255.43%2,457
Red Willow 3,89178.83%95219.29%931.88%2,93959.54%4,936
Richardson 2,44365.34%1,19131.85%1052.81%1,25233.49%3,739
Rock 67285.17%10313.05%141.78%56972.12%789
Saline 2,55751.57%2,28946.17%1122.26%2685.40%4,958
Sarpy 43,21360.45%26,67137.31%1,6062.24%16,54223.14%71,490
Saunders 6,77065.65%3,30732.07%2352.28%3,46333.58%10,312
Scotts Bluff 9,64867.53%4,32730.29%3122.18%5,32137.24%14,287
Seward 5,00366.06%2,38631.51%1842.43%2,61734.55%7,573
Sheridan 2,02181.76%39015.78%612.46%1,63165.98%2,472
Sherman 92760.59%55236.08%513.33%37524.51%1,530
Sioux 62484.44%10113.67%141.89%52370.77%739
Stanton 1,94973.71%61423.22%813.07%1,33550.49%2,644
Thayer 1,87470.48%72827.38%572.14%1,14643.10%2,659
Thomas 36088.24%4210.29%61.47%31877.95%408
Thurston 93942.39%1,24756.30%291.31%-308-13.91%2,215
Valley 1,65775.49%49822.69%401.82%1,15952.80%2,195
Washington 6,89967.33%3,13230.57%2152.10%3,76736.76%10,246
Wayne 2,49367.71%1,07429.17%1153.12%1,41938.54%3,682
Webster 1,25872.22%44225.37%422.41%81646.85%1,742
Wheeler 34577.01%9320.76%102.23%25256.25%448
York 4,87476.70%1,37321.61%1081.69%3,50155.09%6,355
Totals475,06459.80%302,08138.03%17,2342.17%172,98321.77%794,379
County Flips:
Democratic
Hold
Republican
Hold
Gain from Democratic Nebraska County Flips 2012.svg
County Flips:
Counties that flipped from Democratic to Republican

By congressional district

Romney won all three of Nebraska's congressional districts. [14]

DistrictRomneyObamaRepresentative
1st 57%41% Jeff Fortenberry
2nd 53%46% Lee Terry
3rd 70%28% Adrian Smith

See also

References

  1. "Nebraska Results". CNN . Retrieved November 7, 2012.
  2. "Archived copy" (PDF). Archived from the original (PDF) on November 8, 2018. Retrieved August 14, 2012.{{cite web}}: CS1 maint: archived copy as title (link)
  3. "Archived copy". Archived from the original on June 10, 2012. Retrieved July 19, 2012.{{cite web}}: CS1 maint: archived copy as title (link)
  4. "Nebraska Republican Delegation 2012".
  5. "Huffington Post Election Dashboard". HuffPost . Archived from the original on August 13, 2013.
  6. "America's Choice 2012 Election Center: CNN Electoral Map". CNN . Archived from the original on January 19, 2013.
  7. "Election 2012 - The Electoral Map: Building a Path to Victory". The New York Times . Archived from the original on July 8, 2012.
  8. "2012 Presidential Election Results" . The Washington Post. Archived from the original on July 26, 2012.
  9. "RealClearPolitics - 2012 Election Maps - Battle for White House". Archived from the original on June 8, 2011.
  10. "PROJECTION: OBAMA WILL LIKELY WIN SECOND TERM".
  11. "Nate Silver's political calculations predict 2012 election outcome".
  12. "Election 2012 - The Electoral Map: Building a Path to Victory". The New York Times . Archived from the original on July 8, 2012.
  13. "PROJECTION: OBAMA WILL LIKELY WIN SECOND TERM".
  14. "Official Results of Nebraska General Election - November 6, 2012" (PDF). Retrieved February 1, 2025.