2012 United States presidential election in Wyoming

Last updated

2012 United States presidential election in Wyoming
Flag of Wyoming.svg
  2008 November 6, 2012 2016  
  Mitt Romney by Gage Skidmore 6 cropped.jpg President Barack Obama, 2012 portrait crop.jpg
Nominee Mitt Romney Barack Obama
Party Republican Democratic
Home state Massachusetts Illinois
Running mate Paul Ryan Joe Biden
Electoral vote30
Popular vote170,96269,286
Percentage68.64%27.82%

Wyoming Presidential Election Results 2012.svg
County results

President before election

Barack Obama
Democratic

Elected President

Barack Obama
Democratic

The 2012 United States presidential election in Wyoming took place on November 6, 2012, as part of the 2012 United States presidential election in which all 50 states plus the District of Columbia participated. Wyoming voters chose three electors to represent them in the Electoral College via a popular vote pitting incumbent Democratic President Barack Obama and his running mate, Vice President Joe Biden, against Republican challenger and former Massachusetts Governor Mitt Romney and his running mate, Congressman Paul Ryan.

Contents

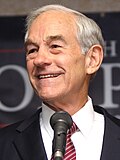
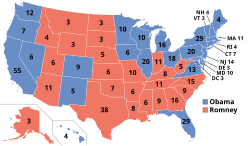
Prior to the election, 17 news organizations considered this a state Romney would win, or otherwise considered as a safe red state. Romney carried the state with 68.64% to Obama's 27.82%, with Libertarian Gary Johnson taking 2.14%.

With 68.64% of the popular vote, Wyoming would prove to be Romney's second strongest state in the 2012 election after neighboring Utah. [1] As of the 2024 election, this is the last time that Albany County failed to back the overall winner of the Electoral College, and presidency.

Caucuses

Democratic caucuses

Republican caucuses

2012 Wyoming Republican presidential caucus
Flag of Wyoming.svg
  2008 March 6, 2012 (2012-03-06) 2016  
  MI
WA  
  Mitt Romney by Gage Skidmore 6 cropped.jpg Rick Santorum by Gage Skidmore.jpg
Candidate Mitt Romney Rick Santorum
Home state Massachusetts Pennsylvania
Delegate count118
Popular vote822673
Percentage38.99%31.93%

  Ron Paul by Gage Skidmore 3 (crop 2).jpg Newt Gingrich by Gage Skidmore 3 (cropped).jpg
Candidate Ron Paul Newt Gingrich
Home state Texas Georgia
Delegate count62
Popular vote439165
Percentage20.83%7.83%

Wyoming Republican Presidential Caucuses Election Results by County, 2012.svg
Wyoming results by county
  Mitt Romney
  Rick Santorum
  Ron Paul

The Republican caucuses took place between Saturday, February 11 and Wednesday, February 29, 2012. The county conventions were held March 6–10, 2012. [2] The results of the conventions were reported on Saturday, March 10, 2012, the same day on which the Guam, Kansas, and Virgin Islands caucuses were held. After narrowly beating Santorum during the precinct caucuses in February, Romney went on to win the county conventions decisively. [3]

The caucuses took place over a number of days to accommodate the state's geographic size and sparse population, particularly ranchers in the midst of calving season. The entire process of nominating Wyoming's delegates lasts from February until April. [4]

Precinct caucus results

The precinct caucuses that took place from February 11 to February 29 were the only stage of the Wyoming Republican caucuses in which every registered Wyoming Republican was eligible to participate. [5] No delegates were chosen during this stage.

2012 Wyoming Republican presidential caucuses (straw poll) [6]
CandidateVotesPercentage
America Symbol.svg Mitt Romney 82238.99%
Rick Santorum 67331.93%
Ron Paul 43920.83%
Newt Gingrich 1657.83%
Others90.43%
Total:2,108100.00%

Convention

Delegates were chosen at county conventions on March 6–10 and the state convention on April 12–14.

Convention Results [7] [8]
CandidateCounty
Conventions
StateParty
leaders
Total
America Symbol.svg Mitt Romney 814022
Rick Santorum 2002
Ron Paul 1001
Unknown1034
Total1214329

General election

Predictions

SourceRankingAs of
Huffington Post [9] Safe RNovember 6, 2012
CNN [10] Safe RNovember 6, 2012
New York Times [11] Safe RNovember 6, 2012
Washington Post [12] Safe RNovember 6, 2012
RealClearPolitics [13] Solid RNovember 6, 2012
Sabato's Crystal Ball [14] Solid RNovember 5, 2012
FiveThirtyEight [15] Solid RNovember 6, 2012

Results

2012 United States presidential election in Wyoming [16]
PartyCandidateRunning mateVotesPercentageElectoral votes
Republican Mitt Romney Paul Ryan 170,96268.64%3
Democratic Barack Obama (incumbent) Joe Biden (incumbent)69,28627.82%0
Libertarian Gary Johnson Jim Gray 5,3262.14%0
Write-InsWrite-Ins2,0350.82%0
Constitution Virgil Goode Jim Clymer1,4520.58%0
Totals249,061100.00%3

By county

CountyMitt Romney
Republican
Barack Obama
Democratic
Various candidates
Other parties
MarginTotal votes cast
# %# %# %# %
Albany 7,86648.26%7,45845.75%9765.99%4082.51%16,300
Big Horn 4,28580.48%86816.30%1713.21%3,41764.18%5,324
Campbell 14,95385.10%2,16312.31%4552.59%12,79072.79%17,571
Carbon 4,14863.73%2,11032.42%2513.86%2,03831.31%6,509
Converse 5,04379.50%1,08917.17%2113.32%3,95462.33%6,343
Crook 3,10984.37%42611.56%1504.07%2,68372.81%3,685
Fremont 11,07565.38%5,33331.48%5313.13%5,74233.90%16,939
Goshen 4,17871.96%1,45825.11%1702.93%2,72046.85%5,806
Hot Springs 1,89575.35%52320.80%973.86%1,37254.55%2,515
Johnson 3,36378.96%74917.59%1473.45%2,61461.37%4,259
Laramie 23,90460.51%14,29536.19%1,3063.31%9,60924.32%39,505
Lincoln 7,14482.90%1,28714.93%1872.17%5,85767.97%8,618
Natrona 22,13268.37%8,96127.68%1,2803.96%13,17140.69%32,373
Niobrara 1,02280.09%20015.67%544.23%82264.42%1,276
Park 11,23476.90%2,92720.04%4473.06%8,30756.86%14,608
Platte 3,13669.21%1,22326.99%1723.80%1,91342.22%4,531
Sheridan 10,26771.69%3,61825.26%4373.05%6,64946.43%14,322
Sublette 3,47279.34%76717.53%1373.13%2,70561.81%4,376
Sweetwater 11,42867.64%4,77428.26%6934.10%6,65439.38%16,895
Teton 4,85842.38%6,21354.20%3933.43%-1,355-11.82%11,464
Uinta 6,61577.47%1,62819.07%2963.46%4,97858.40%8,539
Washakie 3,01476.42%79420.13%1363.45%2,22056.29%3,944
Weston 2,82183.98%42212.56%1163.45%2,39971.42%3,359
Total170,96268.64%69,28627.82%8,8133.54%101,67640.82%249,061
County Flips:
Democratic
Hold
Republican
Hold
Gain from Democratic Wyoming County Flips 2012.svg
County Flips:
Counties that flipped from Democratic to Republican

By congressional district

Due to the state's low population, only one congressional district is allocated. This district is called the at-large district, because it covers the entire state, and thus is equivalent to the statewide election results.

DistrictRomneyObamaRepresentative
At-large 68.64%27.82% Cynthia Lummis

See also

References

  1. "2012 Presidential Election Statistics". Dave Leip’s Atlas of U.S. Presidential Elections. Retrieved March 5, 2018.
  2. "Wyoming Republican". greenpapers.com. Retrieved February 29, 2012.
  3. Romney wins Wyoming, AP reports. CBS News. 2012-03-10. Accessed 2012-03-11.
  4. Beck, Bob. "Wyoming's GOP Caucuses: The Process Is Drawn Out And Confusing". It's All Politics. NPR. Retrieved March 1, 2012.
  5. "Romney Wins Wyoming". NPR . Archived from the original on March 1, 2012. Retrieved March 1, 2012.
  6. "2012 straw poll results | Wyoming GOPWyoming GOP". Archived from the original on May 4, 2012. Retrieved May 4, 2012.
  7. "Wyoming Republican Delegation 2012".
  8. @meadgruver (April 14, 2012). "Wyo. GOP gives all 14 remaining..." (Tweet) via Twitter.
  9. "Huffington Post Election Dashboard". HuffPost . Archived from the original on August 13, 2013.
  10. "America's Choice 2012 Election Center: CNN Electoral Map". CNN . Archived from the original on January 19, 2013.
  11. "Election 2012 - The Electoral Map: Building a Path to Victory". The New York Times . Archived from the original on July 8, 2012.
  12. "2012 Presidential Election Results" . The Washington Post. Archived from the original on July 26, 2012.
  13. "RealClearPolitics - 2012 Election Maps - Battle for White House". Archived from the original on June 8, 2011.
  14. "PROJECTION: OBAMA WILL LIKELY WIN SECOND TERM".
  15. "Nate Silver's political calculations predict 2012 election outcome".
  16. "Wyoming Secretary of State" (PDF). Retrieved December 8, 2012.