1916 United States presidential election in Wyoming

Last updated

1916 United States presidential election in Wyoming
Flag of Wyoming.svg
  1912 November 7, 1916 1920  
  Thomas Woodrow Wilson, Harris & Ewing bw photo portrait, 1919 (cropped 3x4).jpg HUGHES, CHARLES E. HONORABLE LCCN2016857545 (restored) (3x4 crop).png
Nominee Woodrow Wilson Charles Evans Hughes
Party Democratic Republican
Home state New Jersey New York
Running mate Thomas R. Marshall Charles W. Fairbanks
Electoral vote30
Popular vote28,37621,698
Percentage54.67%41.80%

Wyoming Presidential Election Results 1916.svg
County Results

President before election

Woodrow Wilson
Democratic

Elected President

Woodrow Wilson
Democratic

The 1916 United States presidential election in Wyoming took place on November 7, 1916, as part of the 1916 United States presidential election. State voters chose three representatives, or electors, to the Electoral College, who voted for president and vice president.

Contents

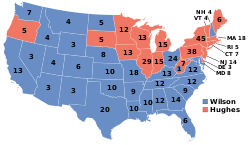
In 1912, Wyoming had been the eighth-best state for embattled Republican nominee William Howard Taft. [1] However, in contrast to the East where supporters of Theodore Roosevelt's Progressive "Bull Moose" Party rapidly returned to the Republicans, in the Mountain States many if not most of these supporters turned to the Democratic Party not only in presidential elections, but also in state and federal legislative ones. [2] Another factor helping President Woodrow Wilson was a powerful "peace vote" in the Western states [3] due to opposition to participation in World War I, and a third was that a considerable part of the substantial vote for Eugene Debs from the previous election was turned over to Wilson owing to such Progressive reforms as the Sixteenth and Seventeenth Amendments. [2]

Consequently, Wilson was able not merely to hold Wyoming from 1912, but to increase his margin by over ten percentage points to carry the state by 12.87 percent. This is the third best Democratic performance in the history of presidential elections in Wyoming, behind Franklin Delano Roosevelt's landslide wins in 1932 and 1936. [4] Wilson became the first Democratic presidential candidate to carry the counties of Carbon, Converse, Lincoln, Natrona, Niobrara, and Washakie. [5] As of the 2024 presidential election , this election is the last time Wyoming has voted more Democratic than the nation at-large.

Results

General Election Results [6]
PartyPledged toElectorVotes
Democratic Party Woodrow WilsonJohn L. Jordan28,376
Democratic Party Woodrow WilsonJames P. Smith28,062
Democratic Party Woodrow WilsonAlfred M. Brock27,990
Republican Party Charles Evans HughesJohn L. Baird21,698
Republican Party Charles Evans HughesW. E. Chpalin21,433
Republican Party Charles Evans HughesJacob A. Delfelder21,198
Socialist Party Allan BensonMatilda Hautamaki1,459
Socialist Party Allan BensonJoseph Dunning1,434
Socialist Party Allan BensonW. S. Oeland1,424
Prohibition Party James HanlyC. J. Sawyer373
Prohibition Party James HanlyElla Watson364
Prohibition Party James HanlyLuther J. Wood354
Votes cast [a] 51,906

Results by county

County [6] Woodrow Wilson
Democrat
Charles Evans Hughes
Republican
Allan Benson
Socialist
James Hanly
Prohibition
MarginTotal votes cast [b]
#%#%#%#%#%
Albany 1,57152.45%1,31343.84%732.44%381.27%2588.61%2,995
Big Horn 1,49353.92%1,23944.75%291.05%80.29%2549.17%2,769
Campbell 69059.48%44838.62%121.03%100.86%24220.86%1,160
Carbon 1,66154.58%1,21739.99%1555.09%100.33%44414.59%3,043
Converse 87952.32%76645.60%201.19%150.89%1136.73%1,680
Crook 1,18156.59%84640.54%512.44%90.43%33516.05%2,087
Fremont 1,75253.89%1,40743.28%752.31%170.52%34510.61%3,251
Goshen 1,09656.61%77039.77%492.53%211.08%32616.84%1,936
Hot Springs 76054.25%52337.33%956.78%231.64%23716.92%1,401
Johnson 81249.03%81449.15%281.69%20.12%-2-0.12%1,656
Laramie 2,75951.80%2,42845.59%841.58%551.03%3316.21%5,326
Lincoln 2,37860.11%1,42636.05%1423.59%100.25%95224.06%3,956
Natrona 1,37759.17%91239.19%301.29%80.34%46519.98%2,327
Niobrara 59951.28%53345.63%141.20%221.88%665.65%1,168
Park 1,18149.96%1,09246.19%692.92%220.93%893.76%2,364
Platte 1,30258.54%80636.24%632.83%532.38%49622.30%2,224
Sheridan 2,90657.57%1,91437.92%2054.06%230.46%99219.65%5,048
Sweetwater 1,49650.90%1,28743.79%1525.17%40.14%2097.11%2,939
Uinta 1,29559.57%82237.81%512.35%60.28%47321.76%2,174
Washakie 45555.62%34442.05%161.96%30.37%11113.57%818
Weston 73346.28%79149.94%462.90%140.88%-58-3.66%1,584
Totals28,37654.67%21,69841.80%1,4592.81%3730.72%6,67812.87%51,906

Counties that flipped from Republican to Democratic

Counties that flipped from Democratic to Republican

See also

Notes

  1. Based on totals for highest elector on each ticket
  2. Based on highest elector on each ticket

References

  1. Dave Leip's U.S. Election Atlas; 1912 Presidential General Election Data – National by State: Sorted by Vote Percentage for Taft
  2. 1 2 Sarasohn, David (1980). "The Election of 1916: Realigning the Rockies" . The Western Historical Quarterly. 11 (3): 285–305. doi:10.2307/967564. ISSN   0043-3810. JSTOR   967564 . Retrieved July 26, 2024.
  3. Menendez, Albert J. (2005). The Geography of Presidential Elections in the United States, 1868-2004. McFarland. ISBN   978-0-7864-2217-3 . Retrieved July 26, 2024.
  4. Dave Leip's U.S. Election Atlas; Presidential General Election Results Comparison – Wyoming
  5. Menendez; The Geography of Presidential Elections in the United States, pp. 342-343
  6. 1 2 Trenholm, Virginia Cole, ed. (1974). "Election Statistics". Wyoming Blue Book Volume II (PDF). Cheyenne, Wyoming: Wyoming State Archives and Historical Department. p. 590. Retrieved October 18, 2024.