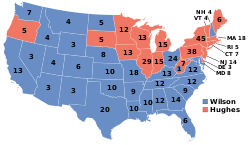
![]() | ||||||||||||||||||||||||||
| ||||||||||||||||||||||||||
| ||||||||||||||||||||||||||
![]() County results
| ||||||||||||||||||||||||||
|
Elections in Alabama |
---|
![]() |
![]() |
The 1916 United States presidential election in Alabama took place on November 7, 1916, as part of the nationwide presidential election. State voters chose twelve representatives, or electors, to the Electoral College, who voted for president and vice president.
Since the 1890s, Alabama had been effectively a one-party state ruled by the Democratic Party. Disenfranchisement of almost all African-Americans and a large proportion of poor whites via poll taxes, literacy tests [1] and extralegal violence [2] had essentially eliminated opposition parties outside of Unionist Winston County and a few nearby northern hill counties that had been Populist strongholds. [3] The only competitive statewide elections became Democratic Party primaries that were limited by law to white voters.
Unlike the other Deep South states, however, soon after black disenfranchisement Alabama's white Republicans made rapid efforts to expel blacks from the state Republican Party. [4] For the 1904 Convention, President Theodore Roosevelt rejected this proposal, unlike in North Carolina where he acquiesced without opposition to the demands of Jeter Connelly Pritchard. [4] Oscar D. Street was appointed state party boss as part of the pro-Taft “black and tan” faction in 1912, [5] while Roosevelt planned “lily-whitism” for the South with his “Bull Moose” party after he broke from the GOP. [6] Roosevelt's personal popularity even in the overwhelmingly Democratic Deep South meant he easily outpolled Taft in the region, [7] and in Alabama this led the pro-Taft Street to move the state GOP in a lily-white direction much earlier than any other Deep South state. [8]
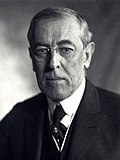
With President Wilson still popular, however, the shift to a lily-white Republican Party would have no effect on Alabama's presidential voting. An early poll in August saw incumbent President Woodrow Wilson (D–New Jersey), running with incumbent Vice President Thomas R. Marshall, with 24 votes, against Associate Justice of the U.S. Supreme Court Charles Evans Hughes (R–New York), running with former Vice President Charles W. Fairbanks, with five votes. [9] All later forecasts showed the state going to Wilson, [10] and in the end the small August poll proved fairly accurate, with Wilson winning 76.04 percent of the vote to Hughes’ 21.92 percent. [11] Wilson carried all but three counties, and his appeal to Progressive former Populists allowed him to carry one of the four counties — Cullman — that the “Bull Moose” party had won in 1912.
Party | Candidate | Votes | % | |
---|---|---|---|---|
Democratic | Woodrow Wilson (incumbent) | 99,409 | 76.04% | |
Republican | Charles Evans Hughes | 28,662 | 21.92% | |
Socialist | Allan L. Benson | 1,916 | 1.47% | |
Prohibition | Frank Hanly | 741 | 0.57% | |
Total votes | 129,987 | 100.00% |
County [13] | Woodrow Wilson Democratic | Charles Evans Hughes Republican | Allan L. Benson Socialist | Frank Hanly Prohibition | Margin | Total votes cast | |||||
---|---|---|---|---|---|---|---|---|---|---|---|
# | % | # | % | # | % | # | % | # | % | ||
Autauga | 773 | 87.05% | 99 | 11.15% | 11 | 1.24% | 5 | 0.56% | 674 | 75.90% | 888 |
Baldwin | 766 | 67.19% | 216 | 18.95% | 148 | 12.98% | 10 | 0.88% | 550 | 48.25% | 1,140 |
Barbour | 1,235 | 94.64% | 45 | 3.45% | 13 | 1.00% | 12 | 0.92% | 1,190 | 91.19% | 1,305 |
Bibb | 1,247 | 78.58% | 217 | 13.67% | 106 | 6.68% | 17 | 1.07% | 1,030 | 64.90% | 1,587 |
Blount | 1,488 | 54.13% | 1,229 | 44.71% | 26 | 0.95% | 6 | 0.22% | 259 | 9.42% | 2,749 |
Bullock | 743 | 99.20% | 4 | 0.53% | 2 | 0.27% | 0 | 0.00% | 739 | 98.66% | 749 |
Butler | 1,162 | 93.03% | 78 | 6.24% | 6 | 0.48% | 3 | 0.24% | 1,084 | 86.79% | 1,249 |
Calhoun | 2,231 | 81.81% | 442 | 16.21% | 29 | 1.06% | 25 | 0.92% | 1,789 | 65.60% | 2,727 |
Chambers | 1,679 | 89.88% | 168 | 8.99% | 7 | 0.37% | 14 | 0.75% | 1,511 | 80.89% | 1,868 |
Cherokee | 1,136 | 67.78% | 508 | 30.31% | 27 | 1.61% | 5 | 0.30% | 628 | 37.47% | 1,676 |
Chilton | 881 | 38.34% | 1,363 | 59.31% | 40 | 1.74% | 14 | 0.61% | -482 | -20.97% | 2,298 |
Choctaw | 765 | 95.63% | 21 | 2.63% | 12 | 1.50% | 2 | 0.25% | 744 | 93.00% | 800 |
Clarke | 1,397 | 97.42% | 25 | 1.74% | 12 | 0.84% | 0 | 0.00% | 1,372 | 95.68% | 1,434 |
Clay | 1,196 | 63.72% | 677 | 36.07% | 1 | 0.05% | 3 | 0.16% | 519 | 27.65% | 1,877 |
Cleburne | 760 | 56.21% | 578 | 42.75% | 5 | 0.37% | 9 | 0.67% | 182 | 13.46% | 1,352 |
Coffee | 2,029 | 81.95% | 426 | 17.21% | 17 | 0.69% | 4 | 0.16% | 1,603 | 64.74% | 2,476 |
Colbert | 1,132 | 74.04% | 352 | 23.02% | 44 | 2.88% | 1 | 0.07% | 780 | 51.01% | 1,529 |
Conecuh | 1,036 | 94.44% | 42 | 3.83% | 17 | 1.55% | 2 | 0.18% | 994 | 90.61% | 1,097 |
Coosa | 867 | 62.42% | 485 | 34.92% | 34 | 2.45% | 3 | 0.22% | 382 | 27.50% | 1,389 |
Covington | 1,738 | 79.94% | 305 | 14.03% | 107 | 4.92% | 24 | 1.10% | 1,433 | 65.92% | 2,174 |
Crenshaw | 1,427 | 90.43% | 139 | 8.81% | 5 | 0.32% | 7 | 0.44% | 1,288 | 81.62% | 1,578 |
Cullman | 1,396 | 50.52% | 1,351 | 48.90% | 9 | 0.33% | 7 | 0.25% | 45 | 1.63% | 2,763 |
Dale | 1,260 | 67.38% | 597 | 31.93% | 4 | 0.21% | 9 | 0.48% | 663 | 35.45% | 1,870 |
Dallas | 1,565 | 97.87% | 23 | 1.44% | 7 | 0.44% | 4 | 0.25% | 1,542 | 96.44% | 1,599 |
DeKalb | 1,787 | 59.09% | 1,190 | 39.35% | 33 | 1.09% | 14 | 0.46% | 597 | 19.74% | 3,024 |
Elmore | 1,631 | 99.57% | 0 | 0.00% | 0 | 0.00% | 7 | 0.43% | 1,624 [a] | 99.15% | 1,638 |
Escambia | 982 | 89.84% | 108 | 9.88% | 3 | 0.27% | 0 | 0.00% | 874 | 79.96% | 1,093 |
Etowah | 1,883 | 66.65% | 862 | 30.51% | 73 | 2.58% | 7 | 0.25% | 1,021 | 36.14% | 2,825 |
Fayette | 1,026 | 58.43% | 697 | 39.69% | 18 | 1.03% | 15 | 0.85% | 329 | 18.74% | 1,756 |
Franklin | 1,044 | 50.34% | 984 | 47.44% | 39 | 1.88% | 7 | 0.34% | 60 | 2.89% | 2,074 |
Geneva | 1,265 | 62.84% | 713 | 35.42% | 23 | 1.14% | 12 | 0.60% | 552 | 27.42% | 2,013 |
Greene | 383 | 97.70% | 9 | 2.30% | 0 | 0.00% | 0 | 0.00% | 374 | 95.41% | 392 |
Hale | 795 | 97.79% | 15 | 1.85% | 1 | 0.12% | 2 | 0.25% | 780 | 95.94% | 813 |
Henry | 860 | 83.25% | 141 | 13.65% | 27 | 2.61% | 5 | 0.48% | 719 | 69.60% | 1,033 |
Houston | 1,670 | 76.05% | 466 | 21.22% | 46 | 2.09% | 14 | 0.64% | 1,204 | 54.83% | 2,196 |
Jackson | 1,907 | 75.61% | 567 | 22.48% | 32 | 1.27% | 16 | 0.63% | 1,340 | 53.13% | 2,522 |
Jefferson | 10,677 | 81.38% | 2,052 | 15.64% | 296 | 2.26% | 95 | 0.72% | 8,625 | 65.74% | 13,120 |
Lamar | 1,299 | 79.45% | 303 | 18.53% | 4 | 0.24% | 29 | 1.77% | 996 | 60.92% | 1,635 |
Lauderdale | 1,678 | 79.64% | 369 | 17.51% | 47 | 2.23% | 13 | 0.62% | 1,309 | 62.13% | 2,107 |
Lawrence | 995 | 85.92% | 43 | 3.71% | 4 | 0.35% | 116 | 10.02% | 879 [a] | 75.91% | 1,158 |
Lee | 1,369 | 94.67% | 42 | 2.90% | 30 | 2.07% | 5 | 0.35% | 1,327 | 91.77% | 1,446 |
Limestone | 1,450 | 92.12% | 92 | 5.84% | 19 | 1.21% | 13 | 0.83% | 1,358 | 86.28% | 1,574 |
Lowndes | 540 | 98.00% | 9 | 1.63% | 1 | 0.18% | 1 | 0.18% | 531 | 96.37% | 551 |
Macon | 575 | 92.59% | 43 | 6.92% | 2 | 0.32% | 1 | 0.16% | 532 | 85.67% | 621 |
Madison | 2,206 | 89.17% | 215 | 8.69% | 45 | 1.82% | 8 | 0.32% | 1,991 | 80.48% | 2,474 |
Marengo | 1,491 | 98.61% | 19 | 1.26% | 1 | 0.07% | 1 | 0.07% | 1,472 | 97.35% | 1,512 |
Marion | 1,325 | 61.89% | 807 | 37.69% | 1 | 0.05% | 8 | 0.37% | 518 | 24.19% | 2,141 |
Marshall | 1,944 | 61.32% | 1,183 | 37.32% | 33 | 1.04% | 10 | 0.32% | 761 | 24.01% | 3,170 |
Mobile | 2,968 | 76.18% | 832 | 21.36% | 75 | 1.93% | 21 | 0.54% | 2,136 | 54.83% | 3,896 |
Monroe | 1,029 | 98.09% | 17 | 1.62% | 2 | 0.19% | 1 | 0.10% | 1,012 | 96.47% | 1,049 |
Montgomery | 3,316 | 96.06% | 106 | 3.07% | 19 | 0.55% | 11 | 0.32% | 3,210 | 92.99% | 3,452 |
Morgan | 2,120 | 82.62% | 364 | 14.19% | 44 | 1.71% | 38 | 1.48% | 1,756 | 68.43% | 2,566 |
Perry | 895 | 96.44% | 20 | 2.16% | 12 | 1.29% | 1 | 0.11% | 875 | 94.29% | 928 |
Pickens | 1,179 | 83.09% | 218 | 15.36% | 18 | 1.27% | 4 | 0.28% | 961 | 67.72% | 1,419 |
Pike | 1,789 | 96.39% | 50 | 2.69% | 11 | 0.59% | 6 | 0.32% | 1,739 | 93.70% | 1,856 |
Randolph | 1,324 | 66.70% | 652 | 32.85% | 4 | 0.20% | 5 | 0.25% | 672 | 33.85% | 1,985 |
Russell | 752 | 99.08% | 3 | 0.40% | 4 | 0.53% | 0 | 0.00% | 748 [b] | 98.55% | 759 |
St. Clair | 987 | 51.97% | 851 | 44.81% | 53 | 2.79% | 8 | 0.42% | 136 | 7.16% | 1,899 |
Shelby | 1,311 | 47.57% | 1,428 | 51.81% | 8 | 0.29% | 9 | 0.33% | -117 | -4.25% | 2,756 |
Sumter | 770 | 98.21% | 8 | 1.02% | 6 | 0.77% | 0 | 0.00% | 762 | 97.19% | 784 |
Talladega | 1,539 | 77.10% | 447 | 22.39% | 4 | 0.20% | 6 | 0.30% | 1,092 | 54.71% | 1,996 |
Tallapoosa | 1,892 | 91.98% | 129 | 6.27% | 33 | 1.60% | 3 | 0.15% | 1,763 | 85.71% | 2,057 |
Tuscaloosa | 2,437 | 89.99% | 218 | 8.05% | 41 | 1.51% | 12 | 0.44% | 2,219 | 81.94% | 2,708 |
Walker | 2,314 | 53.80% | 1,860 | 43.25% | 107 | 2.49% | 20 | 0.47% | 454 | 10.56% | 4,301 |
Washington | 500 | 92.94% | 32 | 5.95% | 2 | 0.37% | 4 | 0.74% | 468 | 86.99% | 538 |
Wilcox | 866 | 99.88% | 1 | 0.12% | 0 | 0.00% | 0 | 0.00% | 865 | 99.77% | 867 |
Winston | 727 | 39.36% | 1,107 | 59.94% | 6 | 0.32% | 7 | 0.38% | -380 | -20.57% | 1,847 |
Totals | 99,409 | 76.04% | 28,662 | 21.92% | 1,916 | 1.47% | 741 | 0.57% | 70,747 | 54.12% | 130,728 |
The 1912 United States presidential election in New York took place on November 5, 1912. All contemporary 48 states were part of the 1912 United States presidential election. Voters chose 45 electors to the Electoral College, which selected the president and vice president.
The 1912 United States presidential election in Vermont took place on November 5, 1912, as part of the 1912 United States presidential election which was held throughout all contemporary 48 states. Voters chose four representatives, or electors to the Electoral College, who voted for president and vice president.
The 1920 United States presidential election in Alabama took place on November 2, 1920, as part of the 1920 general election, in which all 48 states participated. Alabama voters chose twelve electors to represent them in the Electoral College via popular vote pitting Democratic nominee James M. Cox and his running mate, Assistant Secretary of the Navy Franklin Roosevelt, against Republican challenger U.S. Senator Warren G. Harding and his running mate, Governor Calvin Coolidge.
The 1912 United States presidential election in Virginia took place on November 5, 1912. Voters chose 12 representatives, or electors to the Electoral College, who voted for president and vice president.
The 1912 United States presidential election in Wisconsin was held on November 5, 1912 as part of the 1912 United States presidential election. State voters chose 13 electors to the Electoral College, who voted for president and vice president.
The 1912 United States presidential election in Minnesota took place on November 5, 1912 as part of the 1912 United States presidential election. Minnesota voters chose 12 electors to the Electoral College, which selected the president and vice president.
The 1948 United States presidential election in Alabama was held on November 2, 1948. Alabama voters sent eleven electors to the Electoral College who voted for President and Vice-President. In Alabama, voters voted for electors individually instead of as a slate.
The 1920 United States presidential election in Florida, was held on November 2, 1920. Voters chose six representatives, or electors to the Electoral College, who voted for the president and vice-president.
The 1912 United States presidential election in Tennessee took place on November 5, 1912, as part of the 1912 United States presidential election. Tennessee voters chose twelve representatives, or electors, to the Electoral College, who voted for president and vice president.
The 1912 United States presidential election in North Carolina took place on November 5, 1912, as part of the 1912 United States presidential election. North Carolina voters chose 12 representatives, or electors, to the Electoral College, who voted for president and vice president. Like all former Confederate states, North Carolina would during its “Redemption” develop a politics based upon Jim Crow laws, disfranchisement of its African-American population and dominance of the Democratic Party. However, unlike the Deep South, the Republican Party possessed sufficient historic Unionist white support from the mountains and northwestern Piedmont to gain a stable one-third of the statewide vote total in general elections even after blacks lost the right to vote.
The 1912 United States presidential election in Michigan took place on November 5, 1912, as part of the 1912 United States presidential election. Voters chose 15 representatives, or electors, to the Electoral College, who voted for president and vice president.
The 1912 United States presidential election in Alabama took place on November 5, 1912, as part of the 1912 United States presidential election. Alabama voters chose twelve representatives, or electors, to the Electoral College, who voted for president and vice president.
The 1912 United States presidential election in Georgia took place on November 5, 1912, as part of the 1912 United States presidential election. Georgia voters chose 14 representatives, or electors, to the Electoral College, who voted for president and vice president. With the exception of a handful of historically Unionist North Georgia counties – chiefly Fannin but also to a lesser extent Pickens, Gilmer and Towns – Georgia since the 1880s had been a one-party state dominated by the Democratic Party. Disfranchisement of almost all African-Americans and most poor whites had made the Republican Party virtually nonexistent outside of local governments in those few hill counties, and the national Democratic Party served as the guardian of white supremacy against a Republican Party historically associated with memories of Reconstruction. The only competitive elections were Democratic primaries, which state laws restricted to whites on the grounds of the Democratic Party being legally a private club.
The 1912 United States presidential election in Louisiana took place on November 5, 1912, as part of the 1912 United States presidential election. State voters chose ten representatives, or electors, to the Electoral College, who voted for president and vice president.
The 1944 United States presidential election in Alabama took place on November 7, 1944, as part of the 1944 United States presidential election. Alabama voters chose eleven representatives, or electors, to the Electoral College, who voted for president and vice president.
The 1940 United States presidential election in Alabama took place on November 5, 1940, as part of the 1940 United States presidential election. Alabama voters chose 11 representatives, or electors, to the Electoral College, who voted for president and vice president. In Alabama, voters voted for electors individually instead of as a slate, as in the other states.
The 1936 United States presidential election in Alabama took place on November 3, 1936, as part of the nationwide presidential election. Voters chose eleven representatives, or electors to the Electoral College, who voted for president and vice president. In Alabama, voters voted for electors individually instead of as a slate, as in the other states.
The 1932 United States presidential election in Alabama took place on November 8, 1932, as part of the nationwide presidential election. Alabama voters chose eleven representatives, or electors, to the Electoral College, who voted for president and vice president. In Alabama, voters voted for electors individually instead of as a slate, as in the other states.
The 1916 United States presidential election in Oklahoma took place on November 7, 1916, as part of the 1916 United States presidential election.
The 1924 United States presidential election in Alabama took place on November 4, 1924, as part of the nationwide presidential election, which was held throughout all contemporary forty-eight states. Voters chose twelve representatives, or electors, to the Electoral College, who voted for president and vice president.