Butler County, Alabama

Last updated

Butler County
Greenville AL Butler Co Court House.JPG
Butler County Courthouse in Greenville
Seal of Butler County, Alabama.png
Map of Alabama highlighting Butler County.svg
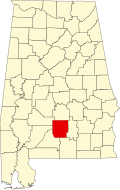
Location within the U.S. state of Alabama
Alabama in United States.svg
Alabama's location within the U.S.
Coordinates: 31°44′58″N86°40′56″W / 31.749444444444°N 86.682222222222°W / 31.749444444444; -86.682222222222
CountryFlag of the United States.svg United States
StateFlag of Alabama.svg Alabama
FoundedDecember 13, 1819
Named after William Butler
Seat Greenville
Largest cityGreenville
Area
  Total
778 sq mi (2,020 km2)
  Land777 sq mi (2,010 km2)
  Water1.1 sq mi (3 km2)  0.1%
Population
 (2020)
  Total
19,051
  Estimate 
(2024)
18,256 Decrease2.svg
  Density24/sq mi (9.5/km2)
Time zone UTC−6 (Central)
  Summer (DST) UTC−5 (CDT)
Congressional district 2nd
Website www.butlercogov.com
  • County Number 10 on Alabama Licence Plates

Butler County is a county located in the south central portion of the U.S. state of Alabama. As of the 2020 census, the population was 19,051. [1] Its county seat is Greenville. Its name is in honor of Captain William Butler, who was born in Virginia and fought in the Creek War, and who was killed in May 1818.

Contents

History

Butler County was formed from Conecuh County, Alabama, and Monroe County, Alabama, by an act passed December 13, 1819, by the Legislature while in session at Huntsville. This was the first session of the Legislature of Alabama as a State. The name of Fairfield was first proposed for this county, but was changed on the passage of the bill to Butler, in honor of Captain William Butler.

The precise date of the first settlement made by whites in Butler County is unclear. Some have it as early as 1814, but the earliest settler of no dispute is James K. Benson, who settled in the Flat in 1815, where he built a log house near the current location of Pine Flat Methodist Church. He was soon followed by William Ogly and John Dickerson and their families, who settled on the Federal Road, some 3 miles (4.8 km) south of where later Fort Dale was built. In the fall of 1816, a group of people from Georgia settled in a tent camp in Pine Flat, and the year after, another group settled near Fort Dale. [2]

Geography

According to the United States Census Bureau, the county has a total area of 778 square miles (2,020 km2), of which 777 square miles (2,010 km2) is land and 1.1 square miles (2.8 km2) (0.1%) is water. [3] It is located in the Gulf Coastal Plain region of the state.

Major highways

Adjacent counties

Demographics

Historical population
CensusPop.Note
1820 1,405
1830 5,650302.1%
1840 8,68553.7%
1850 10,83624.8%
1860 18,12267.2%
1870 14,981−17.3%
1880 19,64931.2%
1890 21,64110.1%
1900 25,76119.0%
1910 29,03012.7%
1920 29,5311.7%
1930 30,1952.2%
1940 32,4477.5%
1950 29,228−9.9%
1960 24,560−16.0%
1970 22,007−10.4%
1980 21,680−1.5%
1990 21,8921.0%
2000 21,399−2.3%
2010 20,947−2.1%
2020 19,051−9.1%
2024 (est.)18,256 [4] −4.2%
U.S. Decennial Census [5]
1790–1960 [6] 1900–1990 [7]
1990–2000 [8] 2010–2020 [1]

2020 census

Butler County, Alabama – Racial and ethnic composition
Note: the US Census treats Hispanic/Latino as an ethnic category. This table excludes Latinos from the racial categories and assigns them to a separate category. Hispanics/Latinos may be of any race.
Race / Ethnicity (NH = Non-Hispanic)Pop 2000 [9] Pop 2010 [10] Pop 2020 [11] % 2000% 2010% 2020
White alone (NH)12,42911,3249,67958.08%54.06%50.81%
Black or African American alone (NH)8,6719,0478,38940.52%43.19%44.03%
Native American or Alaska Native alone (NH)4459230.21%0.28%0.12%
Asian alone (NH)341741430.16%0.83%0.75%
Pacific Islander alone (NH)0750.00%0.03%0.03%
Other race alone (NH)43460.02%0.01%0.24%
Mixed race or Multiracial (NH)741425060.35%0.68%2.66%
Hispanic or Latino (any race)1431912600.67%0.91%1.36%
Total21,39920,94719,051100.00%100.00%100.00%

As of the 2020 United States census, there were 19,051 people, 6,506 households, and 4,331 families residing in the county.

2010 census

As of the 2010 United States census, there were 20,947 people living in the county. 54.4% were White, 43.4% Black or African American, 0.8% Asian, 0.3% Native American, 0.2% of some other race and 0.8% of two or more races. 0.9% were Hispanic or Latino (of any race).

2000 census

As of the census [12] of 2000, there were 21,399 people, 8,398 households, and 5,870 families living in the county. The population density was 28 people per square mile (11 people/km2). There were 9,957 housing units at an average density of 13 units per square mile (5.0 units/km2). The racial makeup of the county was 58.38% White, 40.81% Black or African American, 0.21% Native American, 0.16% Asian, 0.05% from other races, and 0.39% from two or more races. 0.67% of the population were Hispanic or Latino of any race.

There were 8,398 households, out of which 32.50% had children under the age of 18 living with them, 47.70% were married couples living together, 18.20% had a female householder with no husband present, and 30.10% were non-families. 27.50% of all households were made up of individuals, and 13.50% had someone living alone who was 65 years of age or older. The average household size was 2.52 and the average family size was 3.06.

In the county, the population was spread out, with 26.90% under the age of 18, 8.60% from 18 to 24, 25.10% from 25 to 44, 23.00% from 45 to 64, and 16.40% who were 65 years of age or older. The median age was 38 years. For every 100 females there were 88.00 males. For every 100 females age 18 and over, there were 82.90 males.

The median income for a household in the county was $24,791, and the median income for a family was $30,915. Males had a median income of $28,968 versus $18,644 for females. The per capita income for the county was $15,715. About 20.40% of families and 24.60% of the population were below the poverty line, including 31.30% of those under age 18 and 28.60% of those age 65 or over.

Education

Butler County contains one public school district. There are approximately 3,000 students in public PK-12 schools in Butler County. [13]

Districts

School districts include: [14]

Government

The last Democrat to win the county in a presidential election is Bill Clinton, who won it by a plurality in 1996.

United States presidential election results for Butler County, Alabama [15]
Year Republican Democratic Third party(ies)
No.%No.%No.%
1904 838.69%80584.29%677.02%
1908 13715.15%72780.42%404.42%
1912 867.90%90383.00%999.10%
1916 786.24%1,16293.03%90.72%
1920 15310.40%1,29988.31%191.29%
1924 957.54%1,05083.33%1159.13%
1928 69936.14%1,23563.86%00.00%
1932 743.13%2,28096.45%100.42%
1936 833.39%2,35896.32%70.29%
1940 521.87%2,73297.99%40.14%
1944 804.00%1,91595.75%50.25%
1948 916.46%00.00%1,31893.54%
1952 1,08730.81%2,44069.16%10.03%
1956 1,32437.48%1,95855.42%2517.10%
1960 1,23129.87%2,87269.69%180.44%
1964 4,00280.44%00.00%97319.56%
1968 5006.79%1,24016.85%5,62176.36%
1972 4,68576.45%1,40122.86%420.69%
1976 2,90940.36%4,27159.25%280.39%
1980 3,81045.53%4,15649.67%4024.80%
1984 4,94156.73%3,64141.81%1271.46%
1988 3,92352.59%3,46546.45%710.95%
1992 3,49441.21%4,02147.43%96311.36%
1996 3,35243.14%3,82849.27%5907.59%
2000 4,12752.89%3,60646.21%700.90%
2004 4,97959.16%3,41340.55%240.29%
2008 5,48556.49%4,18843.14%360.37%
2012 5,08753.54%4,37446.03%410.43%
2016 4,90156.13%3,72642.67%1051.20%
2020 5,45857.53%3,96541.79%650.69%
2024 5,17260.99%3,25138.34%570.67%

Communities

City

Towns

Unincorporated communities

Notable people

See also

References

  1. 1 2 "State & County QuickFacts". United States Census Bureau. Retrieved September 10, 2023.
  2. Latte, John Buckner (1971) [1885]. Little, Jr., John G. (ed.). History of Butler County, Alabama, 1815 to 1885. Greenville, AL. pp. 22–23.{{cite book}}: CS1 maint: location missing publisher (link)
  3. "2010 Census Gazetteer Files". United States Census Bureau. August 22, 2012. Retrieved August 22, 2015.
  4. "County Population Totals and Components of Change: 2020-2024". United States Census Bureau. Retrieved September 4, 2025.
  5. "U.S. Decennial Census". United States Census Bureau. Retrieved August 22, 2015.
  6. "Historical Census Browser". University of Virginia Library. Retrieved August 22, 2015.
  7. Forstall, Richard L., ed. (March 24, 1995). "Population of Counties by Decennial Census: 1900 to 1990". United States Census Bureau. Retrieved August 22, 2015.
  8. "Census 2000 PHC-T-4. Ranking Tables for Counties: 1990 and 2000" (PDF). United States Census Bureau. April 2, 2001. Retrieved August 22, 2015.
  9. "P004 Hispanic or Latino, and Not Hispanic or Latino by Race – 2000: DEC Summary File 1 – Butler County, Alabama". United States Census Bureau .
  10. "P2 Hispanic or Latino, and Not Hispanic or Latino by Race – 2010: DEC Redistricting Data (PL 94-171) – Butler County, Alabama". United States Census Bureau .
  11. "P2 Hispanic or Latino, and Not Hispanic or Latino by Race – 2020: DEC Redistricting Data (PL 94-171) – Butler County, Alabama". United States Census Bureau .
  12. "U.S. Census website". United States Census Bureau . Retrieved May 14, 2011.
  13. "Search for Public School Districts - Butler County, AL". National Center for Education Statistics . Institute of Education Sciences . Retrieved October 2, 2022.
  14. "2020 Census - School District Reference Map: Butler County, AL" (PDF). United States Census Bureau . Retrieved October 2, 2022. Text list.
  15. "Dave Leip's Atlas of U.S. Presidential Elections" . Retrieved November 15, 2016.

31°44′58″N86°40′56″W / 31.74944°N 86.68222°W / 31.74944; -86.68222