| ||||||||||||||||||||||||||
All 12 North Carolina votes to the Electoral College | ||||||||||||||||||||||||||
---|---|---|---|---|---|---|---|---|---|---|---|---|---|---|---|---|---|---|---|---|---|---|---|---|---|---|
| ||||||||||||||||||||||||||
County Results
| ||||||||||||||||||||||||||
|
Elections in North Carolina |
---|
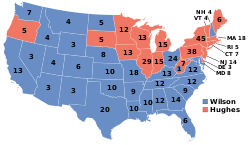
The 1916 United States presidential election in North Carolina took place on November 7, 1916, as part of the 1916 United States presidential election, which was held throughout all contemporary forty-eight states. Voters chose twelve representatives, or electors to the Electoral College, who voted for president and vice president.
Like all former Confederate states, North Carolina would during its “Redemption” develop a politics based upon Jim Crow laws, disfranchisement of its African-American population and dominance of the Democratic Party. Unlike the Deep South, the Republican Party possessed sufficient historic Unionist white support from the mountains and northwestern Piedmont to gain a stable one-third of the statewide vote total in general elections even after blacks lost the right to vote. [1] A rapid move following disenfranchisement to a completely “lily-white” state GOP also helped maintain Republican support amongst the state’s voters. [2] Like Tennessee and Oklahoma, the relative strength of Republican opposition meant that North Carolina did not have statewide White primaries, although certain counties did use the White primary. [3] Although with disfranchisement of blacks the state introduced a poll tax, it was less severe than any other former Confederate state. [4]
Since the tail end of the 1900s, proposals to reform what was recognized as an inefficient and regressive tax system [5] had become the major issue in North Carolina, [6] especially after the Sixteenth Amendment was ratified. [5]
Neither candidate campaigned in the state, which had voted Democratic at every election since 1876. At no point was there any serious question of Wilson carrying the state. [7] On election day projections were for a majority for Wilson of between forty-five thousand and fifty thousand, [8] which closely approximated the final result. Nonetheless, North Carolina was one of only three states where Wilson failed to improve upon his 1912 percentage, and indeed his 16.39 point win was three points smaller than conservative Democrat Alton B. Parker managed in 1904. Hughes, in fact, was the first Republican to ever carry Carteret and Clay Counties, suggesting latent opposition to Wilson in the Outer Banks and Appalachia. [9]
Presidential Candidate | Running Mate | Party | Electoral Vote (EV) | Popular Vote (PV) | |
---|---|---|---|---|---|
Woodrow Wilson of New Jersey | Thomas R. Marshall | Democratic | 12 [10] | 168,383 | 58.10% |
Charles Evans Hughes | Charles W. Fairbanks | Republican | 0 | 120,890 | 41.71% |
Allan L. Benson | George Kirkpatrick | Socialist | 0 | 509 | 0.18% |
Frank Hanly | Ira Landrith | Prohibition | 0 | 53 | 0.02% |
County | Thomas Woodrow Wilson Democratic | Charles Evans Hughes Republican | Allan Louis Benson Socialist | James Franklin Hanly Prohibition | Margin | |||||
---|---|---|---|---|---|---|---|---|---|---|
% | # | % | # | % | # | % | # | % | # | |
Northampton | 97.12% | 1,518 | 2.88% | 45 | 0.00% | 0 | 0.00% | 0 | 94.24% | 1,473 |
Edgecombe | 92.69% | 2,028 | 6.17% | 135 | 1.10% | 24 | 0.05% | 1 | 86.52% | 1,893 |
Bertie | 92.64% | 1,461 | 7.36% | 116 | 0.00% | 0 | 0.00% | 0 | 85.29% | 1,345 |
Currituck | 91.48% | 945 | 8.42% | 87 | 0.00% | 0 | 0.10% | 1 | 83.06% | 858 |
Halifax | 88.51% | 2,312 | 11.45% | 299 | 0.04% | 1 | 0.00% | 0 | 77.07% | 2,013 |
Hoke | 87.64% | 780 | 12.36% | 110 | 0.00% | 0 | 0.00% | 0 | 75.28% | 670 |
Scotland | 87.26% | 938 | 12.74% | 137 | 0.00% | 0 | 0.00% | 0 | 74.51% | 801 |
Anson | 87.18% | 2,046 | 12.82% | 301 | 0.00% | 0 | 0.00% | 0 | 74.35% | 1,745 |
Chowan | 86.89% | 610 | 12.96% | 91 | 0.00% | 0 | 0.14% | 1 | 73.93% | 519 |
Warren | 84.28% | 1,217 | 15.72% | 227 | 0.00% | 0 | 0.00% | 0 | 68.56% | 990 |
Martin | 83.97% | 1,472 | 16.03% | 281 | 0.00% | 0 | 0.00% | 0 | 67.94% | 1,191 |
Franklin | 83.86% | 2,057 | 16.14% | 396 | 0.00% | 0 | 0.00% | 0 | 67.71% | 1,661 |
New Hanover | 82.72% | 2,355 | 17.28% | 492 | 0.00% | 0 | 0.00% | 0 | 65.44% | 1,863 |
Hertford | 82.31% | 977 | 17.61% | 209 | 0.00% | 0 | 0.08% | 1 | 64.70% | 768 |
Pasquotank | 81.28% | 1,177 | 18.65% | 270 | 0.00% | 0 | 0.07% | 1 | 62.64% | 907 |
Camden | 80.70% | 368 | 18.86% | 86 | 0.00% | 0 | 0.44% | 2 | 61.84% | 282 |
Pitt | 79.79% | 2,839 | 20.21% | 719 | 0.00% | 0 | 0.00% | 0 | 59.58% | 2,120 |
Union | 79.04% | 2,662 | 20.84% | 702 | 0.12% | 4 | 0.00% | 0 | 58.19% | 1,960 |
Greene | 78.38% | 1,066 | 21.62% | 294 | 0.00% | 0 | 0.00% | 0 | 56.76% | 772 |
Mecklenburg | 78.11% | 4,508 | 21.78% | 1,257 | 0.10% | 6 | 0.00% | 0 | 56.33% | 3,251 |
Craven | 76.66% | 1,780 | 23.34% | 542 | 0.00% | 0 | 0.00% | 0 | 53.32% | 1,238 |
Jones | 75.34% | 712 | 24.66% | 233 | 0.00% | 0 | 0.00% | 0 | 50.69% | 479 |
Hyde | 74.73% | 840 | 24.64% | 277 | 0.36% | 4 | 0.27% | 3 | 50.09% | 563 |
Wilson | 73.76% | 2,052 | 26.24% | 730 | 0.00% | 0 | 0.00% | 0 | 47.52% | 1,322 |
Gates | 72.78% | 826 | 27.22% | 309 | 0.00% | 0 | 0.00% | 0 | 45.55% | 517 |
Granville | 72.55% | 1,713 | 27.45% | 648 | 0.00% | 0 | 0.00% | 0 | 45.11% | 1,065 |
Nash | 72.15% | 2,189 | 27.22% | 826 | 0.63% | 19 | 0.00% | 0 | 44.92% | 1,363 |
Vance | 72.22% | 1,451 | 27.78% | 558 | 0.00% | 0 | 0.00% | 0 | 44.45% | 893 |
Caswell | 71.52% | 849 | 28.48% | 338 | 0.00% | 0 | 0.00% | 0 | 43.05% | 511 |
Lenoir | 71.35% | 1,666 | 28.57% | 667 | 0.09% | 2 | 0.00% | 0 | 42.78% | 999 |
Pender | 70.80% | 970 | 29.20% | 400 | 0.00% | 0 | 0.00% | 0 | 41.61% | 570 |
Richmond | 70.49% | 1,553 | 29.51% | 650 | 0.00% | 0 | 0.00% | 0 | 40.99% | 903 |
Perquimans | 69.06% | 645 | 30.84% | 288 | 0.00% | 0 | 0.11% | 1 | 38.22% | 357 |
Robeson | 66.57% | 2,894 | 33.43% | 1,453 | 0.00% | 0 | 0.00% | 0 | 33.15% | 1,441 |
Bladen | 65.95% | 1,261 | 34.05% | 651 | 0.00% | 0 | 0.00% | 0 | 31.90% | 610 |
Wake | 65.23% | 4,627 | 34.70% | 2,461 | 0.07% | 5 | 0.00% | 0 | 30.54% | 2,166 |
Cleveland | 64.87% | 2,764 | 35.13% | 1,497 | 0.00% | 0 | 0.00% | 0 | 29.73% | 1,267 |
Lee | 64.78% | 1,054 | 35.22% | 573 | 0.00% | 0 | 0.00% | 0 | 29.56% | 481 |
Wayne | 64.40% | 2,625 | 35.48% | 1,446 | 0.07% | 3 | 0.05% | 2 | 28.93% | 1,179 |
Cumberland | 61.83% | 1,971 | 38.17% | 1,217 | 0.00% | 0 | 0.00% | 0 | 23.65% | 754 |
Columbus | 61.72% | 2,143 | 38.22% | 1,327 | 0.00% | 0 | 0.06% | 2 | 23.50% | 816 |
Iredell | 61.67% | 3,335 | 38.33% | 2,073 | 0.00% | 0 | 0.00% | 0 | 23.34% | 1,262 |
Haywood | 61.21% | 2,403 | 38.79% | 1,523 | 0.00% | 0 | 0.00% | 0 | 22.41% | 880 |
Beaufort | 60.55% | 1,957 | 39.42% | 1,274 | 0.00% | 0 | 0.03% | 1 | 21.13% | 683 |
Onslow | 60.27% | 1,197 | 39.53% | 785 | 0.00% | 0 | 0.20% | 4 | 20.75% | 412 |
Pamlico | 56.57% | 710 | 41.99% | 527 | 1.43% | 18 | 0.00% | 0 | 14.58% | 183 |
Durham | 57.28% | 2,463 | 42.72% | 1,837 | 0.00% | 0 | 0.00% | 0 | 14.56% | 626 |
Washington | 57.26% | 651 | 42.74% | 486 | 0.00% | 0 | 0.00% | 0 | 14.51% | 165 |
Rowan | 56.82% | 3,053 | 43.18% | 2,320 | 0.00% | 0 | 0.00% | 0 | 13.64% | 733 |
Rutherford | 56.65% | 2,445 | 43.35% | 1,871 | 0.00% | 0 | 0.00% | 0 | 13.30% | 574 |
Dare | 56.42% | 470 | 43.58% | 363 | 0.00% | 0 | 0.00% | 0 | 12.85% | 107 |
Moore | 55.57% | 1,337 | 43.52% | 1,047 | 0.91% | 22 | 0.00% | 0 | 12.05% | 290 |
Guilford | 55.41% | 4,616 | 44.06% | 3,670 | 0.53% | 44 | 0.00% | 0 | 11.36% | 946 |
Harnett | 55.29% | 1,992 | 44.49% | 1,603 | 0.22% | 8 | 0.00% | 0 | 10.80% | 389 |
Alleghany | 55.39% | 796 | 44.61% | 641 | 0.00% | 0 | 0.00% | 0 | 10.79% | 155 |
Chatham | 54.83% | 1,839 | 44.75% | 1,501 | 0.42% | 14 | 0.00% | 0 | 10.08% | 338 |
Johnston | 54.83% | 3,468 | 45.17% | 2,857 | 0.00% | 0 | 0.00% | 0 | 9.66% | 611 |
Duplin | 54.43% | 1,824 | 45.57% | 1,527 | 0.00% | 0 | 0.00% | 0 | 8.86% | 297 |
Gaston | 54.18% | 3,019 | 45.62% | 2,542 | 0.00% | 0 | 0.20% | 11 | 8.56% | 477 |
Rockingham | 54.20% | 2,316 | 45.80% | 1,957 | 0.00% | 0 | 0.00% | 0 | 8.40% | 359 |
Yancey | 54.06% | 1,273 | 45.94% | 1,082 | 0.00% | 0 | 0.00% | 0 | 8.11% | 191 |
Forsyth | 51.84% | 4,115 | 45.16% | 3,585 | 3.00% | 238 | 0.00% | 0 | 6.68% | 530 |
Lincoln | 52.47% | 1,521 | 47.22% | 1,369 | 0.28% | 8 | 0.03% | 1 | 5.24% | 152 |
Buncombe | 52.48% | 4,229 | 47.52% | 3,830 | 0.00% | 0 | 0.00% | 0 | 4.95% | 399 |
Burke | 52.37% | 1,621 | 47.63% | 1,474 | 0.00% | 0 | 0.00% | 0 | 4.75% | 147 |
Stanly | 51.97% | 2,110 | 47.81% | 1,941 | 0.12% | 5 | 0.10% | 4 | 4.16% | 169 |
Alamance | 52.03% | 2,476 | 47.87% | 2,278 | 0.11% | 5 | 0.00% | 0 | 4.16% | 198 |
Macon | 51.74% | 1,146 | 48.26% | 1,069 | 0.00% | 0 | 0.00% | 0 | 3.48% | 77 |
Orange | 51.51% | 1,230 | 48.49% | 1,158 | 0.00% | 0 | 0.00% | 0 | 3.02% | 72 |
Tyrrell | 51.49% | 416 | 48.51% | 392 | 0.00% | 0 | 0.00% | 0 | 2.97% | 24 |
McDowell | 51.08% | 1,274 | 48.84% | 1,218 | 0.00% | 0 | 0.08% | 2 | 2.25% | 56 |
Caldwell | 50.98% | 1,725 | 49.02% | 1,659 | 0.00% | 0 | 0.00% | 0 | 1.95% | 66 |
Person | 50.96% | 953 | 49.04% | 917 | 0.00% | 0 | 0.00% | 0 | 1.93% | 36 |
Graham | 50.85% | 476 | 49.15% | 460 | 0.00% | 0 | 0.00% | 0 | 1.71% | 16 |
Montgomery | 50.54% | 1,222 | 49.46% | 1,196 | 0.00% | 0 | 0.00% | 0 | 1.08% | 26 |
Jackson | 50.35% | 1,306 | 49.65% | 1,288 | 0.00% | 0 | 0.00% | 0 | 0.69% | 18 |
Cherokee | 50.00% | 1,362 | 50.00% | 1,362 | 0.00% | 0 | 0.00% | 0 | 0.00% | 0 |
Catawba | 49.34% | 2,569 | 50.39% | 2,624 | 0.08% | 4 | 0.19% | 10 | -1.06% | -55 |
Ashe | 49.47% | 1,898 | 50.53% | 1,939 | 0.00% | 0 | 0.00% | 0 | -1.07% | -41 |
Transylvania | 49.40% | 821 | 50.60% | 841 | 0.00% | 0 | 0.00% | 0 | -1.20% | -20 |
Davidson | 48.74% | 2,675 | 51.04% | 2,801 | 0.22% | 12 | 0.00% | 0 | -2.30% | -126 |
Carteret | 48.32% | 1,165 | 51.68% | 1,246 | 0.00% | 0 | 0.00% | 0 | -3.36% | -81 |
Randolph | 47.52% | 2,747 | 52.43% | 3,031 | 0.00% | 0 | 0.05% | 3 | -4.91% | -284 |
Polk | 47.48% | 679 | 52.45% | 750 | 0.07% | 1 | 0.00% | 0 | -4.97% | -71 |
Cabarrus | 47.10% | 2,080 | 52.40% | 2,314 | 0.50% | 22 | 0.00% | 0 | -5.30% | -234 |
Clay | 46.89% | 400 | 53.11% | 453 | 0.00% | 0 | 0.00% | 0 | -6.21% | -53 |
Stokes | 45.58% | 1,569 | 53.81% | 1,852 | 0.61% | 21 | 0.00% | 0 | -8.22% | -283 |
Watauga | 45.77% | 1,141 | 54.23% | 1,352 | 0.00% | 0 | 0.00% | 0 | -8.46% | -211 |
Brunswick | 45.00% | 810 | 54.94% | 989 | 0.06% | 1 | 0.00% | 0 | -9.94% | -179 |
Alexander | 44.56% | 954 | 55.44% | 1,187 | 0.00% | 0 | 0.00% | 0 | -10.88% | -233 |
Swain | 42.36% | 829 | 57.64% | 1,128 | 0.00% | 0 | 0.00% | 0 | -15.28% | -299 |
Davie | 42.11% | 910 | 57.61% | 1,245 | 0.28% | 6 | 0.00% | 0 | -15.50% | -335 |
Surry | 40.43% | 2,029 | 59.33% | 2,977 | 0.24% | 12 | 0.00% | 0 | -18.89% | -948 |
Henderson | 39.38% | 1,166 | 60.62% | 1,795 | 0.00% | 0 | 0.00% | 0 | -21.24% | -629 |
Yadkin | 33.81% | 879 | 66.19% | 1,721 | 0.00% | 0 | 0.00% | 0 | -32.38% | -842 |
Sampson | 33.42% | 1,369 | 66.58% | 2,727 | 0.00% | 0 | 0.00% | 0 | -33.15% | -1,358 |
Madison | 33.09% | 972 | 66.91% | 1,965 | 0.00% | 0 | 0.00% | 0 | -33.81% | -993 |
Wilkes | 31.99% | 1,632 | 68.01% | 3,470 | 0.00% | 0 | 0.00% | 0 | -36.03% | -1,838 |
Mitchell | 26.25% | 462 | 73.75% | 1,298 | 0.00% | 0 | 0.00% | 0 | -47.50% | -836 |
Avery | 23.68% | 360 | 76.18% | 1,158 | 0.00% | 0 | 0.13% | 2 | -52.50% | -798 |
The 1920 United States presidential election in Alabama took place on November 2, 1920, as part of the 1920 general election, in which all 48 states participated. Alabama voters chose twelve electors to represent them in the Electoral College via popular vote pitting Democratic nominee James M. Cox and his running mate, Assistant Secretary of the Navy Franklin Roosevelt, against Republican challenger U.S. Senator Warren G. Harding and his running mate, Governor Calvin Coolidge.
The 1940 United States presidential election in Florida was held on November 5, 1940, as part of the concurrent United States presidential election. Florida voters chose seven electors, or representatives to the Electoral College, who voted for president and vice president.
The 1960 United States presidential election in North Carolina took place on November 8, 1960, as part of the 1960 United States presidential election. North Carolina voters chose 14 representatives, or electors, to the Electoral College, who voted for president and vice president.
The 1956 United States presidential election in North Carolina took place on November 6, 1956, as part of the 1956 United States presidential election. North Carolina voters chose 14 representatives, or electors, to the Electoral College, who voted for president and vice president.
The 1952 United States presidential election in North Carolina took place on November 4, 1952, as part of the 1952 United States presidential election. North Carolina voters chose 14 representatives, or electors, to the Electoral College, who voted for president and vice president.
The 1912 United States presidential election in Alabama took place on November 5, 1912, as part of the 1912 United States presidential election. Alabama voters chose twelve representatives, or electors, to the Electoral College, who voted for president and vice president.
The 1948 United States presidential election in North Carolina took place on November 2, 1948, as part of the 1948 United States presidential election. North Carolina voters chose 14 representatives, or electors, to the Electoral College, who voted for president and vice president.
The 1908 United States presidential election in Georgia took place on November 3, 1908, as part of the wider United States presidential election. Voters chose 13 representatives, or electors, to the Electoral College, who voted for president and vice president.
The 1900 United States presidential election in Georgia took place on November 6, 1900, as part of the wider United States presidential election. Voters chose 13 representatives, or electors, to the Electoral College, who voted for president and vice president.
The 1944 United States presidential election in Tennessee took place on November 7, 1944, as part of the 1944 United States presidential election. Tennessee voters chose 12 representatives, or electors, to the Electoral College, who voted for president and vice president.
The 1940 United States presidential election in North Carolina took place on November 5, 1940, as part of the 1940 United States presidential election. North Carolina voters chose 13 representatives, or electors, to the Electoral College, who voted for president and vice president.
The 1936 United States presidential election in Alabama took place on November 3, 1936, as part of the nationwide presidential election. Voters chose eleven representatives, or electors to the Electoral College, who voted for president and vice president. In Alabama, voters voted for electors individually instead of as a slate, as in the other states.
The 1936 United States presidential election in North Carolina took place on November 3, 1936, as part of the 1936 United States presidential election. North Carolina voters chose 13 representatives, or electors, to the Electoral College, who voted for president and vice president.
The 1932 United States presidential election in North Carolina took place on November 8, 1932, as part of the 1932 United States presidential election. North Carolina voters chose thirteen representatives, or electors, to the Electoral College, who voted for president and vice president.
The 1916 United States presidential election in Tennessee was held on November 7, 1916. Tennessee voters chose twelve representatives, or electors, to the Electoral College, who voted for president and vice president.
The 1924 United States presidential election in Alabama took place on November 4, 1924, as part of the nationwide presidential election, which was held throughout all contemporary forty-eight states. Voters chose twelve representatives, or electors, to the Electoral College, who voted for president and vice president.
The 1916 United States presidential election in Alabama took place on November 7, 1916, as part of the nationwide presidential election. State voters chose twelve representatives, or electors, to the Electoral College, who voted for president and vice president.
The 1924 United States presidential election in North Carolina took place on November 4, 1924, as part of the 1924 United States presidential election, which was held throughout all contemporary forty-eight states. Voters chose twelve representatives, or electors to the Electoral College, who voted for president and vice president.
The 1920 United States presidential election in North Carolina took place on November 2, 1920, as part of the 1920 United States presidential election, which was held throughout all contemporary forty-eight states. Voters chose twelve representatives, or electors to the Electoral College, who voted for president and vice president.
The 1916 United States presidential election in Kentucky took place on November 7, 1916, as part of the 1916 United States presidential election. Voters chose thirteen representatives, or electors to the Electoral College, who voted for president and vice president.