![]() | ||||||||||||||||||||||||||
| ||||||||||||||||||||||||||
| ||||||||||||||||||||||||||
![]() County Results
| ||||||||||||||||||||||||||
|
The 1916 United States presidential election in Virginia took place on November 7, 1916. Voters chose 12 representatives, or electors to the Electoral College, who voted for president and vice president.
The 1900s had seen Virginia, like all former Confederate States, almost completely disenfranchise its black and poor white populations through the use of a cumulative poll tax and literacy tests. [1] So severe was the disenfranchising effect of the new 1902 Constitution that the electorate for the 1904 presidential election was halved compared to that of previous elections, and it has been calculated that a third of those who voted were state employees and officeholders. [1]
This limited electorate meant Virginian politics was controlled by political machines based in Southside Virginia — firstly one led by Thomas Staples Martin and after he died the Byrd Organization. Progressive “antiorganization” factions were rendered impotent by the inability of almost all of their potential electorate to vote. [2] Unlike the Deep South, historical fusion with the “Readjuster” Democrats, [3] defection of substantial proportions of the Northeast-aligned white electorate of the Shenandoah Valley and Southwest Virginia over free silver, [4] and an early move towards a “lily white” Jim Crow party [3] meant that in general elections the Republicans retained around one-third of the small statewide electorate, [5] with the majority of GOP support located in the western part of the state. However, in many parts of the state — like in Tennessee during the same period — the parties avoided competition by an agreed division over local offices. [2]
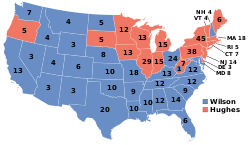
Unlike in 1908, neither major party campaigned in the state — which had voted Democratic in every election since 1876 — during the fall. A straw ballot taken early in September saw Democratic nominee and incumbent President Woodrow Wilson gaining seventy-nine votes to the Republican nominee, former U.S. Supreme Court Justice Charles E. Hughes’ six. [6] Later straw polls in October did not even include the state, and ultimate Virginia voted for Wilson by a slightly greater majority than he had won four years previously. Wilson ultimately won the national election with 49.24 percent of the vote.
Elections in Virginia |
---|
![]() |
1916 United States presidential election in Virginia [7] | |||||
---|---|---|---|---|---|
Party | Candidate | Votes | Percentage | Electoral votes | |
Democratic | Woodrow Wilson (inc.) | 102,824 | 66.77% | 12 | |
Republican | Charles E. Hughes | 49,356 | 32.05% | 0 | |
Socialist | Allan L. Benson | 1,062 | 0.69% | 0 | |
Prohibition | Frank Hanly | 683 | 0.45% | 0 | |
Socialist Labor | Arthur E. Reimer | 67 | 0.04% | 0 | |
Totals | 153,992 | 100.00% | 12 |
1916 United States presidential election in Virginia by counties and independent cities [8] | |||||||||||||
---|---|---|---|---|---|---|---|---|---|---|---|---|---|
County or Independent City | Thomas Woodrow Wilson Democratic | Charles Evans Hughes Republican | Allan Louis Benson Socialist | James Franklin Hanly Prohibition | Arthur Elmer Reimer Socialist Labor | Margin | Total votes cast | ||||||
# | % | # | % | # | % | # | % | # | % | # | % | ||
Accomack County | 1,745 | 84.30% | 299 | 14.44% | 0 | 0.00% | 26 | 1.26% | 0 | 0.00% | 1,446 | 69.86% | 2,070 |
Albemarle County | 1,376 | 86.05% | 223 | 13.95% | 0 | 0.00% | 0 | 0.00% | 0 | 0.00% | 1,153 | 72.11% | 1,599 |
Alexandria County | 515 | 54.21% | 412 | 43.37% | 14 | 1.47% | 8 | 0.84% | 1 | 0.11% | 103 | 10.84% | 950 |
Alleghany County | 544 | 54.78% | 432 | 43.50% | 3 | 0.30% | 14 | 1.41% | 0 | 0.00% | 112 | 11.28% | 993 |
Amelia County | 403 | 82.58% | 80 | 16.39% | 1 | 0.20% | 3 | 0.61% | 1 | 0.20% | 323 | 66.19% | 488 |
Amherst County | 1,142 | 91.58% | 93 | 7.46% | 10 | 0.80% | 1 | 0.08% | 1 | 0.08% | 1,049 | 84.12% | 1,247 |
Appomattox County | 700 | 83.73% | 133 | 15.91% | 2 | 0.24% | 0 | 0.00% | 1 | 0.12% | 567 | 67.82% | 836 |
Augusta County | 1,751 | 66.23% | 845 | 31.96% | 8 | 0.30% | 40 | 1.51% | 0 | 0.00% | 906 | 34.27% | 2,644 |
Bath County | 387 | 63.24% | 219 | 35.78% | 0 | 0.00% | 6 | 0.98% | 0 | 0.00% | 168 | 27.45% | 612 |
Bedford County | 1,628 | 84.05% | 298 | 15.38% | 7 | 0.36% | 4 | 0.21% | 0 | 0.00% | 1,330 | 68.66% | 1,937 |
Bland County | 356 | 45.64% | 420 | 53.85% | 0 | 0.00% | 4 | 0.51% | 0 | 0.00% | -64 | -8.21% | 780 |
Botetourt County | 900 | 53.22% | 775 | 45.83% | 2 | 0.12% | 13 | 0.77% | 1 | 0.06% | 125 | 7.39% | 1,691 |
Brunswick County | 772 | 90.40% | 82 | 9.60% | 0 | 0.00% | 0 | 0.00% | 0 | 0.00% | 690 | 80.80% | 854 |
Buchanan County | 720 | 46.33% | 827 | 53.22% | 1 | 0.06% | 3 | 0.19% | 3 | 0.19% | -107 | -6.89% | 1,554 |
Buckingham County | 625 | 76.78% | 181 | 22.24% | 7 | 0.86% | 1 | 0.12% | 0 | 0.00% | 444 | 54.55% | 814 |
Campbell County | 1,007 | 79.60% | 185 | 14.62% | 67 | 5.30% | 6 | 0.47% | 0 | 0.00% | 822 | 64.98% | 1,265 |
Caroline County | 637 | 75.83% | 198 | 23.57% | 0 | 0.00% | 4 | 0.48% | 1 | 0.12% | 439 | 52.26% | 840 |
Carroll County | 858 | 37.60% | 1,424 | 62.40% | 0 | 0.00% | 0 | 0.00% | 0 | 0.00% | -566 | -24.80% | 2,282 |
Charles City County | 139 | 70.56% | 57 | 28.93% | 0 | 0.00% | 1 | 0.51% | 0 | 0.00% | 82 | 41.62% | 197 |
Charlotte County | 856 | 78.39% | 227 | 20.79% | 9 | 0.82% | 0 | 0.00% | 0 | 0.00% | 629 | 57.60% | 1,092 |
Chesterfield County | 699 | 81.47% | 141 | 16.43% | 10 | 1.17% | 8 | 0.93% | 0 | 0.00% | 558 | 65.03% | 858 |
Clarke County | 590 | 92.19% | 49 | 7.66% | 0 | 0.00% | 1 | 0.16% | 0 | 0.00% | 541 | 84.53% | 640 |
Craig County | 369 | 64.62% | 200 | 35.03% | 2 | 0.35% | 0 | 0.00% | 0 | 0.00% | 169 | 29.60% | 571 |
Culpeper County | 849 | 81.79% | 184 | 17.73% | 1 | 0.10% | 4 | 0.39% | 0 | 0.00% | 665 | 64.07% | 1,038 |
Cumberland County | 446 | 85.93% | 73 | 14.07% | 0 | 0.00% | 0 | 0.00% | 0 | 0.00% | 373 | 71.87% | 519 |
Dickenson County | 650 | 45.42% | 753 | 52.62% | 27 | 1.89% | 1 | 0.07% | 0 | 0.00% | -103 | -7.20% | 1,431 |
Dinwiddie County | 592 | 87.32% | 85 | 12.54% | 0 | 0.00% | 1 | 0.15% | 0 | 0.00% | 507 | 74.78% | 678 |
Elizabeth City County | 411 | 73.39% | 132 | 23.57% | 10 | 1.79% | 5 | 0.89% | 2 | 0.36% | 279 | 49.82% | 560 |
Essex County | 302 | 79.68% | 77 | 20.32% | 0 | 0.00% | 0 | 0.00% | 0 | 0.00% | 225 | 59.37% | 379 |
Fairfax County | 1,179 | 70.77% | 472 | 28.33% | 5 | 0.30% | 10 | 0.60% | 0 | 0.00% | 707 | 42.44% | 1,666 |
Fauquier County | 1,204 | 76.49% | 367 | 23.32% | 2 | 0.13% | 1 | 0.06% | 0 | 0.00% | 837 | 53.18% | 1,574 |
Floyd County [lower-alpha 1] | 472 | 34.58% | 893 | 65.42% | 0 | 0.00% | 0 | 0.00% | 0 | 0.00% | -421 | -30.84% | 1,365 |
Fluvanna County [lower-alpha 1] | 513 | 86.36% | 81 | 13.64% | 0 | 0.00% | 0 | 0.00% | 0 | 0.00% | 432 | 72.73% | 594 |
Franklin County | 1,481 | 57.36% | 1,094 | 42.37% | 6 | 0.23% | 1 | 0.04% | 0 | 0.00% | 387 | 14.99% | 2,582 |
Frederick County | 1,194 | 75.52% | 366 | 23.15% | 11 | 0.70% | 10 | 0.63% | 0 | 0.00% | 828 | 52.37% | 1,581 |
Giles County | 839 | 58.26% | 596 | 41.39% | 2 | 0.14% | 2 | 0.14% | 1 | 0.07% | 243 | 16.88% | 1,440 |
Gloucester County | 582 | 80.17% | 142 | 19.56% | 0 | 0.00% | 0 | 0.00% | 2 | 0.28% | 440 | 60.61% | 726 |
Goochland County | 413 | 67.59% | 193 | 31.59% | 5 | 0.82% | 0 | 0.00% | 0 | 0.00% | 220 | 36.01% | 611 |
Grayson County | 967 | 43.66% | 1,244 | 56.16% | 2 | 0.09% | 1 | 0.05% | 1 | 0.05% | -277 | -12.51% | 2,215 |
Greene County | 221 | 48.04% | 239 | 51.96% | 0 | 0.00% | 0 | 0.00% | 0 | 0.00% | -18 | -3.91% | 460 |
Greensville County | 392 | 83.40% | 76 | 16.17% | 0 | 0.00% | 2 | 0.43% | 0 | 0.00% | 316 | 67.23% | 470 |
Halifax County | 1,781 | 77.74% | 493 | 21.52% | 15 | 0.65% | 2 | 0.09% | 0 | 0.00% | 1,288 | 56.22% | 2,291 |
Hanover County | 760 | 86.96% | 102 | 11.67% | 7 | 0.80% | 5 | 0.57% | 0 | 0.00% | 658 | 75.29% | 874 |
Henrico County | 690 | 81.18% | 140 | 16.47% | 15 | 1.76% | 1 | 0.12% | 4 | 0.47% | 550 | 64.71% | 850 |
Henry County | 851 | 59.55% | 567 | 39.68% | 6 | 0.42% | 5 | 0.35% | 0 | 0.00% | 284 | 19.87% | 1,429 |
Highland County | 370 | 54.17% | 310 | 45.39% | 0 | 0.00% | 3 | 0.44% | 0 | 0.00% | 60 | 8.78% | 683 |
Isle of Wight County | 679 | 82.80% | 140 | 17.07% | 0 | 0.00% | 1 | 0.12% | 0 | 0.00% | 539 | 65.73% | 820 |
James City County | 127 | 77.91% | 34 | 20.86% | 0 | 0.00% | 2 | 1.23% | 0 | 0.00% | 93 | 57.06% | 163 |
King and Queen County | 271 | 68.09% | 127 | 31.91% | 0 | 0.00% | 0 | 0.00% | 0 | 0.00% | 144 | 36.18% | 398 |
King George County | 223 | 50.34% | 217 | 48.98% | 1 | 0.23% | 2 | 0.45% | 0 | 0.00% | 6 | 1.35% | 443 |
King William County | 342 | 74.19% | 119 | 25.81% | 0 | 0.00% | 0 | 0.00% | 0 | 0.00% | 223 | 48.37% | 461 |
Lancaster County | 461 | 88.31% | 58 | 11.11% | 0 | 0.00% | 3 | 0.57% | 0 | 0.00% | 403 | 77.20% | 522 |
Lee County | 1,287 | 44.86% | 1,569 | 54.69% | 11 | 0.38% | 1 | 0.03% | 1 | 0.03% | -282 | -9.83% | 2,869 |
Loudoun County | 1,490 | 77.52% | 404 | 21.02% | 2 | 0.10% | 26 | 1.35% | 0 | 0.00% | 1,086 | 56.50% | 1,922 |
Louisa County | 710 | 72.08% | 263 | 26.70% | 8 | 0.81% | 4 | 0.41% | 0 | 0.00% | 447 | 45.38% | 985 |
Lunenburg County | 814 | 86.87% | 110 | 11.74% | 12 | 1.28% | 0 | 0.00% | 1 | 0.11% | 704 | 75.13% | 937 |
Madison County | 572 | 61.64% | 348 | 37.50% | 0 | 0.00% | 7 | 0.75% | 1 | 0.11% | 224 | 24.14% | 928 |
Mathews County | 549 | 83.94% | 90 | 13.76% | 0 | 0.00% | 15 | 2.29% | 0 | 0.00% | 459 | 70.18% | 654 |
Mecklenburg County | 1,317 | 85.30% | 222 | 14.38% | 0 | 0.00% | 5 | 0.32% | 0 | 0.00% | 1,095 | 70.92% | 1,544 |
Middlesex County | 373 | 70.64% | 155 | 29.36% | 0 | 0.00% | 0 | 0.00% | 0 | 0.00% | 218 | 41.29% | 528 |
Montgomery County | 765 | 45.89% | 891 | 53.45% | 1 | 0.06% | 10 | 0.60% | 0 | 0.00% | -126 | -7.56% | 1,667 |
Nansemond County | 663 | 90.45% | 70 | 9.55% | 0 | 0.00% | 0 | 0.00% | 0 | 0.00% | 593 | 80.90% | 733 |
Nelson County | 1,063 | 81.02% | 249 | 18.98% | 0 | 0.00% | 0 | 0.00% | 0 | 0.00% | 814 | 62.04% | 1,312 |
New Kent County | 192 | 72.73% | 69 | 26.14% | 1 | 0.38% | 2 | 0.76% | 0 | 0.00% | 123 | 46.59% | 264 |
Norfolk County | 1,612 | 68.98% | 684 | 29.27% | 19 | 0.81% | 8 | 0.34% | 14 | 0.60% | 928 | 39.71% | 2,337 |
Northampton County | 802 | 87.17% | 109 | 11.85% | 0 | 0.00% | 9 | 0.98% | 0 | 0.00% | 693 | 75.33% | 920 |
Northumberland County | 503 | 81.52% | 111 | 17.99% | 0 | 0.00% | 3 | 0.49% | 0 | 0.00% | 392 | 63.53% | 617 |
Nottoway County | 608 | 85.88% | 91 | 12.85% | 4 | 0.56% | 5 | 0.71% | 0 | 0.00% | 517 | 73.02% | 708 |
Orange County | 608 | 79.58% | 153 | 20.03% | 1 | 0.13% | 1 | 0.13% | 1 | 0.13% | 455 | 59.55% | 764 |
Page County | 842 | 57.01% | 613 | 41.50% | 4 | 0.27% | 17 | 1.15% | 1 | 0.07% | 229 | 15.50% | 1,477 |
Patrick County | 872 | 51.60% | 815 | 48.22% | 1 | 0.06% | 2 | 0.12% | 0 | 0.00% | 57 | 3.37% | 1,690 |
Pittsylvania County | 2,012 | 70.52% | 801 | 28.08% | 30 | 1.05% | 10 | 0.35% | 0 | 0.00% | 1,211 | 42.45% | 2,853 |
Powhatan County | 233 | 67.34% | 112 | 32.37% | 1 | 0.29% | 0 | 0.00% | 0 | 0.00% | 121 | 34.97% | 346 |
Prince Edward County | 668 | 86.08% | 108 | 13.92% | 0 | 0.00% | 0 | 0.00% | 0 | 0.00% | 560 | 72.16% | 776 |
Prince George County | 258 | 77.95% | 72 | 21.75% | 1 | 0.30% | 0 | 0.00% | 0 | 0.00% | 186 | 56.19% | 331 |
Prince William County | 754 | 79.37% | 192 | 20.21% | 2 | 0.21% | 2 | 0.21% | 0 | 0.00% | 562 | 59.16% | 950 |
Princess Anne County | 515 | 88.34% | 67 | 11.49% | 0 | 0.00% | 1 | 0.17% | 0 | 0.00% | 448 | 76.84% | 583 |
Pulaski County | 1,057 | 56.71% | 721 | 38.68% | 0 | 0.00% | 86 | 4.61% | 0 | 0.00% | 336 | 18.03% | 1,864 |
Rappahannock County | 401 | 81.50% | 84 | 17.07% | 7 | 1.42% | 0 | 0.00% | 0 | 0.00% | 317 | 64.43% | 492 |
Richmond County | 329 | 64.64% | 180 | 35.36% | 0 | 0.00% | 0 | 0.00% | 0 | 0.00% | 149 | 29.27% | 509 |
Roanoke County | 850 | 63.24% | 460 | 34.23% | 26 | 1.93% | 8 | 0.60% | 0 | 0.00% | 390 | 29.02% | 1,344 |
Rockbridge County | 1,049 | 63.15% | 601 | 36.18% | 6 | 0.36% | 5 | 0.30% | 0 | 0.00% | 448 | 26.97% | 1,661 |
Rockingham County | 1,650 | 54.78% | 1,322 | 43.89% | 15 | 0.50% | 25 | 0.83% | 0 | 0.00% | 328 | 10.89% | 3,012 |
Russell County | 1,570 | 52.49% | 1,410 | 47.14% | 4 | 0.13% | 4 | 0.13% | 3 | 0.10% | 160 | 5.35% | 2,991 |
Scott County | 1,319 | 42.87% | 1,743 | 56.65% | 13 | 0.42% | 1 | 0.03% | 1 | 0.03% | -424 | -13.78% | 3,077 |
Shenandoah County | 1,440 | 49.21% | 1,425 | 48.70% | 37 | 1.26% | 24 | 0.82% | 0 | 0.00% | 15 | 0.51% | 2,926 |
Smyth County | 1,134 | 46.04% | 1,321 | 53.63% | 5 | 0.20% | 2 | 0.08% | 1 | 0.04% | -187 | -7.59% | 2,463 |
Southampton County | 1,045 | 89.09% | 128 | 10.91% | 0 | 0.00% | 0 | 0.00% | 0 | 0.00% | 917 | 78.18% | 1,173 |
Spotsylvania County | 398 | 61.33% | 249 | 38.37% | 0 | 0.00% | 2 | 0.31% | 0 | 0.00% | 149 | 22.96% | 649 |
Stafford County | 444 | 51.15% | 422 | 48.62% | 0 | 0.00% | 2 | 0.23% | 0 | 0.00% | 22 | 2.53% | 868 |
Surry County | 430 | 81.59% | 90 | 17.08% | 4 | 0.76% | 3 | 0.57% | 0 | 0.00% | 340 | 64.52% | 527 |
Sussex County | 486 | 82.79% | 96 | 16.35% | 2 | 0.34% | 3 | 0.51% | 0 | 0.00% | 390 | 66.44% | 587 |
Tazewell County | 1,108 | 40.74% | 1,591 | 58.49% | 11 | 0.40% | 10 | 0.37% | 0 | 0.00% | -483 | -17.76% | 2,720 |
Warren County | 583 | 72.24% | 214 | 26.52% | 0 | 0.00% | 10 | 1.24% | 0 | 0.00% | 369 | 45.72% | 807 |
Warwick County | 97 | 64.67% | 53 | 35.33% | 0 | 0.00% | 0 | 0.00% | 0 | 0.00% | 44 | 29.33% | 150 |
Washington County | 1,863 | 51.91% | 1,717 | 47.84% | 2 | 0.06% | 7 | 0.20% | 0 | 0.00% | 146 | 4.07% | 3,589 |
Westmoreland County | 338 | 72.69% | 126 | 27.10% | 1 | 0.22% | 0 | 0.00% | 0 | 0.00% | 212 | 45.59% | 465 |
Wise County | 1,468 | 43.63% | 1,862 | 55.33% | 33 | 0.98% | 1 | 0.03% | 1 | 0.03% | -394 | -11.71% | 3,365 |
Wythe County | 1,334 | 49.23% | 1,370 | 50.55% | 2 | 0.07% | 2 | 0.07% | 2 | 0.07% | -36 | -1.33% | 2,710 |
York County | 247 | 82.89% | 51 | 17.11% | 0 | 0.00% | 0 | 0.00% | 0 | 0.00% | 196 | 65.77% | 298 |
Alexandria City | 1,038 | 73.51% | 364 | 25.78% | 6 | 0.42% | 3 | 0.00% | 1 | 0.07% | 674 | 47.73% | 1,412 |
Bristol City | 489 | 72.23% | 184 | 27.18% | 3 | 0.44% | 1 | 0.60% | 0 | 0.00% | 305 | 45.05% | 677 |
Buena Vista City | 158 | 62.70% | 92 | 36.51% | 0 | 0.00% | 2 | 0.30% | 0 | 0.00% | 66 | 26.19% | 252 |
Charlottesville City | 618 | 83.63% | 117 | 15.83% | 3 | 0.41% | 1 | 0.83% | 0 | 0.00% | 501 | 67.79% | 739 |
Clifton Forge City | 455 | 74.35% | 104 | 16.99% | 48 | 7.84% | 5 | 0.13% | 0 | 0.00% | 351 | 57.35% | 612 |
Danville City | 1,151 | 76.99% | 229 | 15.32% | 107 | 7.16% | 7 | 0.03% | 1 | 0.07% | 922 | 61.67% | 1,495 |
Fredericksburg City | 380 | 68.59% | 173 | 31.23% | 0 | 0.00% | 1 | 0.82% | 0 | 0.00% | 207 | 37.36% | 554 |
Hampton City | 350 | 85.37% | 56 | 13.66% | 3 | 0.73% | 1 | 0.08% | 0 | 0.00% | 294 | 71.71% | 410 |
Harrisonburg City | 346 | 51.64% | 319 | 47.61% | 4 | 0.60% | 1 | 0.00% | 0 | 0.00% | 27 | 4.03% | 670 |
Hopewell City | 24 | 85.71% | 3 | 10.71% | 1 | 3.57% | 0 | 0.31% | 0 | 0.00% | 21 | 75.00% | 28 |
Lynchburg City | 1,465 | 79.53% | 353 | 19.16% | 16 | 0.87% | 8 | 0.23% | 0 | 0.00% | 1,112 | 60.37% | 1,842 |
Newport News City | 939 | 64.10% | 465 | 31.74% | 52 | 3.55% | 5 | 0.57% | 4 | 0.27% | 474 | 32.35% | 1,465 |
Norfolk City | 3,234 | 75.35% | 963 | 22.44% | 72 | 1.68% | 23 | 0.51% | 0 | 0.00% | 2,271 | 52.91% | 4,292 |
Petersburg City | 1,155 | 87.04% | 161 | 12.13% | 3 | 0.23% | 7 | 0.37% | 1 | 0.08% | 994 | 74.91% | 1,327 |
Portsmouth City | 1,368 | 75.54% | 376 | 20.76% | 52 | 2.87% | 13 | 1.24% | 2 | 0.11% | 992 | 54.78% | 1,811 |
Radford City | 206 | 63.00% | 115 | 35.17% | 5 | 1.53% | 1 | 0.00% | 0 | 0.00% | 91 | 27.83% | 327 |
Richmond City | 6,987 | 84.15% | 1,210 | 14.57% | 76 | 0.92% | 24 | 0.20% | 6 | 0.07% | 5,777 | 69.58% | 8,303 |
Roanoke City | 2,246 | 76.14% | 610 | 20.68% | 78 | 2.64% | 10 | 0.00% | 6 | 0.20% | 1,636 | 55.46% | 2,950 |
Staunton City | 511 | 61.34% | 311 | 37.33% | 0 | 0.00% | 11 | 0.03% | 0 | 0.00% | 200 | 24.01% | 833 |
Suffolk City | 437 | 72.35% | 158 | 26.16% | 1 | 0.17% | 8 | 0.07% | 0 | 0.00% | 279 | 46.19% | 604 |
Williamsburg City | 97 | 82.20% | 21 | 17.80% | 0 | 0.00% | 0 | 0.00% | 0 | 0.00% | 76 | 64.41% | 118 |
Winchester City | 468 | 68.42% | 196 | 28.65% | 2 | 0.29% | 18 | 2.63% | 0 | 0.00% | 272 | 39.77% | 684 |
Totals | 102,825 | 66.78% | 49,358 | 32.05% | 1,062 | 0.69% | 683 | 0.44% | 67 | 0.04% | 53,467 | 34.72% | 153,984 |
The 1960 United States presidential election in Virginia took place on November 8, 1960. Voters chose 12 representatives, or electors to the Electoral College, who voted for president and vice president.
The 1964 United States presidential election in Virginia took place on November 3, 1964. All 50 states and the District of Columbia were part of the 1964 United States presidential election. Virginia voters chose 12 electors to the Electoral College, which selected the president and vice president of the United States.
The 1956 United States presidential election in Virginia took place on November 6, 1956. Voters chose twelve representatives, or electors to the Electoral College, who voted for president and vice president. For the previous five decades Virginia had almost completely disenfranchised its black and poor white populations through the use of a cumulative poll tax and literacy tests. So restricted was suffrage in this period that it has been calculated that a third of Virginia's electorate during the first half of the twentieth century comprised state employees and officeholders.
The 1952 United States presidential election in Virginia took place on November 4, 1952. Voters chose twelve representatives, or electors to the Electoral College, who voted for president and vice president.
The 1948 United States presidential election in Virginia took place on November 2, 1948, throughout the 48 contiguous states. Voters chose 11 representatives, or electors to the Electoral College, who voted for president and vice president.
The 1932 United States presidential election in Virginia took place on November 8, 1932. Voters chose eleven representatives, or electors to the Electoral College, who voted for president and vice president.
The 1928 United States presidential election in Virginia took place on November 6, 1928. Voters chose 12 representatives, or electors to the Electoral College, who voted for president and vice president.
The 1924 United States presidential election in Virginia took place on November 4, 1924. Voters chose 12 representatives, or electors to the Electoral College, who voted for president and vice president.
The 1920 United States presidential election in Virginia took place on November 2, 1920. Voters chose twelve representatives, or electors to the Electoral College, who voted for president and vice president. This was also the first presidential election after the passage of the Nineteenth Amendment, which granted women the right to vote throughout the United States, including Virginia.
The 1912 United States presidential election in Virginia took place on November 5, 1912. Voters chose 12 representatives, or electors to the Electoral College, who voted for president and vice president.
The 1904 United States presidential election in Virginia took place on November 8, 1904, as part of the 1904 United States presidential election. Voters chose 12 representatives, or electors to the Electoral College, who voted for president and vice president.
The 1908 United States presidential election in Virginia took place on November 3, 1908, as part of the 1908 United States presidential election. Voters chose twelve representatives, or electors to the Electoral College, who voted for president and vice president.
The 1956 United States presidential election in Mississippi was held on November 6, 1956. Mississippi voters chose eight representatives, or electors to the Electoral College, who voted for president and vice president.
The 1924 United States presidential election in Texas took place on November 4, 1924, as part of the 1924 United States presidential election. State voters chose 20 representatives, or electors, to the Electoral College, who voted for president and vice president.
The 1908 United States presidential election in Georgia took place on November 3, 1908, as part of the wider United States presidential election. Voters chose 13 representatives, or electors, to the Electoral College, who voted for president and vice president.
The 1900 United States presidential election in Georgia took place on November 6, 1900, as part of the wider United States presidential election. Voters chose 13 representatives, or electors, to the Electoral College, who voted for president and vice president.
The 1896 United States presidential election in Georgia took place on November 3, 1896, as part of the wider United States presidential election. Voters chose 13 representatives, or electors, to the Electoral College, who voted for president and vice president.
The 1924 United States presidential election in North Carolina took place on November 4, 1924, as part of the 1924 United States presidential election, which was held throughout all contemporary forty-eight states. Voters chose twelve representatives, or electors to the Electoral College, who voted for president and vice president.
The 1920 United States presidential election in North Carolina took place on November 2, 1920, as part of the 1920 United States presidential election, which was held throughout all contemporary forty-eight states. Voters chose twelve representatives, or electors to the Electoral College, who voted for president and vice president.
The 1920 United States presidential election in Maryland took place on November 2, 1920, as part of the 1920 United States presidential election which was held throughout all contemporary 48 states. Voters chose eight representatives, or electors to the Electoral College, who voted for president and vice president.