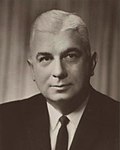
1961 Virginia gubernatorial election Last updated November 15, 2025 Campaign By May Stephens had become strongly opposed to its longstanding policies and was campaigning vigorously against Organization nominee Harrison, [ 5] aided by financial support from former councillor and current State Highway Commission member Walter Chinn. [ 6] Harrison would consistently criticize Stephens for "intemperate" criticism of the Byrd Organization. [ 7]
Although "Massive Resistance " had been ended by outgoing Governor Almond in 1959, [ 8] education remained the major issue for all campaigns from the first primaries in June. [ 9] Stephens would lose the July 11 primary by thirteen percentage points [ 10] – significantly smaller than previous antiorganization candidates.
Campaigning was described by the press as "mild", [ 11] and predictions – ultimately fulfilled – expected turnout to be less than forty percent of the state's approximately one million registered voters. [ 12]
Democratic primary Candidates Primary results by county and independent city 1961 Virginia gubernatorial Democratic primary by county or independent city [ 10] Albertis Sydney Harrison jr. Allie Edward Stakes Stephens Margin Total votes cast # % # % # % Accomack County 2,968 66.83% 1,473 33.17% 1,495 33.66% 4,441 Albemarle County 1,529 65.71% 798 34.29% 731 31.41% 2,327 Alleghany County 436 61.67% 271 38.33% 165 23.34% 707 Amelia County 841 78.16% 235 21.84% 606 56.32% 1,076 Amherst County 1,611 69.65% 702 30.35% 909 39.30% 2,313 Appomattox County 1,608 88.06% 218 11.94% 1,390 76.12% 1,826 Arlington County 4,641 34.01% 9,004 65.99% -4,363 -31.98% 13,645 Augusta County 1,283 74.85% 431 25.15% 852 49.71% 1,714 Bath County 225 74.01% 79 25.99% 146 48.03% 304 Bedford County 2,520 61.92% 1,550 38.08% 970 23.83% 4,070 Bland County 314 52.51% 284 47.49% 30 5.02% 598 Botetourt County 430 43.79% 552 56.21% -122 -12.42% 982 Brunswick County 2,537 86.59% 393 13.41% 2,144 73.17% 2,930 Buchanan County 340 21.04% 1,276 78.96% -936 -57.92% 1,616 Buckingham County 1,085 80.79% 258 19.21% 827 61.58% 1,343 Campbell County 1,518 71.54% 604 28.46% 914 43.07% 2,122 Caroline County 688 70.78% 284 29.22% 404 41.56% 972 Carroll County 217 21.81% 778 78.19% -561 -56.38% 995 Charles City County 137 34.00% 266 66.00% -129 -32.01% 403 Charlotte County 1,344 84.26% 251 15.74% 1,093 68.53% 1,595 Chesterfield County 4,751 74.11% 1,660 25.89% 3,091 48.21% 6,411 Clarke County 850 65.69% 444 34.31% 406 31.38% 1,294 Craig County 111 39.36% 171 60.64% -60 -21.28% 282 Culpeper County 1,417 70.15% 603 29.85% 814 40.30% 2,020 Cumberland County 562 74.63% 191 25.37% 371 49.27% 753 Dickenson County 69 5.13% 1,277 94.87% -1,208 -89.75% 1,346 Dinwiddie County 1,390 78.27% 386 21.73% 1,004 56.53% 1,776 Essex County 454 71.16% 184 28.84% 270 42.32% 638 Fairfax County 4,932 30.15% 11,427 69.85% -6,495 -39.70% 16,359 Fauquier County 1,827 62.78% 1,083 37.22% 744 25.57% 2,910 Floyd County 56 15.34% 309 84.66% -253 -69.32% 365 Fluvanna County 378 74.26% 131 25.74% 247 48.53% 509 Franklin County 1,224 48.78% 1,285 51.22% -61 -2.43% 2,509 Frederick County 1,378 69.35% 609 30.65% 769 38.70% 1,987 Giles County 579 47.30% 645 52.70% -66 -5.39% 1,224 Gloucester County 756 63.53% 434 36.47% 322 27.06% 1,190 Goochland County 841 78.60% 229 21.40% 612 57.20% 1,070 Grayson County 307 24.98% 922 75.02% -615 -50.04% 1,229 Greene County 87 49.15% 90 50.85% -3 -1.69% 177 Greensville County 1,843 80.45% 448 19.55% 1,395 60.89% 2,291 Halifax County 2,091 84.97% 370 15.03% 1,721 69.93% 2,461 Hanover County 2,784 76.78% 842 23.22% 1,942 53.56% 3,626 Henrico County 10,861 76.60% 3,318 23.40% 7,543 53.20% 14,179 Henry County 1,114 57.07% 838 42.93% 276 14.14% 1,952 Highland County 157 75.48% 51 24.52% 106 50.96% 208 Isle of Wight County 859 32.61% 1,775 67.39% -916 -34.78% 2,634 James City County 355 48.56% 376 51.44% -21 -2.87% 731 King and Queen County 269 65.77% 140 34.23% 129 31.54% 409 King George County 314 66.24% 160 33.76% 154 32.49% 474 King William County 706 72.56% 267 27.44% 439 45.12% 973 Lancaster County 820 60.25% 541 39.75% 279 20.50% 1,361 Lee County 234 15.48% 1,278 84.52% -1,044 -69.05% 1,512 Loudoun County 1,434 65.39% 759 34.61% 675 30.78% 2,193 Louisa County 1,089 81.76% 243 18.24% 846 63.51% 1,332 Lunenburg County 1,635 86.65% 252 13.35% 1,383 73.29% 1,887 Madison County 396 79.68% 101 20.32% 295 59.36% 497 Mathews County 525 73.53% 189 26.47% 336 47.06% 714 Mecklenburg County 2,926 89.62% 339 10.38% 2,587 79.23% 3,265 Middlesex County 524 65.83% 272 34.17% 252 31.66% 796 Montgomery County 539 31.71% 1,161 68.29% -622 -36.59% 1,700 Nansemond County 2,112 50.47% 2,073 49.53% 39 0.93% 4,185 Nelson County 946 66.62% 474 33.38% 472 33.24% 1,420 New Kent County 272 67.66% 130 32.34% 142 35.32% 402 Norfolk County 2,480 58.99% 1,724 41.01% 756 17.98% 4,204 Northampton County 1,309 82.85% 271 17.15% 1,038 65.70% 1,580 Northumberland County 666 63.49% 383 36.51% 283 26.98% 1,049 Nottoway County 1,703 77.55% 493 22.45% 1,210 55.10% 2,196 Orange County 752 70.61% 313 29.39% 439 41.22% 1,065 Page County 873 74.62% 297 25.38% 576 49.23% 1,170 Patrick County 848 57.65% 623 42.35% 225 15.30% 1,471 Pittsylvania County 4,414 78.68% 1,196 21.32% 3,218 57.36% 5,610 Powhatan County 450 67.98% 212 32.02% 238 35.95% 662 Prince Edward County 2,129 79.23% 558 20.77% 1,571 58.47% 2,687 Prince George County 756 76.60% 231 23.40% 525 53.19% 987 Prince William County 1,294 61.01% 827 38.99% 467 22.02% 2,121 Princess Anne County 4,019 73.66% 1,437 26.34% 2,582 47.32% 5,456 Pulaski County 866 49.66% 878 50.34% -12 -0.69% 1,744 Rappahannock County 435 76.05% 137 23.95% 298 52.10% 572 Richmond County 492 71.72% 194 28.28% 298 43.44% 686 Roanoke County 1,529 53.99% 1,303 46.01% 226 7.98% 2,832 Rockbridge County 1,189 67.29% 578 32.71% 611 34.58% 1,767 Rockingham County 776 64.56% 426 35.44% 350 29.12% 1,202 Russell County 406 24.22% 1,270 75.78% -864 -51.55% 1,676 Scott County 450 30.57% 1,022 69.43% -572 -38.86% 1,472 Shenandoah County 1,070 75.51% 347 24.49% 723 51.02% 1,417 Smyth County 498 34.09% 963 65.91% -465 -31.83% 1,461 Southampton County 1,834 67.45% 885 32.55% 949 34.90% 2,719 Spotsylvania County 508 42.37% 691 57.63% -183 -15.26% 1,199 Stafford County 426 34.72% 801 65.28% -375 -30.56% 1,227 Surry County 620 56.57% 476 43.43% 144 13.14% 1,096 Sussex County 1,429 84.66% 259 15.34% 1,170 69.31% 1,688 Tazewell County 677 28.88% 1,667 71.12% -990 -42.24% 2,344 Warren County 1,383 68.98% 622 31.02% 761 37.96% 2,005 Washington County 648 31.72% 1,395 68.28% -747 -36.56% 2,043 Westmoreland County 777 56.67% 594 43.33% 183 13.35% 1,371 Wise County 349 12.96% 2,343 87.04% -1,994 -74.07% 2,692 Wythe County 607 49.15% 628 50.85% -21 -1.70% 1,235 York County 1,078 53.13% 951 46.87% 127 6.26% 2,029 Alexandria City 3,400 37.45% 5,678 62.55% -2,278 -25.09% 9,078 Bristol City 729 53.72% 628 46.28% 101 7.44% 1,357 Buena Vista City 447 74.87% 150 25.13% 297 49.75% 597 Charlottesville City 2,088 53.14% 1,841 46.86% 247 6.29% 3,929 Clifton Forge City 343 56.05% 269 43.95% 74 12.09% 612 Colonial Heights City 1,334 83.58% 262 16.42% 1,072 67.17% 1,596 Covington City 613 55.73% 487 44.27% 126 11.45% 1,100 Danville City 4,611 73.48% 1,664 26.52% 2,947 46.96% 6,275 Fairfax City 373 40.68% 544 59.32% -171 -18.65% 917 Falls Church City 371 37.47% 619 62.53% -248 -25.05% 990 Fredericksburg City 833 48.86% 872 51.14% -39 -2.29% 1,705 Galax City 182 40.09% 272 59.91% -90 -19.82% 454 Hampton City 3,365 43.49% 4,373 56.51% -1,008 -13.03% 7,738 Harrisonburg City 576 70.67% 239 29.33% 337 41.35% 815 Hopewell City 1,778 69.81% 769 30.19% 1,009 39.62% 2,547 Lynchburg City 4,311 62.71% 2,563 37.29% 1,748 25.43% 6,874 Martinsville City 896 61.08% 571 38.92% 325 22.15% 1,467 Newport News City 4,536 49.09% 4,705 50.91% -169 -1.83% 9,241 Norfolk City 11,556 46.90% 13,085 53.10% -1,529 -6.21% 24,641 Norton City 123 32.89% 251 67.11% -128 -34.22% 374 Petersburg City 2,433 63.93% 1,373 36.07% 1,060 27.85% 3,806 Portsmouth City 4,542 42.27% 6,203 57.73% -1,661 -15.46% 10,745 Radford City 186 24.80% 564 75.20% -378 -50.40% 750 Richmond City 16,082 57.67% 11,804 42.33% 4,278 15.34% 27,886 Roanoke City 3,556 45.54% 4,253 54.46% -697 -8.93% 7,809 South Boston City 567 79.41% 147 20.59% 420 58.82% 714 South Norfolk City 931 63.90% 526 36.10% 405 27.80% 1,457 Staunton City 1,205 73.88% 426 26.12% 779 47.76% 1,631 Suffolk City 1,358 60.28% 895 39.72% 463 20.55% 2,253 Virginia Beach City 794 73.52% 286 26.48% 508 47.04% 1,080 Waynesboro City 772 71.35% 310 28.65% 462 42.70% 1,082 Williamsburg City 302 50.67% 294 49.33% 8 1.34% 596 Winchester City 1,540 74.15% 537 25.85% 1,003 48.29% 2,077 Totals 199,519 56.66% 152,639 43.34% 46,880 13.31% 352,158
General election Results Results by county or independent city 1961 Virginia gubernatorial election by county or independent city [ 13] Albertis Sydney Harrison jr. Henry Clyde Pearson Various candidates Margin Total votes cast # % # % # % # % Accomack County 1,921 80.55% 464 19.45% 1,457 61.09% 2,385 Albemarle County 2,093 66.40% 1,059 33.60% 1,034 32.80% 3,152 Alleghany County 689 58.29% 490 41.46% 3 0.25% 199 16.84% 1,182 Amelia County 782 77.97% 220 21.93% 1 0.10% 562 56.03% 1,003 Amherst County 1,533 77.78% 437 22.17% 1 0.05% 1,096 55.61% 1,971 Appomattox County 1,438 87.20% 211 12.80% 1,227 74.41% 1,649 Arlington County 10,893 55.58% 8,705 44.41% 2 0.01% 2,188 11.16% 19,600 Augusta County 2,624 59.79% 1,763 40.17% 2 0.05% 861 19.62% 4,389 Bath County 352 62.86% 208 37.14% 144 25.71% 560 Bedford County 1,929 70.63% 802 29.37% 1,127 41.27% 2,731 Bland County 509 56.74% 388 43.26% 121 13.49% 897 Botetourt County 1,189 57.19% 890 42.81% 299 14.38% 2,079 Brunswick County 2,306 89.66% 266 10.34% 2,040 79.32% 2,572 Buchanan County 2,624 55.58% 2,097 44.42% 527 11.16% 4,721 Buckingham County 911 83.50% 180 16.50% 731 67.00% 1,091 Campbell County 1,770 71.89% 692 28.11% 1,078 43.79% 2,462 Caroline County 809 74.56% 276 25.44% 533 49.12% 1,085 Carroll County 1,022 33.37% 2,041 66.63% -1,019 -33.27% 3,063 Charles City County 174 32.46% 362 67.54% -188 -35.07% 536 Charlotte County 1,041 85.19% 181 14.81% 860 70.38% 1,222 Chesterfield County 4,856 69.81% 2,100 30.19% 2,756 39.62% 6,956 Clarke County 618 83.97% 118 16.03% 500 67.93% 736 Craig County 375 64.21% 209 35.79% 166 28.42% 584 Culpeper County 1,482 84.83% 265 15.17% 1,217 69.66% 1,747 Cumberland County 503 76.91% 150 22.94% 1 0.15% 353 53.98% 654 Dickenson County 1,877 55.01% 1,535 44.99% 342 10.02% 3,412 Dinwiddie County 1,276 88.55% 165 11.45% 1,111 77.10% 1,441 Essex County 524 81.88% 116 18.13% 408 63.75% 640 Fairfax County 9,606 47.47% 10,624 52.50% 7 0.03% -1,018 -5.03% 20,237 Fauquier County 1,581 78.93% 422 21.07% 1,159 57.86% 2,003 Floyd County 469 34.54% 889 65.46% -420 -30.93% 1,358 Fluvanna County 466 75.04% 155 24.96% 311 50.08% 621 Franklin County 1,414 68.34% 655 31.66% 759 36.68% 2,069 Frederick County 1,123 76.50% 343 23.37% 2 0.14% 780 53.13% 1,468 Giles County 1,520 62.27% 921 37.73% 599 24.54% 2,441 Gloucester County 832 76.68% 253 23.32% 579 53.36% 1,085 Goochland County 772 78.62% 210 21.38% 562 57.23% 982 Grayson County 2,533 44.15% 3,204 55.85% -671 -11.70% 5,737 Greene County 388 58.08% 280 41.92% 108 16.17% 668 Greensville County 1,340 83.91% 257 16.09% 1,083 67.81% 1,597 Halifax County 1,667 86.96% 250 13.04% 1,417 73.92% 1,917 Hanover County 1,854 76.39% 573 23.61% 1,281 52.78% 2,427 Henrico County 9,826 71.50% 3,915 28.49% 2 0.01% 5,911 43.01% 13,743 Henry County 1,247 60.80% 804 39.20% 443 21.60% 2,051 Highland County 361 54.29% 304 45.71% 57 8.57% 665 Isle of Wight County 1,247 70.97% 505 28.74% 5 0.28% 742 42.23% 1,757 James City County 397 56.31% 308 43.69% 89 12.62% 705 King and Queen County 317 73.72% 113 26.28% 204 47.44% 430 King George County 404 71.50% 161 28.50% 243 43.01% 565 King William County 774 76.63% 236 23.37% 538 53.27% 1,010 Lancaster County 759 69.25% 337 30.75% 422 38.50% 1,096 Lee County 2,794 58.22% 2,005 41.78% 789 16.44% 4,799 Loudoun County 1,504 76.89% 452 23.11% 1,052 53.78% 1,956 Louisa County 1,113 79.33% 290 20.67% 823 58.66% 1,403 Lunenburg County 1,287 86.43% 202 13.57% 1,085 72.87% 1,489 Madison County 519 66.54% 261 33.46% 258 33.08% 780 Mathews County 619 67.58% 297 32.42% 322 35.15% 916 Mecklenburg County 2,372 88.94% 295 11.06% 2,077 77.88% 2,667 Middlesex County 559 72.88% 208 27.12% 351 45.76% 767 Montgomery County 2,713 50.79% 2,628 49.20% 1 0.02% 85 1.59% 5,342 Nansemond County 2,342 76.69% 707 23.15% 5 0.16% 1,635 53.54% 3,054 Nelson County 818 83.90% 157 16.10% 661 67.79% 975 New Kent County 339 71.07% 138 28.93% 201 42.14% 477 Norfolk County 2,712 77.42% 791 22.58% 1,921 54.84% 3,503 Northampton County 1,051 85.31% 181 14.69% 870 70.62% 1,232 Northumberland County 677 71.04% 276 28.96% 401 42.08% 953 Nottoway County 1,498 83.83% 289 16.17% 1,209 67.66% 1,787 Orange County 858 73.90% 299 25.75% 4 0.34% 559 48.15% 1,161 Page County 1,937 55.41% 1,559 44.59% 378 10.81% 3,496 Patrick County 1,220 78.31% 338 21.69% 882 56.61% 1,558 Pittsylvania County 3,103 83.26% 624 16.74% 2,479 66.51% 3,727 Powhatan County 537 67.80% 255 32.20% 282 35.61% 792 Prince Edward County 1,804 78.78% 486 21.22% 1,318 57.55% 2,290 Prince George County 624 78.00% 176 22.00% 448 56.00% 800 Prince William County 2,033 71.21% 822 28.79% 1,211 42.42% 2,855 Princess Anne County 3,845 77.77% 1,099 22.23% 2,746 55.54% 4,944 Pulaski County 1,607 57.91% 1,168 42.09% 439 15.82% 2,775 Rappahannock County 358 80.63% 86 19.37% 272 61.26% 444 Richmond County 385 74.90% 129 25.10% 256 49.81% 514 Roanoke County 3,467 48.86% 3,629 51.14% -162 -2.28% 7,096 Rockbridge County 1,282 65.64% 671 34.36% 611 31.29% 1,953 Rockingham County 1,910 49.28% 1,966 50.72% -56 -1.44% 3,876 Russell County 1,635 51.22% 1,557 48.78% 78 2.44% 3,192 Scott County 2,495 46.57% 2,863 53.43% -368 -6.87% 5,358 Shenandoah County 1,776 46.35% 2,056 53.65% -280 -7.31% 3,832 Smyth County 1,460 46.76% 1,662 53.24% -202 -6.47% 3,122 Southampton County 1,820 86.30% 289 13.70% 1,531 72.59% 2,109 Spotsylvania County 587 62.51% 351 37.38% 1 0.11% 236 25.13% 939 Stafford County 650 61.90% 399 38.00% 1 0.10% 251 23.90% 1,050 Surry County 688 80.37% 168 19.63% 520 60.75% 856 Sussex County 1,266 91.81% 113 8.19% 1,153 83.61% 1,379 Tazewell County 2,289 60.44% 1,497 39.53% 1 0.03% 792 20.91% 3,787 Warren County 1,671 75.99% 528 24.01% 1,143 51.98% 2,199 Washington County 3,111 58.74% 2,183 41.22% 2 0.04% 928 17.52% 5,296 Westmoreland County 696 79.09% 184 20.91% 512 58.18% 880 Wise County 3,058 64.97% 1,648 35.01% 1 0.02% 1,410 29.96% 4,707 Wythe County 1,643 53.15% 1,448 46.85% 195 6.31% 3,091 York County 925 57.52% 683 42.48% 242 15.05% 1,608 Alexandria City 5,012 61.66% 3,116 38.34% 6 23.33% 8,128 Bristol City 1,495 73.25% 542 26.56% 4 0.20% 953 46.69% 2,041 Buena Vista City 620 73.20% 227 26.80% 393 46.40% 847 Charlottesville City 1,699 60.64% 1,103 39.36% 596 21.27% 2,802 Clifton Forge City 1,003 68.89% 453 31.11% 550 37.77% 1,456 Colonial Heights City 1,039 86.44% 163 13.56% 876 72.88% 1,202 Covington City 913 58.83% 638 41.11% 1 0.06% 275 17.72% 1,552 Danville City 3,776 77.33% 1,107 22.67% 2,669 54.66% 4,883 Fairfax City 642 55.39% 517 44.61% 125 10.79% 1,159 Falls Church City 916 53.26% 804 46.74% 112 6.51% 1,720 Fredericksburg City 902 70.30% 381 29.70% 521 40.61% 1,283 Galax City 596 51.07% 571 48.93% 25 2.14% 1,167 Hampton City 3,158 60.43% 2,064 39.49% 4 0.08% 1,094 20.93% 5,226 Harrisonburg City 992 60.82% 639 39.18% 353 21.64% 1,631 Hopewell City 1,783 75.61% 575 24.39% 1,208 51.23% 2,358 Lynchburg City 3,976 61.95% 2,442 38.05% 1,534 23.90% 6,418 Martinsville City 1,476 67.24% 719 32.76% 757 34.49% 2,195 Newport News City 4,023 62.71% 2,392 37.29% 1,631 25.42% 6,415 Norfolk City 12,394 65.10% 6,643 34.90% 5,751 30.21% 19,037 Norton City 440 61.28% 278 38.72% 162 22.56% 718 Petersburg City 2,072 77.66% 595 22.30% 1 0.04% 1,477 55.36% 2,668 Portsmouth City 5,756 71.40% 2,306 28.60% 3,450 42.79% 8,062 Radford City 1,416 54.46% 1,184 45.54% 232 8.92% 2,600 Richmond City 15,671 62.49% 9,401 37.49% 4 0.02% 6,270 25.00% 25,076 Roanoke City 7,472 49.20% 7,716 50.80% -244 -1.61% 15,188 South Boston City 485 83.05% 99 16.95% 386 66.10% 584 South Norfolk City 1,914 79.52% 493 20.48% 1,421 59.04% 2,407 Staunton City 2,147 66.72% 1,071 33.28% 1,076 33.44% 3,218 Suffolk City 1,331 82.41% 284 17.59% 1,047 64.83% 1,615 Virginia Beach City 752 81.21% 174 18.79% 578 62.42% 926 Waynesboro City 1,679 60.40% 1,097 39.46% 4 0.14% 582 20.94% 2,780 Williamsburg City 321 60.00% 212 39.63% 2 0.37% 109 20.37% 535 Winchester City 1,316 79.52% 339 20.48% 977 59.03% 1,655 Total 251,861 63.84% 142,567 36.14% 62 0.02% 109,294 27.71% 394,490
Analysis Harrison almost exactly matched Almond's performance from 1957, improving the Democratic margin by one percentage point. Nevertheless, the ensuing collapse of the Byrd machine means this remains the last occasion a Democratic gubernatorial nominee has won sixty percent of the vote, and only Gerald Baliles in 1985 has subsequently won every congressional district in a gubernatorial election for either party. [ 14] This would be the last occasion until 2017 that Chesterfield County voted Democratic for Governor, [ 15] and remains the last occasion when Augusta County or Greene County voted for a Democratic gubernatorial candidate. The collapse of the Byrd machine, however, meant that this is the last election when Charles City County voted for a Republican gubernatorial candidate, as the black electorate, which had become a majority of voters in that county [ 16] continued to oppose Byrd candidates, [ 17] but would soon shift to Democrats as it had earlier done at other levels.
References ↑ Kousser, J. Morgan (1974). The Shaping of Southern Politics: Suffrage Restriction and the Establishment of the One-Party South, 1880-1910 . Yale University Press . pp. 178– 181. ISBN 0-300-01696-4 ↑ Daffron, John F. (November 13, 1960). "Stephens Enters 1961 Race for Governor of Virginia: Primary Battle with Harrison of Byrd Likely". The Washington Post . p. B1. ↑ Sweeney, James R. (2017). "Bridge to the New Dominion: Virginia's 1965 Gubernatorial Election". The Virginia Magazine of History and Biography . 125 (3). Richmond : 249. ↑ Dodson, Bob (January 14, 1961). "What Wagon Fills First?". Ledger-Star . Norfolk , Virginia. p. 1. ↑ "Verbal Battle Continues on Organization Issue – Stephens' and Harrison's Campaign Manager Needle Each Other on Attack". Danville Register and Bee . Danville , Virginia. Associated Press. May 17, 1961. p. 3-A. ↑ "Chinn Named Treasurer For Stephens Campaign". The Washington Post . Washington, D.C. May 6, 1961. p. C2. ↑ "Byrd Organization Scored, Defended". Richmond Times-Dispatch . May 26, 1961. p. 1. ↑ Heinemann, Ronald (1996). Harry Byrd of Virginia . Charlottesville , Virginia : University of Virginia Press . pp. 350– 351. ISBN 0-8139-1642-9 ↑ "Schools Continue as Focal Point in Virginia's Governor Contest". Evening Star . Washington, D.C. The Associated Press. June 18, 1961. p. B-3. 1 2 "VA Governor – D Primary Race – July 11, 1961" . Our Campaigns . ↑ "No Easy Task for GOP State Ticket". Daily Press . Newport News , Virginia . October 26, 1961. p. 4. ↑ "Politicians Watch for Vote Trend". Ledger-Star . Norfolk, Virginia. Associated Press. November 7, 1961. p. 2. 1 2 "VA Governor Race – Nov 07, 1961" . Our Campaigns . ↑ Sabato, Larry (January 1986). "The 1985 Statewide Election in Virginia: History Quietly Writ Large" (PDF) . University of Virginia Newsletter . Vol. 62, no. 5. Archived from the original (PDF) on March 22, 2016. ↑ Schwartzman, Paul (November 26, 2017). "Women's group in red Virginia county promotes a liberal surge". The Washington Post . Washington, D.C. p. C1. ↑ Hannah, John A.; Storey, Ribert G.; Battle, John S. ; Carlton, Doyle E.; Hesburgh, Reverend Theodore M.; Johnson, George M., eds. (1959). "Virginia Registration Statistics". Report of the United States Commission on Civil Rights (Report). United States Government Printing Office. p. 574. ↑ Kabaservice, Geoffrey (January 2, 2012). Rule and Ruin: The Downfall of Moderation and the Destruction of the Republican Party, From Eisenhower to the Tea Party . Oxford University Press . p. 158. ISBN 9780199921133
This page is based on this
Wikipedia article Text is available under the
CC BY-SA 4.0 license; additional terms may apply.
Images, videos and audio are available under their respective licenses.