Buckingham County | |
---|---|
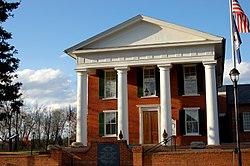
![]() Buckingham County Courthouse | |
![]() Location within the U.S. state of Virginia | |
![]() Virginia's location within the U.S. | |
Coordinates: 37°34′N78°32′W / 37.57°N 78.53°W | |
Country | ![]() |
State | ![]() |
Founded | 1761 |
Named after | Duke of Buckingham |
Seat | Buckingham |
Largest town | Dillwyn |
Area | |
• Total | 584 sq mi (1,510 km2) |
• Land | 580 sq mi (1,500 km2) |
• Water | 3.9 sq mi (10 km2) 0.7% |
Population (2020) | |
• Total | 16,824 |
• Density | 29/sq mi (11/km2) |
Time zone | UTC−5 (Eastern) |
• Summer (DST) | UTC−4 (EDT) |
Congressional district | 5th |
Website | www |
Buckingham County is a rural United States county located in the Commonwealth of Virginia, and containing the geographic center of the state. [1] Buckingham County is part of the Piedmont region of Virginia, and the county seat is Buckingham. [2]
Buckingham County was created in 1761 from the southeastern portion of Albemarle County and was predominantly farmland. The county was probably named in honor of the Duke of Buckingham, though the precise origin is uncertain. Several changes were made to the borders, until the existing boundaries were established in 1860.
As of the 2020 census, the county population was 16,824. [3]
Buckingham County, lying south of the James River and in the Piedmont at the geographic center of the state, was established on May 1, 1761, from the southeastern portion of Albemarle County. [4] The origin of the county name probably comes from the Duke of Buckingham (Buckinghamshire, England). Some sources say that the county was named for Archibald Cary's estate "Buckingham," which was located on Willis Creek. [5] This is the only Buckingham County in the United States.
In 1778 a small triangular area bordering the James River was given to Cumberland County. In 1845, another part was taken from Buckingham to form the northern portion of Appomattox County. A final adjustment of the Appomattox-Buckingham county line was made in 1860, and Buckingham's borders then became fixed in their current form. A fire destroyed the courthouse (designed by Thomas Jefferson) in 1869, and most of the early records of this county were lost.
In the nineteenth century the county was settled more heavily by people migrating from the Tidewater area. It was devoted chiefly to plantations, worked by enslaved black Americans. These were converted from tobacco cultivation to mixed farming and pulpwood harvesting as the markets changed and the soil became exhausted from tobacco. These new types of uses required fewer slaves, and many were sold from the Upper South in the domestic slave trade to the Deep South, where cotton cultivation expanded dramatically in the antebellum period.
During the twentieth century, Joe Thompson bought the Buckingham Mill. In 1945 he put into place the long system of utilizing grain which used sifters as the grain was ground. Seven years later he added grain elevators. This was the last mill to make flour in Buckingham County and represents a time when America relied on small farms and small business owners. [6]
In the 21st century, large tracts of land are held by companies such as WestVaco, which sell pulpwood and other timber products to the paper mills and wood product producers.[ citation needed ] It is still largely rural, with areas devoted to recreation such as fishing and hunting. [7]
During the American Civil War, General Robert E. Lee's army marched through the county during his retreat on their way to surrender at Appomattox, Virginia. [8] A marker in the cemetery of Trinity Presbyterian Church in New Canton reads:
According to the oral history of Trinity Presbyterian Church and this community, here are 45 Confederate and Union soldiers buried in mass graves directly behind this church. They left Appomattox after the surrender and headed for their homes north of here. Sick with disease, they died in a nearby camp. That they may not be forgotten, this plaque is placed by the Elliott Grays UDC Chapter #1877 2003.
In 2011, the county celebrated its 250th anniversary. [9]
According to the U.S. Census Bureau, the county has a total area of 584 square miles (1,510 km2), of which 580 square miles (1,500 km2) is land and 3.9 square miles (10 km2) (0.7%) is water. [10]
The geographical center of Virginia is located in Buckingham County, near the Mt. Rush community.
Census | Pop. | Note | %± |
---|---|---|---|
1790 | 9,779 | — | |
1800 | 13,389 | 36.9% | |
1810 | 20,059 | 49.8% | |
1820 | 17,569 | −12.4% | |
1830 | 18,351 | 4.5% | |
1840 | 18,786 | 2.4% | |
1850 | 13,837 | −26.3% | |
1860 | 15,212 | 9.9% | |
1870 | 13,371 | −12.1% | |
1880 | 15,540 | 16.2% | |
1890 | 14,383 | −7.4% | |
1900 | 15,266 | 6.1% | |
1910 | 15,204 | −0.4% | |
1920 | 14,885 | −2.1% | |
1930 | 13,315 | −10.5% | |
1940 | 13,398 | 0.6% | |
1950 | 12,288 | −8.3% | |
1960 | 10,877 | −11.5% | |
1970 | 10,597 | −2.6% | |
1980 | 11,751 | 10.9% | |
1990 | 12,873 | 9.5% | |
2000 | 15,623 | 21.4% | |
2010 | 17,146 | 9.7% | |
2020 | 16,824 | −1.9% | |
U.S. Decennial Census [11] 1790-1960 [12] 1900-1990 [13] 1990-2000 [14] 2010 [15] 2020 [16] |
Race / Ethnicity (NH = Non-Hispanic) | Pop 2010 [15] | Pop 2020 [16] | % 2010 | % 2020 |
---|---|---|---|---|
White alone (NH) | 10,494 | 10,314 | 61.20% | 61.31% |
Black or African American alone (NH) | 5,979 | 5,390 | 34.87% | 32.04% |
Native American or Alaska Native alone (NH) | 44 | 44 | 0.26% | 0.26% |
Asian alone (NH) | 63 | 59 | 0.37% | 0.35% |
Pacific Islander alone (NH) | 1 | 0 | 0.01% | 0.00% |
Some Other Race alone (NH) | 17 | 52 | 0.10% | 0.31% |
Mixed Race or Multi-Racial (NH) | 260 | 552 | 1.52% | 3.28% |
Hispanic or Latino (any race) | 288 | 413 | 1.68% | 2.45% |
Total | 17,146 | 16,824 | 100.00% | 100.00% |
As of the census [17] of 2010, there were 17,146 people and 5,695 households residing in the county. The population density was 29.6 people per square mile (11.4 people/km2). There were 7,294 housing units. The racial makeup of the county was 62.5% White, 35.1% Black or African American alone, 0.3% American Indian, 0.4% Asian, 1.7% Hispanic or Latino, and 1.6% from two or more races. 60.9% of the population identified as White Alone, not Hispanic or Latino.
The largest ancestry groups are listed as 18.7% American, 9.2% English, and 5.4% German. People of African American descent comprise 35.1% of the population, usually having European ancestry as well.
There were 5,965 households, out of which 26.3% had children under the age of 18 living with them, 48.1% were married couples living together, 15.3% had a female householder with no husband present, 5.6 had a male householder with no wife present, and 31.1% were non-families. 26.1% of all households were made up of individuals living alone. The average household size was 2.48 and the average family size was 2.95.
In the county, the population was spread out, with 19.2% under the age of 18, .6% from 20 to 24, 13% from 25 to 34, 22.8% from 35 to 49, and 22% from 50 to 64, and 14.3% who were 65 years of age or older. There were 9,493 males and 7,653 females. The median age was 41.7.
The median income for a household in the county was $36,378. Males had a median income of $36,420 versus $32,327 for females. The per capita income for the county was $16,938. About 21.1% of the population were below the poverty line.
In education, 38.2% of the population over age 25 graduated high school (or equivalent), 13.9% had some college, no degree, 3.8% hold an associate degree, 10.9% hold a bachelor's degree, and 10.9% hold a Graduate or Professional degree.
Buckingham County's economy has historically been rooted in agriculture and forestry. Livestock—particularly beef and feeder cattle—constitute a large share of agricultural revenue, while hay and other feed crops support local farms. [18] Timberland is a significant county resource, with large areas of privately owned forest contributing to local timber harvests and wood-related employment. [18]
Other important employment sectors include construction, retail trade, and health care and social assistance. [19]
Since the early 2020s, Buckingham County has become a focal point for utility-scale solar development. Several projects have been proposed, permitted, or constructed in the county, representing new investment in renewable energy infrastructure and changes to the county's land use profile.
Notable projects cited in local and regional coverage include smaller agrivoltaic projects and larger utility arrays. One reported facility, Black Bear Solar, was described in local reporting as adopting agrivoltaic practices, pairing solar arrays with beekeeping to support pollinators and compatible agricultural uses. [20] Larger projects such as Riverstone Solar (reported to cover substantial acreage and produce on the order of tens to hundreds of megawatts) have also been reported in the regional press. [21]
The expansion of industrial solar in Buckingham County has generated controversy and legal/regulatory scrutiny. Reported issues include environmental compliance failures, erosion and sediment control problems, and disputes over local land-use authority and permit conditions.
Some renewable energy companies operating in or near Buckingham have been subject to enforcement actions by the Virginia Department of Environmental Quality (DEQ) for violations such as failure to stabilize stormwater basins, sediment discharge, and inadequate site inspections. For example, enforcement actions and consent orders involving DEQ fines have been reported in local advocacy coverage. [22] Reports indicate cumulative fines for multiple sites have been in the hundreds of thousands of dollars in some cases. [22]
Local officials and residents have also expressed concern about the scale of some proposals, the adequacy of county inspection capacity, and whether state policy changes could affect local control over siting and acreage limits for industrial solar. [23] Specific projects (for example, Riverstone Solar and proposals associated with companies such as Energix/Gabriel Solar) have faced public hearings, petitions, and scrutiny over compliance with permit conditions; local reporting has documented investigations and potential enforcement actions related to these concerns. [21] [24]
Industrial solar development in Buckingham County has been framed by proponents as an opportunity to diversify the local tax base, create temporary construction jobs, and produce renewable energy. Some projects incorporating agrivoltaic practices have been presented as models for co-existence between solar generation and agricultural uses. [20]
Critics emphasize environmental risks (such as erosion and impacts to water quality), long-term changes to rural landscapes, potential impacts on property values, and the burden placed on county staff for monitoring and enforcement. These debates have been a recurring feature of public hearings and local media coverage related to several Buckingham County solar projects. [25]
Source: [26]
Source: [27]
Source: [28]
John McGuire (R, VA-5) in the U.S. House of Representatives
Year | Republican | Democratic | Third party(ies) | |||
---|---|---|---|---|---|---|
No. | % | No. | % | No. | % | |
1912 | 97 | 11.98% | 603 | 74.44% | 110 | 13.58% |
1916 | 181 | 22.24% | 625 | 76.78% | 8 | 0.98% |
1920 | 311 | 29.28% | 749 | 70.53% | 2 | 0.19% |
1924 | 213 | 25.03% | 623 | 73.21% | 15 | 1.76% |
1928 | 579 | 49.15% | 599 | 50.85% | 0 | 0.00% |
1932 | 204 | 18.72% | 870 | 79.82% | 16 | 1.47% |
1936 | 273 | 22.38% | 945 | 77.46% | 2 | 0.16% |
1940 | 289 | 25.73% | 829 | 73.82% | 5 | 0.45% |
1944 | 286 | 28.26% | 723 | 71.44% | 3 | 0.30% |
1948 | 354 | 27.94% | 728 | 57.46% | 185 | 14.60% |
1952 | 811 | 46.58% | 919 | 52.79% | 11 | 0.63% |
1956 | 751 | 43.64% | 648 | 37.65% | 322 | 18.71% |
1960 | 765 | 44.37% | 947 | 54.93% | 12 | 0.70% |
1964 | 1,547 | 56.60% | 1,182 | 43.25% | 4 | 0.15% |
1968 | 1,027 | 32.05% | 984 | 30.71% | 1,193 | 37.23% |
1972 | 2,107 | 62.86% | 1,186 | 35.38% | 59 | 1.76% |
1976 | 1,487 | 39.57% | 2,179 | 57.98% | 92 | 2.45% |
1980 | 1,864 | 47.51% | 1,933 | 49.27% | 126 | 3.21% |
1984 | 2,627 | 57.36% | 1,879 | 41.03% | 74 | 1.62% |
1988 | 2,481 | 55.49% | 1,941 | 43.41% | 49 | 1.10% |
1992 | 2,368 | 46.40% | 2,193 | 42.97% | 542 | 10.62% |
1996 | 1,974 | 40.70% | 2,374 | 48.95% | 502 | 10.35% |
2000 | 2,738 | 50.20% | 2,561 | 46.96% | 155 | 2.84% |
2004 | 3,185 | 52.85% | 2,789 | 46.28% | 53 | 0.88% |
2008 | 3,428 | 49.01% | 3,489 | 49.89% | 77 | 1.10% |
2012 | 3,569 | 47.86% | 3,750 | 50.29% | 138 | 1.85% |
2016 | 3,950 | 54.19% | 3,128 | 42.91% | 211 | 2.89% |
2020 | 4,544 | 55.92% | 3,471 | 42.71% | 111 | 1.37% |
2024 | 4,847 | 61.16% | 2,988 | 37.70% | 90 | 1.14% |