2012 United States presidential election in Louisiana

Last updated

2012 United States presidential election in Louisiana
Flag of Louisiana.svg
  2008 November 6, 2012 2016  
  Mitt Romney by Gage Skidmore 6 cropped.jpg President Barack Obama, 2012 portrait crop.jpg
Nominee Mitt Romney Barack Obama
Party Republican Democratic
Home state Massachusetts Illinois
Running mate Paul Ryan Joe Biden
Electoral vote80
Popular vote1,152,262809,141
Percentage57.78%40.58%

Louisiana Presidential Election Results 2012.svg
2012 United States presidential election in Louisiana by congressional district.svg
2012 LA Pres.svg

President before election

Barack Obama
Democratic

Elected President

Barack Obama
Democratic

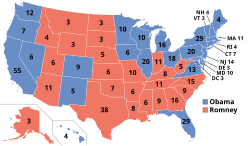
The 2012 United States presidential election in Louisiana took place on November 6, 2012, as part of the 2012 United States presidential election in which all 50 states plus the District of Columbia participated. Louisiana voters chose eight electors to represent them in the Electoral College via a popular vote pitting incumbent Democratic President Barack Obama and his running mate, Vice President Joe Biden, against Republican challenger and former Massachusetts Governor Mitt Romney and his running mate, Congressman Paul Ryan.

Contents

Romney carried Louisiana's eight electoral votes with 57.78% of the popular vote. Louisiana was one of six states where Obama did better in 2012 than in 2008, with his margin of loss decreasing from 18.63% to 17.20%. [a] As of the 2024 presidential election, this is the last time that a Democrat has won over 40% of the vote in the state. Obama is the only Democrat to ever win two terms without carrying the state at least once.

Primary elections

Democratic primary

2012 Louisiana Democratic presidential primary
Flag of Louisiana.svg
  2008 March 24, 2012 (2012-03-24) 2016  
  President Barack Obama, 2012 portrait crop.jpg John Wolfe, Jr.jpg
Candidate Barack Obama John Wolfe, Jr.
Home state Illinois Tennessee
Delegate count604
Popular vote115,15017,804
Percentage76.46%11.82%

  3x4.svg LG PICs 2 002.JPG
Candidate Bob Ely Darcy Richardson
Home state Illinois Florida
Delegate count00
Popular vote9,8977,750
Percentage6.57%5.15%

Louisiana Democratic primary, 2012.svg
Louisiana results by parish
  Barack Obama
  John Wolfe, Jr.

President Barack Obama received little serious opposition in the 2012 Democratic primaries, handily winning overall with over 76% of the vote. However, Tennessee attorney and perennial political candidate John Wolfe Jr. challenged President Obama in the primaries, and received nearly 12% of the vote. Entrepreneur Bob Ely and historian Darcy Richardson also participated, and received a little over 6% and 5% of the vote, respectively. On the date of the primary, President Obama swept nearly every parish in the state, with Wolfe winning LaSalle, Grant, and Cameron parishes. Although Wolfe qualified for four delegates, the Louisiana Democratic Party announced that they would not award the delegates to Wolfe on technical grounds. [1]

2012 Louisiana Democratic
presidential primary [2]
CandidateVotes%Pledged
delegates [3]
Barack Obama (incumbent)115,15076.4660
John Wolfe, Jr. 17,80411.824
Bob Ely 9,8976.570
Darcy Richardson7,7505.150
Total150,601100%64

Republican primary and caucuses

2012 Louisiana Republican primary and caucuses
Flag of Louisiana.svg
  2008 March 24, 2012 (2012-03-24) 2016  
  Rick Santorum by Gage Skidmore.jpg Mitt Romney by Gage Skidmore 6 cropped.jpg
Candidate Rick Santorum Mitt Romney
Home state Pennsylvania Massachusetts
Delegate count105
Popular vote91,32149,758
Percentage49.0%26.7%

  Newt Gingrich by Gage Skidmore 3 (cropped).jpg Ron Paul by Gage Skidmore 3 crop.jpg
Candidate Newt Gingrich Ron Paul
Home state Georgia Texas
Delegate count00
Popular vote29,65611,467
Percentage15.9%6.2%

Louisiana Republican Presidential Primary Election Results by County, 2012.svg
Louisiana results by parish
  Rick Santorum
  Mitt Romney

The 2012 Louisiana Republican primary took place on Saturday, March 24, 2012. Additionally, caucuses were held on April 28. [4] [5]

Louisiana had 46 delegates to the Republican National Convention. 20 were awarded based on the primary outcome, and the other 26 by the caucuses.

Primary

The 20 delegate allocation was proportional among candidates who received at least 25% of the statewide vote. Candidates who did not reach the 25% threshold lost the delegates they otherwise would have won, and those delegates became uncommitted then. [6]

On March 24, Rick Santorum was declared the winner of the state's primary. [7]

2012 Louisiana Republican primary
CandidateVotesPercentageProjected delegate count
GP
[8]
CNN
[9]
MSNBC
[10]
America Symbol.svg Rick Santorum 91,32148.99%101010
Mitt Romney 49,75826.69%556
Newt Gingrich 29,65615.91%000
Ron Paul 11,4676.15%000
Buddy Roemer 2,2031.18%000
Rick Perry 9550.51%000
Michele Bachmann 6220.33%000
Jon Huntsman, Jr. 2420.13%000
Randy Crow1860.10%000
Unprojected delegates:554
Total:186,410100.00%202020

[11]

Caucuses, delegate dispute, and ultimate agreement

Although Ron Paul won just 6% of the vote in the primary on March 24 (in which almost 190,000 voters cast ballots), he carried four of Louisiana's six congressional districts in the congressional district caucuses held the following month (in which fewer than 10,000 people took part). [12]

Paul's showing in the April district caucuses "guaranteed him 12 of the state's 46 national convention delegates and, as important, gave his forces 111 of the 180 delegates to the state convention," which chose the actual delegates to the 2012 Republican National Convention in Tampa, Florida. [13] [12]

In advance of the June 2 Louisiana State Republican Convention in Shreveport, pro-Paul delegates and others clashed with officials and loyalists of the state Republican Party, which "issued supplemental rules on the eve of the convention to keep the Paul forces from wresting more than the 17 delegates which, in their view, was their due." [12] The convention itself was described as a "riotous" and chaotic scene, as the police removed two Paul supporters, arresting one, and the convention devolved into two separate conventions, "as the Paul delegates turned their chairs around and conducted their convention facing one way, while the state party and its loyalists conducted their parallel convention facing the other." [12]

The split convention resulted in two rival slates of 46 delegates. [12] [14] The national Republican Party accepted the slate submitted by Louisiana Republican Party chairman Roger Villere as the official slate. [14] In late July, however, Paul's campaign announced that it would challenge all the Louisiana delegates, asserting that "our rump convention is the legitimate delegation and they have a right to be seated at the Republican National Convention." [15] In its official challenge to the delegate slate filed in August, Paul's campaign likened Villere to the leader of "a North Korean politburo"; in response, the executive director of the Louisiana Republican Party said that Paul's challenge was "full of personal attacks, hyperbole and unfounded assumption." [16] The dispute was to be adjudicated by the Contest Committee of the national Republican Party, with a possible appeal to the full Republican National Committee and then to the Credential Committee of the convention. [12] However, in late Augustone week prior to the conventionthe Paul campaign made an agreement with the Republican Party of Louisiana in which Paul would get 17 of the state's 46 delegates, with the rest of the state's delegates supporting then-presumptive nominee Mitt Romney. [17]

General election

Predictions

SourceRankingAs of
Huffington Post [18] Safe RNovember 6, 2012
CNN [19] Safe RNovember 6, 2012
New York Times [20] Safe RNovember 6, 2012
Washington Post [21] Safe RNovember 6, 2012
RealClearPolitics [22] Solid RNovember 6, 2012
Sabato's Crystal Ball [23] Solid RNovember 5, 2012
FiveThirtyEight [24] Solid RNovember 6, 2012

Results

2012 United States presidential election in Louisiana [25]
PartyCandidateRunning mateVotesPercentageElectoral votes
Republican Mitt Romney Paul Ryan 1,152,26257.78%8
Democratic Barack Obama (incumbent) Joe Biden (incumbent)809,14140.58%0
Libertarian Gary Johnson Jim Gray 18,1570.91%0
Green Jill Stein Cheri Honkala 6,9780.35%0
Constitution Virgil Goode Jim Clymer2,5080.13%0
Others1,7660.09%0
Justice Rocky Anderson Luis J. Rodriguez 1,3680.07%0
Socialism and Liberation Peta Lindsay Yari Osorio 6220.03%0
Prohibition Party Jack Fellure Toby Davis 5190.03%0
Socialist Workers James Harris Alyson Kennedy 3890.02%0
Socialist Equality Jerry White Phyllis Scherrer3550.02%0
Totals1,994,065100.00%8
Voter turnout (registered voters)67.26%

By parish

ParishMitt Romney
Republican
Barack Obama
Democratic
Various candidates
Other parties
MarginTotal
#%#%#%#%
Acadia 19,93174.27%6,56024.45%3441.28%13,37149.82%26,835
Allen 6,49569.79%2,61728.12%1952.09%3,87841.67%9,307
Ascension 33,85666.29%16,34932.01%8681.70%17,50734.28%51,073
Assumption 6,08355.34%4,75443.25%1551.41%1,32912.09%10,992
Avoyelles 10,67062.65%6,07735.68%2851.67%4,59326.97%17,032
Beauregard 11,11278.12%2,82824.45%2852.00%8,28453.67%14,225
Bienville 3,64150.55%3,49048.45%721.00%1512.10%7,203
Bossier 34,98872.05%12,95626.68%6181.27%22,03245.37%48,562
Caddo 52,45946.94%58,04251.93%1,2641.13%-5,583-4.99%111,765
Calcasieu 51,85063.44%28,35934.70%1,5171.86%23,49128.74%81,726
Caldwell 3,64077.18%1,01621.54%601.28%2,62455.64%4,716
Cameron 3,26087.07%40810.90%762.03%2,85276.17%3,744
Catahoula 2,74465.44%1,40833.58%410.98%1,33631.86%4,193
Claiborne 3,64954.20%3,01444.77%691.03%6359.43%6,732
Concordia 5,45058.10%3,83340.86%971.04%1,61717.24%9,380
DeSoto 7,35356.34%5,55342.55%1451.11%1,80013.79%13,051
East Baton Rouge 92,29246.57%102,65651.80%3,2231.63%-10,364-5.23%198,171
East Carroll 1,50837.62%2,47861.83%220.55%-970-24.21%4,008
East Feliciana 5,39752.87%4,64845.53%1641.60%7497.34%10,209
Evangeline 10,18164.56%5,33033.80%2591.64%4,85130.76%15,770
Franklin 6,29467.42%2,92131.29%1211.29%3,37336.13%9,336
Grant 7,08281.71%1,42216.41%1631.88%5,66065.30%8,667
Iberia 20,89262.56%12,13236.33%3731.11%8,76026.23%33,397
Iberville 7,27142.74%9,54856.12%1951.14%-2,277-13.38%17,014
Jackson 5,13268.16%2,30530.61%921.23%2,82737.55%7,529
Jefferson 102,53658.15%70,38439.91%3,4231.94%32,15218.24%176,343
Jefferson Davis 10,01472.91%3,48425.37%2361.72%6,53047.54%13,734
Lafayette 64,99265.89%31,76832.21%1,8821.90%33,22433.68%98,642
Lafourche 28,59273.17%9,62324.63%8602.20%18,96948.54%39,075
LaSalle 5,72687.13%76411.63%821.24%4,96275.50%6,572
Lincoln 10,73956.54%7,95641.89%2981.57%2,78314.65%18,993
Livingston 45,51384.19%7,45113.78%1,0982.03%38,06270.41%54,062
Madison 2,00038.56%3,15460.81%330.63%-1,154-22.25%5,187
Morehouse 6,59152.25%5,88846.68%1351.07%7035.57%12,614
Natchitoches 9,07752.60%7,94246.02%2391.38%1,1356.58%17,258
Orleans 28,00317.74%126,72280.30%3,0881.96%-98,719-62.56%157,813
Ouachita 40,94859.80%26,64538.91%8811.29%14,30320.89%68,474
Plaquemines 6,47163.20%3,59935.15%1691.65%2,87228.05%10,239
Pointe Coupee 6,54853.91%5,43644.75%1631.34%1,1129.16%12,147
Rapides 37,19364.10%20,04534.55%7811.35%17,14829.55%58,019
Red River 2,48351.65%2,25346.87%711.48%2304.78%4,807
Richland 5,84662.66%3,38736.31%961.03%2,45926.35%9,329
Sabine 7,73876.97%2,19421.82%1211.21%5,54455.15%10,053
St. Bernard 8,50160.92%5,05936.25%3952.83%3,44224.67%13,955
St. Charles 15,93762.91%8,89635.12%5001.97%7,04127.79%25,333
St. Helena 2,52939.55%3,78059.12%851.33%-1,251-19.57%6,394
St. James 5,20942.03%7,05956.95%1271.02%-1,850-14.92%12,395
St. John the Baptist 7,62036.07%13,17962.39%3241.54%-5,559-26.32%21,123
St. Landry 21,47551.56%19,66847.23%5041.21%1,8074.33%41,647
St. Martin 15,65361.55%9,42237.05%3581.40%6,23124.50%25,433
St. Mary 13,88558.74%9,45039.97%3051.29%4,43518.77%23,640
St. Tammany 84,72375.04%25,72822.79%2,4512.17%58,99552.25%112,902
Tangipahoa 31,59063.06%17,72235.37%7871.57%13,86827.69%50,099
Tensas 1,23043.74%1,56455.62%180.64%-334-11.88%2,812
Terrebonne 29,50369.68%12,07428.52%7641.80%17,42941.16%42,341
Union 7,56170.23%3,07528.56%1301.21%4,48641.67%10,766
Vermilion 18,91075.68%5,72022.89%3571.43%13,19052.79%24,987
Vernon 12,15077.83%3,17320.33%2871.84%8,97757.50%15,610
Washington 11,79863.49%6,46634.80%3171.71%5,33228.69%18,581
Webster 11,40061.90%6,80236.94%2141.16%4,59824.96%18,416
West Baton Rouge 6,92254.19%5,69244.56%1601.25%1,2309.63%12,774
West Carroll 3,62879.77%85318.76%671.47%2,77561.01%4,548
West Feliciana 3,25756.38%2,44142.25%791.37%81614.13%5,777
Winn 4,54169.50%1,91929.37%741.13%2,62240.13%6,534
Totals1,152,26257.78%809,14140.58%32,6621.64%343,12117.20%1,994,065

By congressional district

Romney won five of six congressional districts. [26]

DistrictRomneyObamaRepresentative
1st 70.85%26.86% Steve Scalise
2nd 22.81%75.84% Cedric Richmond
3rd 66.1%32.26% Charles Boustany
4th 59%39.66% John Fleming
5th 61%37.66% Rodney Alexander
6th 66.15%31.96% Bill Cassidy

See also

Notes

  1. As Louisiana was also one of only five states in which McCain did better in 2008 than Bush did in 2004, it is the only state to swing toward McCain in 2008 and Obama in 2012.

References

  1. "Louisiana Democratic Party denies 3 delegates to fringe candidate". NOLA.com. Archived from the original on April 19, 2012. Retrieved January 16, 2017.
  2. "Louisiana Secretary of State - Election Results". voterportal.sos.la.gov. Retrieved March 28, 2020.
  3. "Louisiana Democratic Delegation 2012". www.thegreenpapers.com. Retrieved March 28, 2020.
  4. "Primary and Caucus Printable Calendar". CNN . Retrieved January 11, 2012.
  5. "Presidential Primary Dates" (PDF). Federal Election Commission . Retrieved January 23, 2012.
  6. Nate Silver (March 24, 2012). "G.O.P. Campaign Could End Soon — But Not in Louisiana". FiveThirtyEight . Retrieved March 25, 2012.
  7. Rick Santorum wins Louisiana primary
  8. The Green Papers, "2012 Louisiana Republican Primary" . The Green Papers.
  9. CNN, "Republican Primary" . CNN.
  10. MSNBC, "Republican Primary" . MSNBC.
  11. "Unofficial Election Results". LA Secretary of State. Retrieved March 25, 2012.
  12. 1 2 3 4 5 6 Jonathan Tilove, Louisiana Republican convention devolves into separate meetings, The Times-Picayune (June 10, 2012).
  13. Tilove, Jonathan (April 28, 2012). "Ron Paul supporters dominate Louisiana's Republican presidential caucuses". The Times-Picayune. Archived from the original on April 29, 2012.
  14. 1 2 Melina Deslatte, Dispute over La. delegates to GOP convention goes national, Associated Press (August 1, 2012).
  15. Adam Levy, Ron Paul campaign to challenge all Louisiana delegates, CNN (July 27, 2012).
  16. Jonathan Tilove Ron Paul supporters won't back down in Louisiana GOP dispute, The Times-Picayune (August 6, 2012).
  17. Stephen Ohlemacher, Paul adds delegates in Louisiana compromise, Associated Press (August 21, 2012).
  18. "Huffington Post Election Dashboard". HuffPost . Archived from the original on August 13, 2013.
  19. "America's Choice 2012 Election Center: CNN Electoral Map". CNN . Archived from the original on January 19, 2013.
  20. "Election 2012 - The Electoral Map: Building a Path to Victory". The New York Times . Archived from the original on July 8, 2012.
  21. "2012 Presidential Election Results" . The Washington Post. Archived from the original on July 26, 2012.
  22. "RealClearPolitics - 2012 Election Maps - Battle for White House". Archived from the original on June 8, 2011.
  23. "PROJECTION: OBAMA WILL LIKELY WIN SECOND TERM".
  24. "Nate Silver's political calculations predict 2012 election outcome".
  25. "Louisiana Secretary of State". Louisiana Secretary of State.
  26. "Daily Kos Elections' statewide election results by congressional and legislative districts". Daily Kos. Retrieved August 11, 2020.