Richland Parish | |
---|---|
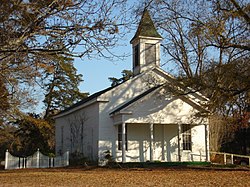
![]() Alto Presbyterian Church | |
![]() Location within the U.S. state of Louisiana | |
![]() Louisiana's location within the U.S. | |
Coordinates: 32°25′18″N91°45′43″W / 32.421736°N 91.762070°W | |
Country | ![]() |
State | ![]() |
Founded | September 29, 1878 |
Named after | Fertile (rich) land in the area |
Seat | Rayville |
Largest town | Rayville |
Area | |
• Total | 576 sq mi (1,490 km2) |
• Land | 559 sq mi (1,450 km2) |
• Water | 9.375 sq mi (24.28 km2) 1.6% |
Population (2020) | |
• Total | 20,043 |
• Density | 35/sq mi (13/km2) |
Time zone | UTC−6 (Central) |
• Summer (DST) | UTC−5 (CDT) |
Richland Parish is a parish located in the North Louisiana Delta Country in the U.S. state of Louisiana, known for its fertile, flat farmland, cane brakes, and open spaces. The parish had a population of 20,043 at the 2020 United States census. [1] The name Richland was chosen due to the rich production from farming. The parish seat and largest community is Rayville.
The parish was officially created on September 29, 1868. [2] Rayville, Louisiana, the parish seat, was named for John Ray, a politician from Monroe with large land holdings in present-day Rayville. [3]
Richland Parish is home to the first public parish library in the State of Louisiana, the Rhymes Memorial Library. The library was built in 1925 by the Lambda Kappa Club of Rayville. R.R. Rhymes donated the original building in memory of his wife, Nonnie Roark Rhymes. [4]
Bayou Macon flows through the eastern areas of Richland. Other tributaries in the parish include Crew Lake, and the Lafourche Diversion Canal are located in the western portion of the parish. Boeuf River flows from the northern end to the southern end in the center of the parish.
Air, Rail, Levee | |
---|---|
![]() | Rayville Municipal Airport |
![]() | Delhi Municipal Airport |
![]() | Monroe Regional Airport |
![]() | Kansas City Southern Railroad |
![]() | Tensas Basin Levee District |
Census | Pop. | Note | %± |
---|---|---|---|
1870 | 5,110 | — | |
1880 | 8,440 | 65.2% | |
1890 | 10,230 | 21.2% | |
1900 | 11,116 | 8.7% | |
1910 | 15,769 | 41.9% | |
1920 | 20,860 | 32.3% | |
1930 | 26,374 | 26.4% | |
1940 | 28,829 | 9.3% | |
1950 | 26,672 | −7.5% | |
1960 | 23,824 | −10.7% | |
1970 | 21,774 | −8.6% | |
1980 | 22,187 | 1.9% | |
1990 | 20,629 | −7.0% | |
2000 | 20,981 | 1.7% | |
2010 | 20,725 | −1.2% | |
2020 | 20,043 | −3.3% | |
U.S. Decennial Census [5] 1790–1960 [6] 1900–1990 [7] 1990–2000 [8] 2010 [9] |
Race / Ethnicity (NH = Non-Hispanic) | Pop 1980 [10] | Pop 1990 [11] | Pop 2000 [12] | Pop 2010 [13] | Pop 2020 [14] | % 1980 | % 1990 | % 2000 | % 2010 | % 2020 |
---|---|---|---|---|---|---|---|---|---|---|
White alone (NH) | 14,153 | 12,910 | 12,667 | 12,714 | 11,667 | 63.79% | 62.58% | 60.37% | 61.35% | 58.21% |
Black or African American alone (NH) | 7,754 | 7,492 | 7,927 | 7,406 | 7,303 | 34.95% | 36.32% | 37.78% | 35.73% | 36.44% |
Native American or Alaska Native alone (NH) | 11 | 14 | 26 | 57 | 53 | 0.05% | 0.07% | 0.12% | 0.28% | 0.26% |
Asian alone (NH) | 21 | 13 | 36 | 54 | 50 | 0.09% | 0.06% | 0.17% | 0.26% | 0.25% |
Native Hawaiian or Pacific Islander alone (NH) | x [15] | x [16] | 0 | 2 | 0 | x | x | 0.00% | 0.01% | 0.00% |
Other race alone (NH) | 2 | 1 | 3 | 6 | 66 | 0.01% | 0.00% | 0.01% | 0.03% | 0.33% |
Mixed race or Multiracial (NH) | x [17] | x [18] | 95 | 154 | 504 | x | x | 0.45% | 0.74% | 2.51% |
Hispanic or Latino (any race) | 246 | 199 | 227 | 332 | 400 | 1.11% | 0.96% | 1.08% | 1.60% | 2.00% |
Total | 22,187 | 20,629 | 20,981 | 20,725 | 20,043 | 100.00% | 100.00% | 100.00% | 100.00% | 100.00% |
As of the 2020 United States census, there were 20,043 people, 7,459 households, and 4,972 families residing in the parish.
Parish Administration | Administrators |
---|---|
Sheriff | Gary Gilley, No Party |
Coroner | Dr. Matt Prine, Republican |
Assessor | Lee Brown, III, Democrat |
School Board Superintendent | Sheldon Jones |
Homeland Security | Dawn Williams |
Parish Police Jury | Police Jurors |
---|---|
District 1, Delhi | Steve Craig, Republican |
District 2, Delhi | Patrick Stubblefield, Democrat |
District 3, Rayville | Sharon Gee, Democrat |
District 4, Rayville | Steve Lofton, Republican |
District 5, Rayville | Paul Slayter, Republican |
District 6, Rayville | Althan Smith, Democrat |
District 7, Alto | Cecil Reddick, Republican |
District 8, Start | Elliot Colvin, Republican |
District 9, Mangham | Roy Wiggins, Jr., Republican |
5th Judicial District | Parish Judicial Leaders |
---|---|
Division "A" | Clay Hamilton, Republican |
Division "B" | Will Rhymes Barham, Republican |
Division "C" | Steve Dean, Republican |
Clerk of Court | Stacie Williamson, Republican |
Parish School Board | Board Members |
---|---|
District 1, Delhi | Billy Calvert, No Party |
District 2, Delhi | Eugene Young, Jr., Democrat |
District 3, Rayville | Moses "DeJohn" Wilkins, Democrat |
District 4, Rayville | James Hough, Republican |
District 5, Rayville | Alece Copeland, No Party |
District 6, Rayville | Marie Lewis, Democrat |
District 7, Archibald | Joe Chapman, No Party |
District 8, Start | Kevin Eppinette, No Party |
District 9, Mangham | Chris Pruitt, Republican |
Year | Republican | Democratic | Third party(ies) | |||
---|---|---|---|---|---|---|
No. | % | No. | % | No. | % | |
1912 | 2 | 0.46% | 393 | 89.93% | 42 | 9.61% |
1916 | 7 | 1.07% | 650 | 98.93% | 0 | 0.00% |
1920 | 50 | 7.00% | 664 | 93.00% | 0 | 0.00% |
1924 | 116 | 14.61% | 678 | 85.39% | 0 | 0.00% |
1928 | 242 | 18.26% | 1,083 | 81.74% | 0 | 0.00% |
1932 | 46 | 2.53% | 1,773 | 97.42% | 1 | 0.05% |
1936 | 165 | 6.36% | 2,425 | 93.48% | 4 | 0.15% |
1940 | 310 | 11.37% | 2,417 | 88.63% | 0 | 0.00% |
1944 | 488 | 18.95% | 2,087 | 81.05% | 0 | 0.00% |
1948 | 119 | 4.69% | 960 | 37.87% | 1,456 | 57.44% |
1952 | 1,645 | 39.70% | 2,499 | 60.30% | 0 | 0.00% |
1956 | 1,063 | 29.88% | 1,094 | 30.76% | 1,400 | 39.36% |
1960 | 1,378 | 35.62% | 996 | 25.74% | 1,495 | 38.64% |
1964 | 4,498 | 85.76% | 747 | 14.24% | 0 | 0.00% |
1968 | 1,031 | 15.95% | 1,017 | 15.74% | 4,415 | 68.31% |
1972 | 4,304 | 70.80% | 1,335 | 21.96% | 440 | 7.24% |
1976 | 3,630 | 49.93% | 3,495 | 48.07% | 145 | 1.99% |
1980 | 4,772 | 54.57% | 3,745 | 42.83% | 227 | 2.60% |
1984 | 5,980 | 65.84% | 2,918 | 32.13% | 185 | 2.04% |
1988 | 5,226 | 62.85% | 2,833 | 34.07% | 256 | 3.08% |
1992 | 3,808 | 42.77% | 3,706 | 41.63% | 1,389 | 15.60% |
1996 | 3,765 | 43.23% | 4,143 | 47.57% | 802 | 9.21% |
2000 | 4,895 | 57.69% | 3,282 | 38.68% | 308 | 3.63% |
2004 | 5,471 | 63.14% | 3,082 | 35.57% | 112 | 1.29% |
2008 | 5,751 | 62.64% | 3,311 | 36.06% | 119 | 1.30% |
2012 | 5,846 | 62.66% | 3,387 | 36.31% | 96 | 1.03% |
2016 | 6,287 | 65.51% | 3,157 | 32.90% | 153 | 1.59% |
2020 | 6,607 | 66.47% | 3,225 | 32.44% | 108 | 1.09% |
2024 | 6,354 | 69.12% | 2,732 | 29.72% | 107 | 1.16% |