Winn Parish, Louisiana | |
|---|---|
| Parish of Winn | |
| Winn Parish Courthouse in Winnfield | |
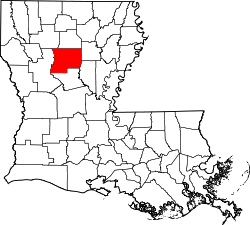
| Location within the U.S. state of Louisiana | |
| Louisiana's location within the US | |
| Country | |
| State | |
| Region | North Louisiana |
| Founded | February 24, 1852 |
| Named after | Walter Winn or Winfield Scott |
| Parish seat (and largest city) | Winnfield |
| Incorporated municipalities | 6 (total)
|
| Area | |
• Total | 957 sq mi (2,480 km2) |
| • Land | 950 sq mi (2,500 km2) |
| • Water | 6.7 sq mi (17 km2) |
| • percentage | 0.7 sq mi (1.8 km2) |
| Population (2020) | |
• Total | 13,755 |
| • Density | 14/sq mi (5.6/km2) |
| Time zone | UTC-6 (CST) |
| • Summer (DST) | UTC-5 (CDT) |
| Area code | 318 |
| Congressional district | 5th |
Winn Parish is a parish located in the U.S. state of Louisiana. As of the 2020 census, the population was 13,755. [1] The parish seat and largest city is Winnfield. [2] The parish was founded in 1852. [3] It is last in alphabetical order of Louisiana's sixty-four parishes. Winn is separated from Natchitoches Parish along U.S. Highway 71 by Saline Bayou, the first blackwater protected waterway in the American South.
Winn Parish was established in 1852 from lands which had belonged to the parishes of Catahoula, Natchitoches, and Rapides. [3]
During the Civil War, David Pierson, a young attorney, was elected to represent the parish at the Secession Convention called in January 1861 in Baton Rouge by Governor Thomas Overton Moore. Pierson voted against secession and refused, along with several others, to change his "no" vote at the end of the process when asked to do so to make the final tally unanimous.[ citation needed ]
That these conscripts refused to fight for the Confederacy is understandable considering that Union support was higher in north Louisiana, and especially high in Winn Parish. [4] The Confederate States Army defeated a Union detachment sent to destroy a salt works in the parish. Winn Parish contributed to the $80,000 raised to build fortifications on the nearby Red River. [5]
After the war, bandits roamed the Natchez Trace or Harrisonburg Road that ran through the lower part of the parish. Among the worst were the West and Kimbrell clan. For seven years they preyed especially on travelers and migrants passing through the area. [6]
In April 1873, white Democrats forming a militia from Winn Parish joined with ex-Confederate veterans from Rapides and Grant parishes against Republican blacks in the Colfax massacre in neighboring Grant Parish. [7] [8] They attacked freedmen defending the parish courthouse and two Republican officeholders in the aftermath to the disputed gubernatorial election of 1872. Among the 80–150 blacks killed were at least 50 who had surrendered; a total of three white men were killed in the confrontation. [9] [10] [11] [12]
According to the U.S. Census Bureau, the parish has a total area of 957 square miles (2,480 km2), of which 950 square miles (2,500 km2) is land and 6.7 square miles (17 km2) (0.7%) is water. [13]
| Census | Pop. | Note | %± |
|---|---|---|---|
| 1860 | 6,876 | — | |
| 1870 | 4,954 | −28.0% | |
| 1880 | 5,846 | 18.0% | |
| 1890 | 7,082 | 21.1% | |
| 1900 | 9,648 | 36.2% | |
| 1910 | 18,357 | 90.3% | |
| 1920 | 16,119 | −12.2% | |
| 1930 | 14,766 | −8.4% | |
| 1940 | 16,923 | 14.6% | |
| 1950 | 16,119 | −4.8% | |
| 1960 | 16,034 | −0.5% | |
| 1970 | 16,369 | 2.1% | |
| 1980 | 17,253 | 5.4% | |
| 1990 | 16,269 | −5.7% | |
| 2000 | 16,894 | 3.8% | |
| 2010 | 15,313 | −9.4% | |
| 2020 | 13,755 | −10.2% | |
| U.S. Decennial Census [15] 1790–1960 [16] 1900–1990 [17] 1990–2000 [18] 2010 [19] | |||
As of the 2020 census, the parish had a population of 13,755, 5,181 households, and 3,661 families residing there. [20]
The median age was 40.1 years; 20.7% of residents were under the age of 18 and 18.7% of residents were 65 years of age or older. For every 100 females there were 113.0 males, and for every 100 females age 18 and over there were 115.5 males age 18 and over. [20]
The racial makeup of the parish was 62.5% White, 25.6% Black or African American, 0.6% American Indian and Alaska Native, 1.3% Asian, 0.1% Native Hawaiian and Pacific Islander, 6.3% from some other race, and 3.6% from two or more races. Hispanic or Latino residents of any race comprised 7.4% of the population. [21]
34.0% of residents lived in urban areas, while 66.0% lived in rural areas. [22]
There were 5,181 households in the parish, of which 29.0% had children under the age of 18 living in them. Of all households, 41.4% were married-couple households, 21.6% were households with a male householder and no spouse or partner present, and 32.2% were households with a female householder and no spouse or partner present. About 32.3% of all households were made up of individuals and 15.1% had someone living alone who was 65 years of age or older. [20]
There were 6,339 housing units, of which 18.3% were vacant. Among occupied housing units, 71.5% were owner-occupied and 28.5% were renter-occupied. The homeowner vacancy rate was 0.9% and the rental vacancy rate was 6.9%. [20]
| Race / Ethnicity (NH = Non-Hispanic) | Pop 1980 [23] | Pop 1990 [24] | Pop 2000 [25] | Pop 2010 [26] | Pop 2020 [27] | % 1980 | % 1990 | % 2000 | % 2010 | % 2020 |
|---|---|---|---|---|---|---|---|---|---|---|
| White alone (NH) | 12,281 | 11,270 | 11,100 | 10,108 | 8,498 | 71.18% | 69.27% | 65.70% | 66.01% | 61.78% |
| Black or African American alone (NH) | 4,820 | 4,775 | 5,396 | 4,666 | 3,518 | 27.94% | 29.35% | 31.94% | 30.47% | 25.58% |
| Native American or Alaska Native alone (NH) | 20 | 61 | 81 | 96 | 77 | 0.12% | 0.37% | 0.48% | 0.63% | 0.56% |
| Asian alone (NH) | 20 | 22 | 27 | 39 | 172 | 0.12% | 0.14% | 0.16% | 0.25% | 1.25% |
| Native Hawaiian or Pacific Islander alone (NH) | x [28] | x [29] | 9 | 2 | 16 | x | x | 0.05% | 0.01% | 0.12% |
| Other race alone (NH) | 4 | 2 | 2 | 7 | 25 | 0.02% | 0.01% | 0.01% | 0.05% | 0.18% |
| Mixed race or Multiracial (NH) | x [30] | x [31] | 132 | 155 | 426 | x | x | 0.78% | 1.01% | 3.10% |
| Hispanic or Latino (any race) | 108 | 139 | 147 | 240 | 1,023 | 0.63% | 0.85% | 0.87% | 1.57% | 7.44% |
| Total | 17,253 | 16,269 | 16,894 | 15,313 | 13,755 | 100.00% | 100.00% | 100.00% | 100.00% | 100.00% |
Winn Parish School Board operates local public schools in all of the parish. [32]
Winn Correctional Center is in an unincorporated section of Winn Parish. Corrections Corporation of America, under contract with Louisiana Department of Public Safety and Corrections, once operated the prison. [33]
"A" Company of the Louisiana National Guard 199th Forward Support Battalion was previously located in Winnfield, Louisiana. The unit deployed twice to Iraq as part of the 256TH IBCT in 2004-5 and 2010. The unit's Winnfield Armory was closed.[ citation needed ]
Winn Parish, Louisiana, has distinguished itself as a notable indicator of statewide electoral outcomes. This parish has consistently mirrored the state's choice for the presidential winner in 15 consecutive elections since 1964.
| Year | Republican | Democratic | Third party(ies) | |||
|---|---|---|---|---|---|---|
| № | % | № | % | № | % | |
| 1912 | 26 | 2.50% | 600 | 57.75% | 413 | 39.75% |
| 1916 | 50 | 5.45% | 868 | 94.55% | 0 | 0.00% |
| 1920 | 291 | 19.70% | 963 | 65.20% | 223 | 15.10% |
| 1924 | 120 | 13.09% | 797 | 86.91% | 0 | 0.00% |
| 1928 | 533 | 31.46% | 1,161 | 68.54% | 0 | 0.00% |
| 1932 | 36 | 1.60% | 2,172 | 96.71% | 38 | 1.69% |
| 1936 | 254 | 9.60% | 2,393 | 90.40% | 0 | 0.00% |
| 1940 | 382 | 13.02% | 2,552 | 86.98% | 0 | 0.00% |
| 1944 | 881 | 38.57% | 1,403 | 61.43% | 0 | 0.00% |
| 1948 | 333 | 11.37% | 940 | 32.08% | 1,657 | 56.55% |
| 1952 | 1,915 | 46.47% | 2,206 | 53.53% | 0 | 0.00% |
| 1956 | 1,736 | 49.56% | 1,225 | 34.97% | 542 | 15.47% |
| 1960 | 1,839 | 44.90% | 1,108 | 27.05% | 1,149 | 28.05% |
| 1964 | 4,366 | 78.54% | 1,193 | 21.46% | 0 | 0.00% |
| 1968 | 1,050 | 16.68% | 1,230 | 19.54% | 4,015 | 63.78% |
| 1972 | 4,235 | 70.40% | 1,490 | 24.77% | 291 | 4.84% |
| 1976 | 3,209 | 46.58% | 3,543 | 51.43% | 137 | 1.99% |
| 1980 | 3,944 | 52.26% | 3,411 | 45.20% | 192 | 2.54% |
| 1984 | 4,934 | 63.85% | 2,633 | 34.08% | 160 | 2.07% |
| 1988 | 4,165 | 59.02% | 2,699 | 38.25% | 193 | 2.73% |
| 1992 | 2,932 | 38.84% | 3,537 | 46.85% | 1,080 | 14.31% |
| 1996 | 2,803 | 37.56% | 3,779 | 50.64% | 881 | 11.80% |
| 2000 | 4,028 | 63.32% | 2,167 | 34.07% | 166 | 2.61% |
| 2004 | 4,366 | 67.10% | 2,056 | 31.60% | 85 | 1.31% |
| 2008 | 4,632 | 68.40% | 2,047 | 30.23% | 93 | 1.37% |
| 2012 | 4,541 | 69.50% | 1,919 | 29.37% | 74 | 1.13% |
| 2016 | 4,608 | 72.32% | 1,644 | 25.80% | 120 | 1.88% |
| 2020 | 4,619 | 74.20% | 1,543 | 24.79% | 63 | 1.01% |
| 2024 | 4,437 | 76.75% | 1,292 | 22.35% | 52 | 0.90% |
{{cite book}}: CS1 maint: multiple names: authors list (link) CS1 maint: numeric names: authors list (link)