![]() | |||||||||||||||||
| |||||||||||||||||
| |||||||||||||||||
Kane: 50–60% 60–70% 70–80% 80–90% >90% Freed: 40–50% 50–60% 60–70% | |||||||||||||||||
|
Elections in Pennsylvania |
---|
![]() |
![]() |
The Pennsylvania Attorney General election of 2012 was held on November 6, 2012. The primary election was held on April 24. [1] [2]
Party | Candidate | Votes | % | |
---|---|---|---|---|
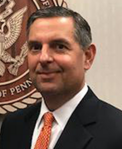
Republican | David J. Freed | 659,077 | 100.0% | |
Total votes | 659,077 | 100.0% |
Party | Candidate | Votes | % | |
---|---|---|---|---|
Democratic | Kathleen Kane | 375,500 | 52.82% | |
Democratic | Patrick Murphy | 335,438 | 47.18% | |
Total votes | 710,938 | 100.0% |
Party | Candidate | Votes | % | ±% | |
---|---|---|---|---|---|
Democratic | Kathleen Kane | 3,125,557 | 56.14% | +10.44% | |
Republican | David Freed | 2,313,506 | 41.56% | −10.82% | |
Libertarian | Marakay Rogers | 128,140 | 2.30% | +0.38% | |
Total votes | 5,567,203 | 100.0% | |||
Democratic gain from Republican |
Kane won 13 of the 18 congressional districts, including eight that elected Republicans. [14]
District | Kane | Freed | Representative |
---|---|---|---|
1st | 83% | 16% | Bob Brady |
2nd | 90% | 9% | Chaka Fattah |
3rd | 48% | 49% | Mike Kelly |
4th | 45% | 52% | Jason Altmire |
Scott Perry | |||
5th | 47.8% | 48.4% | Glenn Thompson |
6th | 50% | 47% | Jim Gerlach |
7th | 50% | 49% | Pat Meehan |
8th | 51% | 47% | Mike Fitzpatrick |
9th | 46% | 51% | Bill Shuster |
10th | 45% | 53% | Tom Marino |
11th | 50% | 48% | Lou Barletta |
12th | 50% | 47% | Mark Critz |
Keith Rothfus | |||
13th | 68% | 31% | Allyson Schwartz |
14th | 72% | 25% | Mike Doyle |
15th | 52% | 46% | Charlie Dent |
16th | 49.0% | 48.7% | Joe Pitts |
17th | 62% | 36% | Tim Holden |
Matt Cartwright | |||
18th | 49% | 48% | Tim Murphy |