1944 United States presidential election in Pennsylvania

Last updated

1944 United States presidential election in Pennsylvania
Flag of Pennsylvania.svg
  1940 November 7, 1944 1948  
  1944 portrait of FDR (1)(small).jpg Dewey circa 1946 (cropped).jpg
Nominee Franklin D. Roosevelt Thomas E. Dewey
Party Democratic Republican
Home state New York New York
Running mate Harry S. Truman John W. Bricker
Electoral vote350
Popular vote1,940,4791,835,054
Percentage51.14%48.36%

Pennsylvania Presidential Election Results 1944.svg
County Results

President before election

Franklin D. Roosevelt
Democratic

Elected President

Franklin D. Roosevelt
Democratic

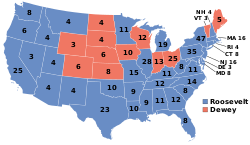
The 1944 United States presidential election in Pennsylvania took place on November 7, 1944, as part of the 1944 United States presidential election. Voters chose 35 representatives, or electors to the Electoral College, who voted for president and vice president.

Contents

Pennsylvania voted to give Democratic nominee, President Franklin D. Roosevelt a record fourth term, over the Republican nominee, New York Governor Thomas E. Dewey. Roosevelt won Pennsylvania by a slim margin of 2.78%.

Results

1944 United States presidential election in Pennsylvania [1]
PartyCandidateVotesPercentageElectoral votes
Democratic Franklin D. Roosevelt (incumbent)1,940,47951.14%35
Republican Thomas E. Dewey 1,835,05448.36%0
Socialist Norman Thomas 11,7210.31%0
Prohibition Claude Watson 5,7500.15%0
Industrial Government Edward Teichert1,7890.05%0
Totals3,794,793100.00%35

Results by county

CountyFranklin Delano Roosevelt
Democratic
Thomas Edmund Dewey
Republican
Various candidates
Other parties
MarginTotal votes cast [2]
# %# %# %# %
Adams 5,88139.91%8,78759.63%670.45%-2,906-19.72%14,735
Allegheny 350,69057.09%261,21842.52%2,3930.39%89,47214.56%614,301
Armstrong 10,20242.54%13,65656.94%1260.53%-3,454-14.40%23,984
Beaver 32,74357.79%23,55541.57%3600.64%9,18816.22%56,658
Bedford 5,17537.11%8,70362.40%680.49%-3,528-25.30%13,946
Berks 43,88953.91%35,27443.33%2,2472.76%8,61510.58%81,410
Blair 18,00341.76%24,92557.82%1780.41%-6,922-16.06%43,106
Bradford 5,52328.86%13,47270.40%1420.74%-7,949-41.54%19,137
Bucks 17,82340.76%25,63458.62%2700.62%-7,811-17.86%43,727
Butler 12,37738.75%19,34160.55%2260.71%-6,964-21.80%31,944
Cambria 39,67658.22%28,20341.39%2640.39%11,47316.84%68,143
Cameron 1,11539.08%1,72960.60%90.32%-614-21.52%2,853
Carbon 11,06052.74%9,83746.91%730.35%1,2235.83%20,970
Centre 8,06444.21%10,04855.08%1300.71%-1,984-10.88%18,242
Chester 18,54840.84%26,65558.70%2080.46%-8,107-17.85%45,411
Clarion 5,26339.10%8,09860.16%990.74%-2,835-21.06%13,460
Clearfield 13,61748.92%13,98650.24%2330.84%-369-1.33%27,836
Clinton 5,70348.85%5,91550.66%570.49%-212-1.82%11,675
Columbia 9,64750.63%9,33649.00%700.37%3111.63%19,053
Crawford 9,21637.48%15,20561.83%1700.69%-5,989-24.35%24,591
Cumberland 12,06840.25%17,78259.30%1340.45%-5,714-19.06%29,984
Dauphin 30,68440.51%44,72559.05%3330.44%-14,041-18.54%75,742
Delaware 64,02144.67%78,53354.80%7550.53%-14,512-10.13%143,309
Elk 6,09751.63%5,64547.80%670.57%4523.83%11,809
Erie 32,91247.99%35,24751.40%4190.61%-2,335-3.40%68,578
Fayette 35,09361.04%21,94538.17%4510.78%13,14822.87%57,489
Forest 67333.02%1,34465.95%211.03%-671-32.92%2,038
Franklin 8,80739.58%13,38060.13%630.28%-4,573-20.55%22,250
Fulton 1,75845.58%2,08454.03%150.39%-326-8.45%3,857
Greene 8,39259.13%5,74740.49%530.37%2,64518.64%14,192
Huntingdon 4,13133.53%8,10665.80%830.67%-3,975-32.26%12,320
Indiana 8,86337.83%14,38861.42%1750.75%-5,525-23.58%23,426
Jefferson 6,42536.62%10,97062.52%1520.87%-4,545-25.90%17,547
Juniata 2,66643.05%3,51256.71%150.24%-846-13.66%6,193
Lackawanna 59,19055.54%47,26144.34%1270.12%11,92911.19%106,578
Lancaster 27,35337.64%44,88861.77%4320.59%-17,535-24.13%72,673
Lawrence 17,33147.33%18,88651.57%4031.10%-1,555-4.25%36,620
Lebanon 11,81843.52%15,20656.00%1290.48%-3,388-12.48%27,153
Lehigh 29,13447.73%31,58451.75%3150.52%-2,450-4.01%61,033
Luzerne 73,67451.81%67,98447.81%5410.38%5,6904.00%142,199
Lycoming 15,65843.81%19,88655.64%1970.55%-4,228-11.83%35,741
McKean 6,49234.90%11,98864.45%1210.65%-5,496-29.55%18,601
Mercer 16,58945.57%19,60653.85%2120.58%-3,017-8.29%36,407
Mifflin 5,69347.63%6,20551.92%540.45%-512-4.28%11,952
Monroe 5,49046.81%6,20252.88%370.32%-712-6.07%11,729
Montgomery 47,81537.70%78,26061.71%7520.59%-30,445-24.01%126,827
Montour 2,21244.71%2,72755.12%80.16%-515-10.41%4,947
Northampton 32,58454.75%26,64344.76%2920.49%5,9419.98%59,519
Northumberland 20,33347.90%21,99551.81%1220.29%-1,662-3.92%42,450
Perry 3,26536.16%5,72263.37%430.48%-2,457-27.21%9,030
Philadelphia 496,36758.70%346,38040.96%2,8830.34%149,98717.74%845,630
Pike 1,40834.33%2,67465.20%190.46%-1,266-30.87%4,101
Potter 1,89429.58%4,47469.86%360.56%-2,580-40.29%6,404
Schuylkill 35,85246.72%40,67153.00%2210.29%-4,819-6.28%76,744
Snyder 1,79523.89%5,69675.81%230.31%-3,901-51.92%7,514
Somerset 10,28738.96%16,03960.74%790.30%-5,752-21.78%26,405
Sullivan 1,32941.60%1,85858.15%80.25%-529-16.56%3,195
Susquehanna 4,21232.20%8,81967.42%490.37%-4,607-35.22%13,080
Tioga 3,24823.69%10,38175.73%790.58%-7,133-52.04%13,708
Union 1,70423.25%5,58576.19%410.56%-3,881-52.95%7,330
Venango 6,42629.69%14,91668.91%3041.40%-8,490-39.22%21,646
Warren 4,44032.05%9,27666.96%1370.99%-4,836-34.91%13,853
Washington 46,02362.17%27,61537.30%3920.53%18,40824.87%74,030
Wayne 2,79325.22%8,24274.43%390.35%-5,449-49.21%11,074
Westmoreland 61,05758.17%43,20241.16%7050.67%17,85517.01%104,964
Wyoming 1,98230.11%4,58169.60%190.29%-2,599-39.49%6,582
York 38,22653.72%32,61745.84%3150.44%5,6097.88%71,158
Totals1,940,47951.14%1,835,05448.36%19,2600.51%105,4252.78%3,794,793

Counties that flipped from Democratic to Republican

Counties that flipped from Republican to Democratic

See also

References

  1. David Leip. "1944 Presidential General Election Results – Pennsylvania". Dave Leip’s U.S. Election Atlas. Retrieved March 24, 2018.
  2. Scammon, Richard M. (compiler); America at the Polls: A Handbook of Presidential Election Statistics 1920-1964; pp. 383-384 ISBN   0405077114