![]() | ||||||||||||||||||||||||||
| ||||||||||||||||||||||||||
| ||||||||||||||||||||||||||
![]() County Results
| ||||||||||||||||||||||||||
|
Elections in Pennsylvania |
---|
![]() |
![]() |
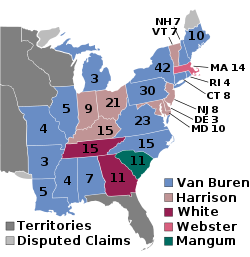
A presidential election was held in Pennsylvania on November 4, 1836 as part of the 1836 United States presidential election. [1] Voters chose 30 representatives, or electors to the Electoral College, who voted for President and Vice President.
Pennsylvania voted for the Democratic candidate, Martin Van Buren, over the Whig candidate, William Henry Harrison. Van Buren won Pennsylvania by a narrow margin of 2.36%. The result would ultimately prove decisive in Van Buren's victory; had Harrison won the state, then Van Buren would not have achieved a majority in the Electoral College, meaning that the election would have been decided in the House of Representatives.
1836 United States presidential election in Pennsylvania [2] | |||||
---|---|---|---|---|---|
Party | Candidate | Votes | Percentage | Electoral votes | |
Democratic | Martin Van Buren | 91,457 | 51.18% | 30 | |
Whig | William Henry Harrison | 87,235 | 48.82% | 0 | |
Totals | 178,692 | 100.0% | 30 | ||
County [3] | Martin Van Buren Democratic | William Henry Harrison Whig | Margin | Total votes cast | |||
---|---|---|---|---|---|---|---|
# | % | # | % | # | % | ||
Adams | 1,186 | 43.83% | 1,520 | 56.17% | -334 | -12.34% | 2,706 |
Allegheny | 3,074 | 45.90% | 3,623 | 54.10% | -549 | -8.20% | 6,697 |
Armstrong | 1,528 | 60.11% | 1,014 | 39.89% | 514 | 20.22% | 2,542 |
Beaver | 1,075 | 34.11% | 2,077 | 65.89% | -1,002 | -31.78% | 3,152 |
Bedford | 1,587 | 45.25% | 1,920 | 54.75% | -333 | -9.50% | 3,507 |
Berks | 4,967 | 75.82% | 1,584 | 24.18% | 3,383 | 51.64% | 6,551 |
Bradford | 1,462 | 49.01% | 1,521 | 50.99% | -59 | -1.98% | 2,983 |
Bucks | 3,081 | 48.37% | 3,289 | 51.63% | -208 | -3.26% | 6,370 |
Butler | 1,008 | 46.37% | 1,166 | 53.63% | -158 | -7.26% | 2,174 |
Cambria | 450 | 44.82% | 554 | 55.18% | -104 | -10.36% | 1,004 |
Centre | 1,809 | 66.19% | 924 | 33.81% | 885 | 32.38% | 2,733 |
Chester | 3,277 | 45.15% | 3,981 | 54.85% | -704 | -9.70% | 7,258 |
Clearfield | 499 | 63.73% | 284 | 36.27% | 215 | 27.46% | 783 |
Columbia | 1,560 | 74.14% | 544 | 25.86% | 1,016 | 48.28% | 2,104 |
Crawford | 1,614 | 56.71% | 1,232 | 43.29% | 382 | 13.42% | 2,846 |
Cumberland | 1,904 | 52.89% | 1,696 | 47.11% | 208 | 5.78% | 3,600 |
Dauphin | 1,372 | 40.77% | 1,993 | 59.23% | -621 | -18.46% | 3,365 |
Delaware | 1,030 | 45.70% | 1,224 | 54.30% | -194 | -8.60% | 2,254 |
Erie | 1,312 | 38.07% | 2,134 | 61.93% | -822 | -23.86% | 3,446 |
Fayette | 2,016 | 54.71% | 1,669 | 45.29% | 347 | 9.42% | 3,685 |
Franklin | 2,155 | 45.56% | 2,575 | 54.44% | -420 | -8.88% | 4,730 |
Greene | 1,138 | 55.43% | 915 | 44.57% | 223 | 10.86% | 2,053 |
Huntingdon | 1,340 | 33.77% | 2,628 | 66.23% | -1,288 | -32.46% | 3,968 |
Indiana | 692 | 37.18% | 1,169 | 62.82% | -477 | -25.64% | 1,861 |
Jefferson | 244 | 51.59% | 229 | 48.41% | 15 | 3.18% | 473 |
Juniata | 627 | 51.27% | 596 | 48.73% | 31 | 2.54% | 1,223 |
Lancaster | 4,144 | 39.87% | 6,250 | 60.13% | -2,106 | -20.26% | 10,394 |
Lebanon | 1,168 | 43.99% | 1,487 | 56.01% | -319 | -12.02% | 2,655 |
Lehigh | 1,987 | 52.69% | 1,784 | 47.31% | 203 | 5.38% | 3,771 |
Luzerne | 2,008 | 58.66% | 1,415 | 41.34% | 593 | 17.32% | 3,423 |
Lycoming | 1,705 | 64.51% | 938 | 35.49% | 767 | 29.02% | 2,643 |
McKean | 150 | 63.83% | 85 | 36.17% | 65 | 27.66% | 235 |
Mercer | 1,253 | 38.63% | 1,991 | 61.37% | -738 | -22.74% | 3,244 |
Mifflin | 917 | 55.08% | 748 | 44.92% | 169 | 10.16% | 1,665 |
Monroe | 796 | 82.74% | 166 | 17.26% | 630 | 65.48% | 962 |
Montgomery | 3,446 | 58.86% | 2,409 | 41.14% | 1,037 | 17.72% | 5,855 |
Northampton | 2,378 | 62.51% | 1,426 | 37.49% | 952 | 25.02% | 3,804 |
Northumberland | 1,421 | 66.62% | 712 | 33.38% | 709 | 33.24% | 2,133 |
Perry | 1,107 | 70.06% | 473 | 29.94% | 634 | 40.12% | 1,580 |
Philadelphia (City) | 3,028 | 34.51% | 5,747 | 65.49% | -2,719 | -30.98% | 8,755 |
Philadelphia (County) | 7,957 | 54.90% | 6,536 | 45.10% | 1,421 | 9.80% | 14,493 |
Pike | 358 | 89.50% | 42 | 10.50% | 316 | 79.00% | 400 |
Potter | 162 | 72.97% | 60 | 27.03% | 102 | 45.94% | 222 |
Schuylkill | 1,380 | 66.76% | 687 | 33.24% | 693 | 33.52% | 2,067 |
Somerset | 511 | 21.15% | 1,905 | 78.85% | -1,394 | -57.70% | 2,416 |
Susquehanna | 1,145 | 57.22% | 856 | 42.78% | 289 | 14.44% | 2,001 |
Tioga | 1,027 | 71.97% | 400 | 28.03% | 627 | 43.94% | 1,427 |
Union | 1,143 | 46.26% | 1,328 | 53.74% | -185 | -7.48% | 2,471 |
Venango | 967 | 61.71% | 600 | 38.29% | 367 | 23.42% | 1,567 |
Warren | 498 | 66.22% | 254 | 33.78% | 244 | 32.44% | 752 |
Washington | 2,445 | 46.57% | 2,805 | 53.43% | -360 | -6.86% | 5,250 |
Wayne | 724 | 68.05% | 340 | 31.95% | 384 | 36.10% | 1,064 |
Westmoreland | 2,878 | 62.52% | 1,725 | 37.48% | 1,153 | 25.04% | 4,603 |
York | 2,756 | 57.89% | 2,005 | 42.11% | 751 | 15.78% | 4,761 |
Totals | 91,466 | 51.18% | 87,235 | 48.82% | 4,231 | 2.36% | 178,701 |