Clarion County, Pennsylvania | |
|---|---|
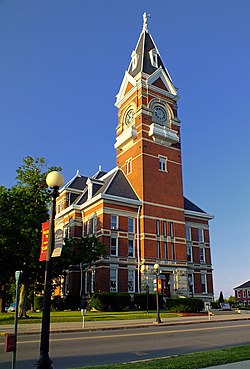 Clarion County Courthouse | |
 Flag  Seal Logo | |
 Location within the U.S. state of Pennsylvania | |
| Coordinates: 41°11′N79°25′W / 41.19°N 79.42°W | |
| Country | |
| State | |
| Founded | March 11, 1839 |
| Named after | Clarion River |
| Seat | Clarion |
| Largest borough | Clarion |
| Area | |
• Total | 610 sq mi (1,600 km2) |
| • Land | 601 sq mi (1,560 km2) |
| • Water | 9.0 sq mi (23 km2) 1.5% |
| Population (2020) | |
• Total | 37,241 |
| 36,855 | |
| • Density | 61.3/sq mi (23.7/km2) |
| Time zone | UTC−5 (Eastern) |
| • Summer (DST) | UTC−4 (EDT) |
| Congressional district | 15th |
| Website | www |
| Designated | April 26, 1982 [2] |
Clarion County is a county in the Commonwealth of Pennsylvania. As of the 2020 census, the population was 37,241. [3] Its county seat is Clarion. [4] The county was formed on March 11, 1839, from parts of Venango and Armstrong counties. Clarion County is entirely defined as part of the Pittsburgh media market. The county is part of the North Central region of the commonwealth. [a]
Contents
- Geography
- Adjacent counties
- Parks
- Major highways
- Demographics
- 2020 census
- Government
- Voter registration
- County commissioners
- Other county officials
- State senate
- State House of Representatives
- United States House of Representatives
- United States Senate
- Education
- Colleges and universities
- Public school districts
- Intermediate unit
- Technical school
- Private schools
- Communities
- Boroughs
- Townships
- Census-designated places
- Population ranking
- Notable people
- See also
- References


