2012 United States presidential election in South Dakota

Last updated

2012 United States presidential election in South Dakota
Flag of South Dakota.svg
  2008 November 6, 2012 2016  
  Mitt Romney by Gage Skidmore 6 cropped.jpg President Barack Obama, 2012 portrait crop.jpg
Nominee Mitt Romney Barack Obama
Party Republican Democratic
Home state Massachusetts Illinois
Running mate Paul Ryan Joe Biden
Electoral vote30
Popular vote210,610145,039
Percentage57.89%39.87%

South Dakota Presidential Election Results 2012.svg
County Results

President before election

Barack Obama
Democratic

Elected President

Barack Obama
Democratic

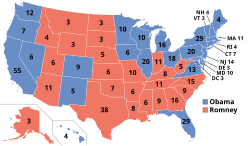
The 2012 United States presidential election in South Dakota took place on November 6, 2012, as part of the 2012 United States presidential election in which all 50 states plus the District of Columbia participated. South Dakota voters chose three electors to represent them in the Electoral College via a popular vote pitting incumbent Democratic President Barack Obama and his running mate, Vice President Joe Biden, against Republican challenger and former Massachusetts Governor Mitt Romney and his running mate, Congressman Paul Ryan.

Contents

Prior to the election, all seventeen news organizations making predictions for the election considered this a state Romney would win, or otherwise considered as a safe red state. South Dakota has not voted for a Democratic presidential nominee since Lyndon B. Johnson carried it in his 44-state landslide in 1964. South Dakota, just as all of the other states in the Great Plains, is among the most Republican states in the country. According to a 2012 Gallup poll, South Dakota is the 9th most conservative state in the country, with Republicans having an 11 percentage point advantage over Democrats in terms of party affiliation or identification. [1] It is also the 10th whitest state in the country as of 2012, at 83.8%, [2] and has the 4th highest gun ownership rate in the country at 56.6%, according to The Washington Post. [3] Both of these voting blocs are relatively solid for the Republican Party. [4]

While Obama lost the state by only 8.41% in 2008, illustrating a potential resurgence of Democratic strength among the agrarian population as seen in states such as Iowa, the state was returned to the safe Republican column in 2012. Romney won South Dakota by an 18.02% margin of victory. Romney was able to win back southeast Dakota: Obama became competitive there in 2008, when he won Minnehaha County (and many of its suburbs), home to the state's largest city of Sioux Falls, by only 587 votes. [5] Romney carried upwards of 60% of the vote in many counties, with his best performance in the West River. He also flipped Brown County, where Aberdeen is.

Obama's best performance was in majority Native American counties in the west of the state. He carried 93.35% of the vote in Shannon County (now known as Oglala Lakota), home to the Pine Ridge Reservation and the Oglala Lakota tribe. The counties of Buffalo; Dewey; and Todd, where the Crow Creek; Cheyenne River and Standing Rock; and Rosebud reservations are located, respectively, also delivered great margins to the president. Clay County, home to the University of South Dakota, was the only county in the southeast to vote for Obama.

As of the 2024 presidential election, this is the last time in which the Democratic candidate won Corson County, Day County, Marshall County, and Roberts County.

Primary elections

Democratic primary

Republican primary

2012 South Dakota Republican presidential primary
Flag of South Dakota.svg
  2008 June 5, 2012 (2012-06-05) 2016  
  Mitt Romney by Gage Skidmore 6 cropped.jpg Ron Paul by Gage Skidmore 3 (crop 2).jpg
Candidate Mitt Romney Ron Paul
Home state Massachusetts Texas
Delegate count250
Popular vote34,0336,704
Percentage66.05%13.01%

  Rick Santorum by Gage Skidmore.jpg NOTA Option Logo 3x4.svg
Candidate Rick Santorum Uncommitted
Home state Pennsylvania N/A
Delegate count00
Popular vote5,9162,797
Percentage11.48%5.43%

South Dakota Republican primary results by county, 2012.svg
South Dakota results by county
  Mitt Romney
(Note: Italicization indicates a withdrawn candidacy)

The Republican primary took place on June 5, 2012. [6] 25 delegates will be chosen, for a total of 28 delegates to go to the national convention.

2012 South Dakota Republican primary
CandidateVotesPercentageDelegates
Mitt Romney 34,03366.1%25
Ron Paul 6,70413.01%0
Rick Santorum 5,91611.48%0
Uncommitted2,7975.43%0
Newt Gingrich 2,0744.03%0
Unpledged delegates:3
Total:51,524100.0%28
Key:Withdrew prior to contest

General election

Predictions

SourceRankingAs of
Huffington Post [7] Safe RNovember 6, 2012
CNN [8] Safe RNovember 6, 2012
New York Times [9] Safe RNovember 6, 2012
Washington Post [10] Safe RNovember 6, 2012
RealClearPolitics [11] Solid RNovember 6, 2012
Sabato's Crystal Ball [12] Solid RNovember 5, 2012
FiveThirtyEight [13] Solid RNovember 6, 2012

Results

2012 United States presidential election in South Dakota [14]
PartyCandidateRunning mateVotesPercentageElectoral votes
Republican Mitt Romney Paul Ryan 210,61057.89%3
Democratic Barack Obama (incumbent) Joe Biden (incumbent)145,03939.87%0
Libertarian Gary Johnson Jim Gray 5,7951.59%0
Constitution Virgil Goode Jim Clymer2,3710.65%0
Totals363,815100.00%3

By county

County [15] Mitt Romney
Republican
Barack Obama
Democratic
Gary Johnson
Libertarian
Virgil Goode
Constitution
MarginTotal votes cast
#%#%#%#%#%
Aurora 80457.43%55639.71%271.93%130.93%24817.72%1,400
Beadle 4,23058.24%2,88139.67%1071.47%450.62%1,34918.57%7,263
Bennett 62652.04%54845.55%181.50%110.91%786.49%1,203
Bon Homme 1,83059.53%1,16737.96%551.79%220.72%66321.57%3,074
Brookings 6,22050.16%5,82746.99%2532.04%1000.81%3933.17%12,400
Brown 8,32151.79%7,25045.12%4092.55%880.55%1,0716.67%16,068
Brule 1,49963.01%82434.64%371.56%190.80%67528.37%2,379
Buffalo 16625.90%47273.63%30.47%00.00%-306-47.73%641
Butte 3,07373.03%1,00023.81%942.23%390.93%2,07149.22%4,208
Campbell 61678.27%15319.44%121.52%60.76%46358.83%787
Charles Mix 2,23059.25%1,48339.40%300.80%210.56%74719.85%3,764
Clark 1,06758.59%71339.15%271.48%140.77%35419.44%1,821
Clay 2,14741.02%2,95556.46%1072.04%250.48%-808-15.44%5,234
Codington 6,69658.10%4,58839.81%1691.47%710.62%2,10818.29%11,524
Corson 51542.92%64854.00%302.50%70.58%-133-11.08%1,200
Custer 3,06267.74%1,33529.54%831.84%400.88%1,72738.20%4,520
Davison 4,75759.68%3,04238.16%1251.57%470.59%1,71521.52%7,971
Day 1,32045.95%1,49752.11%331.15%230.80%-177-6.16%2,873
Deuel 1,17554.12%94143.34%321.47%231.06%23410.78%2,171
Dewey 66334.99%1,20763.69%150.79%100.53%-544-28.70%1,895
Douglas 1,33478.93%33219.64%160.95%80.47%1,00259.29%1,690
Edmunds 1,26465.29%62232.13%371.91%130.67%64233.16%1,936
Fall River 2,25864.22%1,14032.42%752.13%431.22%1,11831.80%3,516
Faulk 76567.88%33129.37%221.95%90.80%43438.51%1,127
Grant 2,03456.41%1,49341.40%481.33%310.86%54115.01%3,606
Gregory 1,50770.06%59927.85%311.44%140.65%90842.21%2,151
Haakon 94086.08%13812.64%80.73%60.55%80273.44%1,092
Hamlin 1,80364.55%92132.98%471.68%220.79%88231.57%2,793
Hand 1,24267.21%57531.11%211.14%100.54%66736.10%1,848
Hanson 1,62767.34%76031.46%160.66%130.54%86735.88%2,416
Harding 63886.33%8211.10%162.17%30.41%55675.23%739
Hughes 5,21964.00%2,78634.16%1071.31%430.53%2,43329.84%8,155
Hutchinson 2,45171.56%92326.95%250.73%260.76%1,52844.61%3,425
Hyde 53172.44%18925.78%111.50%20.27%34246.66%733
Jackson 66159.76%42638.52%90.81%100.90%23521.24%1,106
Jerauld 53853.48%45244.93%111.09%50.50%868.55%1,006
Jones 49080.46%10817.73%91.48%20.33%38262.73%609
Kingsbury 1,45155.64%1,09241.87%451.73%200.77%35913.77%2,608
Lake 3,41954.40%2,72443.34%981.56%440.70%69511.06%6,285
Lawrence 7,02561.85%3,97334.98%2622.31%990.87%3,05226.87%11,359
Lincoln 13,61162.00%7,98236.36%2611.19%980.45%5,62925.64%21,952
Lyman 93359.46%60538.56%241.53%70.45%32820.90%1,569
Marshall 88944.74%1,06153.40%291.46%80.40%-172-8.66%1,987
McCook 1,65563.34%90534.63%331.26%200.77%75028.71%2,613
McPherson 92175.80%27222.39%120.99%100.82%64953.41%1,215
Meade 7,56669.95%2,92827.07%2141.98%1091.01%4,63842.88%10,817
Mellette 38149.54%37548.76%50.65%81.04%60.78%769
Miner 63655.79%47942.02%181.58%70.61%15713.77%1,140
Minnehaha 40,34252.68%34,67445.28%1,1181.46%4490.59%5,6687.40%76,583
Moody 1,53550.61%1,42947.12%471.55%220.73%1063.49%3,033
Pennington 28,23263.49%15,12534.02%8161.84%2910.65%13,10729.47%44,464
Perkins 1,20575.79%31920.06%392.45%271.70%88655.73%1,590
Potter 1,02974.51%33924.55%100.72%30.22%69049.96%1,381
Roberts 1,88344.24%2,30254.09%420.99%290.68%-419-9.85%4,256
Sanborn 68861.70%38934.89%221.97%161.43%29926.81%1,115
Shannon 1885.98%2,93793.39%140.45%60.19%-2,749-87.41%3,145
Spink 1,67054.92%1,30042.75%541.78%170.56%37012.17%3,041
Stanley 1,06369.03%43528.25%332.14%90.58%62840.78%1,540
Sully 61374.94%18622.74%161.96%30.37%42752.20%818
Todd 49819.94%1,97679.13%110.44%120.48%-1,478-59.19%2,497
Tripp 1,90570.79%73727.39%230.85%260.97%1,16843.40%2,691
Turner 2,71564.49%1,41133.52%471.12%370.88%1,30430.97%4,210
Union 4,69861.85%2,78236.62%811.07%350.46%1,91625.23%7,596
Walworth 1,73170.31%67127.25%411.67%190.77%1,06043.06%2,462
Yankton 5,49555.09%4,22642.37%1992.00%540.54%1,26912.72%9,974
Ziebach 31441.26%43957.69%60.79%20.26%-125-16.43%761
Totals210,61057.89%145,03939.87%5,7951.59%2,3710.65%65,57118.02%363,815
County Flips:
Democratic
Hold
Republican
Hold
Gain from Democratic South Dakota County Flips 2012.svg
County Flips:
Counties that flipped from Democratic to Republican

By congressional district

South Dakota has only one congressional district because of its small population compared to other states. This district, called the at-large district because it covers the entire state, is equivalent to the statewide election results.

DistrictRomneyObamaRepresentative
At-large 57.89%39.87% Kristi Noem

See also

References

  1. Jones, Jeffrey M. (February 2, 2012). "More States Move to GOP in 2011". Gallup. Retrieved November 27, 2020.
  2. "2012 American Community Survey 1-Year Estimates". American FactFinder, U.S. Census Bureau. Archived from the original on February 12, 2020. Retrieved March 23, 2014.
  3. Cochran, Laura (May 26, 2006). "Gun Ownership by State". The Washington Post . Retrieved November 27, 2020.
  4. Cohen, Micah (August 24, 2012). "In South Dakota, Only the Farm Trumps Conservatism". FiveThirtyEight . Retrieved November 27, 2020.
  5. "South Dakota - Election Results 2008 - The New York Times". www.nytimes.com. Retrieved November 27, 2020.
  6. "Primary and Caucus Printable Calendar". CNN . Retrieved January 12, 2012.
  7. "Huffington Post Election Dashboard". HuffPost . Archived from the original on August 13, 2013.
  8. "America's Choice 2012 Election Center: CNN Electoral Map". CNN . Archived from the original on January 19, 2013.
  9. "Election 2012 - The Electoral Map: Building a Path to Victory". The New York Times . Archived from the original on July 8, 2012.
  10. "2012 Presidential Election Results" . The Washington Post. Archived from the original on July 26, 2012.
  11. "RealClearPolitics - 2012 Election Maps - Battle for White House". Archived from the original on June 8, 2011.
  12. "PROJECTION: OBAMA WILL LIKELY WIN SECOND TERM".
  13. "Nate Silver's political calculations predict 2012 election outcome".
  14. "South Dakota Secretary of State" . Retrieved December 9, 2012.
  15. Our Campaigns; SD US Presidential Election Race, November 06, 2012