Faulk County, South Dakota

Last updated

Faulk County
FAULK COUNTY COURTHOUSE, FAULK, SD.jpg
Faulk County Courthouse in July 2013
Map of South Dakota highlighting Faulk County.svg
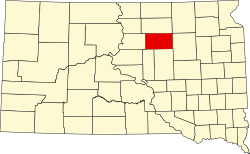
Location within the U.S. state of South Dakota
South Dakota in United States.svg
South Dakota's location within the U.S.
Coordinates: 45°04′N99°09′W / 45.07°N 99.15°W / 45.07; -99.15
CountryFlag of the United States.svg United States
StateFlag of South Dakota.svg  South Dakota
Founded1873 (created)
1883 (organized)
Named after Andrew Jackson Faulk
Seat Faulkton
Largest cityFaulkton
Area
  Total
1,006 sq mi (2,610 km2)
  Land982 sq mi (2,540 km2)
  Water24 sq mi (60 km2)  2.4%
Population
 (2020)
  Total
2,125
  Estimate 
(2024)
2,136 Increase2.svg
  Density2.1/sq mi (0.82/km2)
Time zone UTC−6 (Central)
  Summer (DST) UTC−5 (CDT)
Congressional district At-large

Faulk County is a county in the U.S. state of South Dakota. As of the 2020 census, the population was 2,125. [1] Its county seat is Faulkton. [2] The county was founded in 1873 and organized in 1883. [3] It is named for Andrew Jackson Faulk, the third Governor of Dakota Territory. [4]

Contents

Geography

The terrain of Faulk County consists of low rolling hills, largely devoted to agriculture, sloping to the east. The highest point of the terrain is the county's SW corner, at 1,916 ft (584 m) ASL. [5] The county has a total area of 1,006 square miles (2,610 km2), of which 982 square miles (2,540 km2) is land and 24 square miles (62 km2) (2.4%) is water. [6]

Major highways

Adjacent counties

Protected areas

Lakes

  • Clark Lake
  • Lake Creabard
  • Lake Faulkton
  • North Scatterwood Lake (partial)
  • South Scatterwood Lake
  • Zell Lake

Demographics

Historical population
CensusPop.Note
1880 4
1890 4,062101,450.0%
1900 3,547−12.7%
1910 6,71689.3%
1920 6,442−4.1%
1930 6,8957.0%
1940 5,168−25.0%
1950 4,752−8.0%
1960 4,397−7.5%
1970 3,893−11.5%
1980 3,327−14.5%
1990 2,744−17.5%
2000 2,640−3.8%
2010 2,364−10.5%
2020 2,125−10.1%
2024 (est.)2,136 [7] 0.5%
U.S. Decennial Census [8]
1790–1960 [9] 1900–1990 [10]
1990–2000 [11] 2010–2020 [1]

2020 census

As of the 2020 census, there were 2,125 people, 761 households, and 476 families residing in the county. [12] The population density was 2.2 inhabitants per square mile (0.85/km2). There were 1,022 housing units.

2010 census

As of the 2010 census, there were 2,364 people, 869 households, and 532 families in the county. The population density was 2.4 inhabitants per square mile (0.93/km2). There were 1,136 housing units at an average density of 1.2 units per square mile (0.46 units/km2). The racial makeup of the county was 98.9% white, 0.1% Asian, 0.1% American Indian, 0.1% black or African American, 0.0% from other races, and 0.7% from two or more races. Those of Hispanic or Latino origin made up 0.8% of the population. In terms of ancestry, 70.0% were German, 9.6% were Irish, 7.1% were English, 5.7% were Norwegian, and 4.3% were American.

Of the 869 households, 20.6% had children under the age of 18 living with them, 54.9% were married couples living together, 4.1% had a female householder with no husband present, 38.8% were non-families, and 36.1% of all households were made up of individuals. The average household size was 2.15 and the average family size was 2.79. The median age was 46.9 years.

The median income for a household in the county was $38,203 and the median income for a family was $55,234. Males had a median income of $40,641 versus $23,571 for females. The per capita income for the county was $21,898. About 14.4% of families and 17.9% of the population were below the poverty line, including 15.3% of those under age 18 and 14.3% of those age 65 or over.

Communities

City

Towns

Census-designated places

Unincorporated communities

Townships

  • Arcade
  • Bryant
  • Centerville
  • Clark
  • Devoe
  • Ellisville
  • Elroy
  • Emerson
  • Enterprise
  • Fairview
  • Freedom
  • Hillsdale
  • Irving
  • Lafoon
  • Latham
  • Myron
  • O'Neil
  • Orient
  • Pioneer
  • Pulaski
  • Saratoga
  • Seneca
  • Sherman
  • Tamworth
  • Thirteen
  • Union
  • Wesley
  • Zell

Politics

Faulk County voters have largely voted Republican for several decades. In only two national elections since 1944 has the county selected the Democratic Party candidate (as of 2024).

United States presidential election results for Faulk County, South Dakota [13]
Year Republican Democratic Third party(ies)
No.%No.%No.%
2024 92081.42%18316.19%272.39%
2020 96481.56%19816.75%201.69%
2016 85876.74%20418.25%565.01%
2012 76567.88%33129.37%312.75%
2008 73962.00%42635.74%272.27%
2004 94569.03%41830.53%60.44%
2000 90468.02%38829.19%372.78%
1996 72652.27%49335.49%17012.24%
1992 65845.89%48834.03%28820.08%
1988 84253.94%71445.74%50.32%
1984 1,12465.89%57933.94%30.18%
1980 1,30066.84%52026.74%1256.43%
1976 86844.81%1,06354.88%60.31%
1972 1,00450.07%98649.18%150.75%
1968 99749.48%81940.65%1999.88%
1964 97444.29%1,22555.71%00.00%
1960 1,24054.31%1,04345.69%00.00%
1956 1,26052.17%1,15547.83%00.00%
1952 1,61968.69%73831.31%00.00%
1948 1,05451.49%97147.44%221.07%
1944 1,09054.88%89645.12%00.00%
1940 1,43154.41%1,19945.59%00.00%
1936 1,11143.48%1,40454.95%401.57%
1932 1,14138.94%1,74359.49%461.57%
1928 1,90762.46%1,13537.18%110.36%
1924 1,11256.08%27713.97%59429.95%
1920 1,34165.51%34616.90%36017.59%
1916 75952.89%62943.83%473.28%
1912 00.00%61547.38%68352.62%
1908 83562.55%42131.54%795.92%
1904 72775.41%16517.12%727.47%
1900 61865.05%30231.79%303.16%
1896 43064.08%23735.32%40.60%
1892 47363.75%10714.42%16221.83%

See also

References

  1. 1 2 "State & County QuickFacts". United States Census Bureau. Retrieved March 21, 2024.
  2. "Find a County". National Association of Counties. Archived from the original on May 31, 2011. Retrieved June 7, 2011.
  3. "Dakota Territory, South Dakota, and North Dakota: Individual County Chronologies". Dakota Territory Atlas of Historical County Boundaries. The Newberry Library. 2006. Archived from the original on April 2, 2018. Retrieved March 29, 2015.
  4. Gannett, Henry (1905). The Origin of Certain Place Names in the United States. Govt. Print. Off. p.  124.
  5. ""Find at Altitude" Google Maps (accessed February 2, 2019)". Archived from the original on May 21, 2019. Retrieved February 3, 2019.
  6. "2010 Census Gazetteer Files". United States Census Bureau. August 22, 2012. Retrieved March 24, 2015.
  7. "County Population Totals and Components of Change: 2020-2024" . Retrieved March 15, 2025.
  8. "U.S. Decennial Census". United States Census Bureau. Retrieved July 20, 2014.
  9. "Historical Census Browser". University of Virginia Library. 2007. Archived from the original on December 12, 2009. Retrieved July 20, 2014.
  10. Forstall, Richard L. (March 27, 1995). "Population of Counties by Decennial Census: 1900 to 1990". United States Census Bureau. Archived from the original on February 19, 1999. Retrieved July 20, 2014.
  11. "Census 2000 PHC-T-4. Ranking Tables for Counties: 1990 and 2000" (PDF). United States Census Bureau. Archived (PDF) from the original on March 27, 2010. Retrieved July 20, 2014.
  12. "US Census Bureau, Table P16: Household Type". United States Census Bureau. Retrieved March 21, 2024.
  13. Leip, David. "Atlas of US Presidential Elections". uselectionatlas.org. Retrieved April 15, 2018.

45°04′N99°09′W / 45.07°N 99.15°W / 45.07; -99.15