Union County, South Dakota | |
|---|---|
| | |
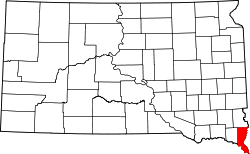
| Location within the U.S. state of South Dakota | |
| Coordinates: 42°50′N96°39′W / 42.83°N 96.65°W | |
| Country | |
| State | |
| Founded | April 10, 1862 |
| Seat | Elk Point |
| Largest community | Dakota Dunes |
| Area | |
• Total | 467 sq mi (1,210 km2) |
| • Land | 461 sq mi (1,190 km2) |
| • Water | 6.6 sq mi (17 km2) 1.4% |
| Population (2020) | |
• Total | 16,811 |
• Estimate (2024) | 17,402 |
| • Density | 36.5/sq mi (14.1/km2) |
| Time zone | UTC−6 (Central) |
| • Summer (DST) | UTC−5 (CDT) |
| Congressional district | At-large |
| Website | unioncountysd |
Union County is the southernmost county in the U.S. state of South Dakota. As of the 2020 census, the population was 16,811, [1] making it the 13th most populous county in South Dakota. Its county seat has been Elk Point since April 30, 1865. [2] Originally named Cole County, its name was changed to Union on January 7, 1864, because of Civil War sentiment.
Union County is part of the Sioux City metropolitan area. The Progressive Farmer rated Union County second in the "2006 Best Place to Live Survey" in the U.S., because "its schools are good, its towns neat and its people friendly".
Founded on April 10, 1862, as Cole County, it was renamed Union County on January 7, 1864, when its boundaries were changed to encompass land previously part of neighboring Lincoln County. The county seat was moved from Richland to Elk Point on April 30, 1865.
Union County lies on the southeast corner of South Dakota. Its east boundary line abuts the west boundary line of the State of Iowa (across the Big Sioux River), and its south/southwest boundary line abuts the north boundary line of the State of Nebraska (across the Missouri River). The Brule Creek flows southeasterly across the central part of the county, emptying into the Big Sioux. The county terrain consists of rolling hills, devoted to agriculture except around built-up areas. [3] The terrain slopes to the south and east; its highest point is near its northwest corner, at 1,509 ft (460 m) ASL. [4] The county has a total area of 467 square miles (1,210 km2), of which 461 square miles (1,190 km2) is land and 6.6 square miles (17 km2) (1.4%) is water. [5] It is the fifth-smallest county in South Dakota by area.
Source: [3]
Source: [3]
| Census | Pop. | Note | %± |
|---|---|---|---|
| 1870 | 3,507 | — | |
| 1880 | 6,813 | 94.3% | |
| 1890 | 9,130 | 34.0% | |
| 1900 | 11,153 | 22.2% | |
| 1910 | 10,676 | −4.3% | |
| 1920 | 11,099 | 4.0% | |
| 1930 | 11,480 | 3.4% | |
| 1940 | 11,675 | 1.7% | |
| 1950 | 10,792 | −7.6% | |
| 1960 | 10,197 | −5.5% | |
| 1970 | 9,643 | −5.4% | |
| 1980 | 10,938 | 13.4% | |
| 1990 | 10,189 | −6.8% | |
| 2000 | 12,584 | 23.5% | |
| 2010 | 14,399 | 14.4% | |
| 2020 | 16,811 | 16.8% | |
| 2024 (est.) | 17,402 | [6] | 3.5% |
| U.S. Decennial Census [7] 1790–1960 [8] 1900–1990 [9] 1990–2000 [10] 2010–2020 [1] | |||
As of the 2020 census, there were 16,811 people, 6,822 households, and 4,613 families in the county. [11] The population density was 36.5 inhabitants per square mile (14.1/km2). [11] Of the residents, 24.7% were under the age of 18 and 18.8% were 65 years of age or older; the median age was 41.0 years. For every 100 females there were 102.2 males, and for every 100 females age 18 and over there were 101.9 males. [11]
The racial makeup of the county was 90.0% White, 1.0% Black or African American, 0.9% American Indian and Alaska Native, 1.5% Asian, 1.5% from some other race, and 5.0% from two or more races. Hispanic or Latino residents of any race comprised 3.9% of the population. [12]
There were 6,822 households in the county, of which 30.8% had children under the age of 18 living with them and 19.5% had a female householder with no spouse or partner present. About 26.9% of all households were made up of individuals and 12.1% had someone living alone who was 65 years of age or older. [11]
There were 7,215 housing units, of which 5.4% were vacant. Among occupied housing units, 72.9% were owner-occupied and 27.1% were renter-occupied. The homeowner vacancy rate was 1.4% and the rental vacancy rate was 4.0%. [11]
As of the 2010 census, there were 14,399 people, 5,756 households, and 4,043 families in the county. The population density was 31.3 inhabitants per square mile (12.1/km2). There were 6,280 housing units at an average density of 13.6 per square mile (5.3/km2). The racial makeup of the county was 95.5% white, 0.9% Asian, 0.7% black or African American, 0.6% American Indian, 0.1% Pacific islander, 0.7% from other races, and 1.6% from two or more races. Those of Hispanic or Latino origin made up 2.1% of the population. In terms of ancestry, 42.0% were German, 18.2% were Norwegian, 17.7% were Irish, 7.9% were English, 6.8% were Swedish, and 3.7% were American.
Of the 5,756 households, 32.8% had children under the age of 18 living with them, 58.9% were married couples living together, 7.5% had a female householder with no husband present, 29.8% were non-families, and 25.1% of all households were made up of individuals. The average household size was 2.49 and the average family size was 2.98. The median age was 40.2 years.
The median income for a household in the county was $59,889 and the median income for a family was $71,308. Males had a median income of $42,702 versus $31,993 for females. The per capita income for the county was $33,783. About 3.9% of families and 4.9% of the population were below the poverty line, including 4.3% of those under age 18 and 10.5% of those age 65 or over.
Union County voters were more politically centered in times past, but the county has selected the Republican Party candidate in every national election since 2000 (as of 2024).
| Year | Republican | Democratic | Third party(ies) | |||
|---|---|---|---|---|---|---|
| № | % | № | % | № | % | |
| 1892 | 860 | 43.30% | 241 | 12.13% | 885 | 44.56% |
| 1896 | 1,297 | 46.24% | 1,491 | 53.16% | 17 | 0.61% |
| 1900 | 1,571 | 53.00% | 1,358 | 45.82% | 35 | 1.18% |
| 1904 | 1,813 | 68.31% | 730 | 27.51% | 111 | 4.18% |
| 1908 | 1,392 | 56.63% | 1,009 | 41.05% | 57 | 2.32% |
| 1912 | 0 | 0.00% | 965 | 39.08% | 1,504 | 60.92% |
| 1916 | 1,108 | 44.95% | 1,313 | 53.27% | 44 | 1.78% |
| 1920 | 1,942 | 66.17% | 841 | 28.65% | 152 | 5.18% |
| 1924 | 1,665 | 45.04% | 877 | 23.72% | 1,155 | 31.24% |
| 1928 | 2,415 | 53.19% | 2,106 | 46.39% | 19 | 0.42% |
| 1932 | 1,381 | 27.86% | 3,530 | 71.21% | 46 | 0.93% |
| 1936 | 1,845 | 31.89% | 3,520 | 60.85% | 420 | 7.26% |
| 1940 | 3,116 | 54.44% | 2,608 | 45.56% | 0 | 0.00% |
| 1944 | 2,501 | 54.87% | 2,057 | 45.13% | 0 | 0.00% |
| 1948 | 2,205 | 49.38% | 2,237 | 50.10% | 23 | 0.52% |
| 1952 | 3,393 | 67.35% | 1,645 | 32.65% | 0 | 0.00% |
| 1956 | 2,636 | 52.94% | 2,343 | 47.06% | 0 | 0.00% |
| 1960 | 2,688 | 53.56% | 2,331 | 46.44% | 0 | 0.00% |
| 1964 | 1,727 | 37.91% | 2,828 | 62.09% | 0 | 0.00% |
| 1968 | 2,212 | 49.70% | 2,014 | 45.25% | 225 | 5.06% |
| 1972 | 2,271 | 46.90% | 2,554 | 52.75% | 17 | 0.35% |
| 1976 | 2,297 | 47.26% | 2,540 | 52.26% | 23 | 0.47% |
| 1980 | 2,788 | 55.16% | 1,830 | 36.21% | 436 | 8.63% |
| 1984 | 2,431 | 51.98% | 2,221 | 47.49% | 25 | 0.53% |
| 1988 | 1,907 | 41.91% | 2,612 | 57.41% | 31 | 0.68% |
| 1992 | 1,784 | 35.00% | 2,210 | 43.36% | 1,103 | 21.64% |
| 1996 | 2,234 | 42.90% | 2,378 | 45.67% | 595 | 11.43% |
| 2000 | 3,265 | 56.57% | 2,358 | 40.85% | 149 | 2.58% |
| 2004 | 3,987 | 56.57% | 3,000 | 42.57% | 61 | 0.87% |
| 2008 | 4,310 | 55.97% | 3,244 | 42.12% | 147 | 1.91% |
| 2012 | 4,698 | 61.85% | 2,782 | 36.62% | 116 | 1.53% |
| 2016 | 5,290 | 66.99% | 2,227 | 28.20% | 380 | 4.81% |
| 2020 | 5,944 | 67.13% | 2,725 | 30.77% | 186 | 2.10% |
| 2024 | 6,160 | 69.40% | 2,548 | 28.71% | 168 | 1.89% |