Buffalo County, South Dakota

Last updated

Buffalo County
USACE Fort Thompson Big Bend Dam.jpg
Fort Thompson Big Bend Dam.
Map of South Dakota highlighting Buffalo County.svg
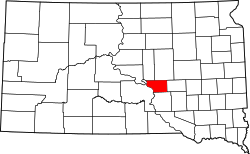
Location within the U.S. state of South Dakota
South Dakota in United States.svg
South Dakota's location within the U.S.
Coordinates: 44°02′39.502″N99°12′14.392″W / 44.04430611°N 99.20399778°W / 44.04430611; -99.20399778
CountryFlag of the United States.svg United States
StateFlag of South Dakota.svg  South Dakota
Founded1864 (created)
1871 (organized)
Named after American buffalo
Seat Gann Valley
Largest community Fort Thompson
Area
  Total
488 sq mi (1,260 km2)
  Land471 sq mi (1,220 km2)
  Water16 sq mi (40 km2)  3.4%
Population
 (2020)
  Total
1,948
  Estimate 
(2024)
1,825 Decrease2.svg
  Density4.0/sq mi (1.5/km2)
Time zone UTC−6 (Central)
  Summer (DST) UTC−5 (CDT)
Congressional district At-large
Website buffalo.sdcounties.org

Buffalo County is a county in the U.S. state of South Dakota. As of the 2020 census, the population was 1,948. [1] Its county seat is Gann Valley [2] which, at 10 people, is the least populous county seat in the United States. The county was created in 1864, and was organized in 1871 [3] as part of the Dakota Territory.

Contents

In 2010, the center of population of South Dakota was located in eastern Buffalo County. [4] The Crow Creek Indian Reservation, inhabited by the Crow Creek Sioux Tribe, makes up the majority of Buffalo County.

According to the 2013 Small Area Income and Poverty Estimates of the U.S. Census Bureau, about 41% of county residents live in poverty, making it the fifth-poorest county in South Dakota. This is a far higher poverty rate than the national poverty rate of 15.8%. Median household income in 2013 was $21,572, making it the lowest-earning county in South Dakota and the United States. [5]

In March 2019, the county unemployment rate was 3.9%; its ten-year peaks occurred in December 2006 (18.1%) and December 2009 (17.2%). [6] As of 2002, many homes lack kitchens and indoor plumbing. [7]

Geography

The Missouri River flows southerly along the county's western boundary. The county terrain consists of semi-arid rolling hills, generally sloping to the south and east. Some area is devoted to agriculture. The south and west parts of the county are drained by Crow Creek, which discharges into the river at the county's SW corner. The county has a total area of 488 square miles (1,260 km2), of which 471 square miles (1,220 km2) is land and 16 square miles (41 km2) (3.4%) is water. [8]

Major highways

Adjacent counties

Protected Areas

  • Pease State Game Production Area

Lakes

History

As first organized, the county occupied an extensive area, bounded on the north by Canada, southwest and west by the Missouri River, having Montana for a part of its northwest boundary, and comprising a large portion of the "Plateau du Coteau du Missouri", and a part of the Miniwakan or Devil's Lake. [9] Thus, its original boundary also contained a portion of the future North Dakota, which became a separate unit when the Dakota Territory was admitted into the Union in 1889 as two separate states.

Demographics

Historical population
CensusPop.Note
1870 246
1880 63−74.4%
1890 9931,476.2%
1900 1,79080.3%
1910 1,589−11.2%
1920 1,7157.9%
1930 1,93112.6%
1940 1,853−4.0%
1950 1,615−12.8%
1960 1,547−4.2%
1970 1,73912.4%
1980 1,7953.2%
1990 1,759−2.0%
2000 2,03215.5%
2010 1,912−5.9%
2020 1,9481.9%
2024 (est.)1,825 [10] −6.3%
U.S. Decennial Census [11]
1790–1960 [12] 1900–1990 [13]
1990–2000 [14] 2010–2020 [1]

2020 census

As of the 2020 census, there were 1,948 people, 497 households, and 393 families residing in the county. [15] The population density was 4.1 inhabitants per square mile (1.6/km2). There were 570 housing units.

2010 census

As of the 2010 census, there were 1,912 people, 532 households, and 407 families in the county. The population density was 4.1 inhabitants per square mile (1.6/km2). There were 609 housing units at an average density of 1.3 per square mile (0.50/km2). The racial makeup of the county was 84.0% Native American, 14.8% white, 0.2% black or African American, 0.1% Asian, 0.0% from other races, and 0.9% from two or more races. Those of Hispanic or Latino origin made up 1.8% of the population. In terms of ancestry, 5.6% were German, and 0.0% were American.

Of the 532 households, 55.6% had children under the age of 18 living with them, 33.1% were married couples living together, 33.1% had a female householder with no husband present, 23.5% were non-families, and 19.0% of all households were made up of individuals. The average household size was 3.59 and the average family size was 4.06. The median age was 25.0 years.

The median income for a household in the county was $27,926 and the median income for a family was $28,333. Males had a median income of $38,920 versus $18,542 for females. The per capita income for the county was $11,410. About 44.4% of families and 49.3% of the population were below the poverty line, including 58.2% of those under age 18 and 36.3% of those age 65 or over.

Communities

Census-designated places

Unincorporated communities

Township

Politics

Democratic Party nominees have won Buffalo County in every presidential election since 1956 except the 1980 and 1984 elections, which Ronald Reagan won. However, many people in Buffalo County are also socially conservative, with this county being the only one in the state to both vote for Kamala Harris for president and vote against 2024 South Dakota Amendment G, which would have established a right to abortion in South Dakota's constitution. [20]

United States presidential election results for Buffalo County, South Dakota [21]
Year Republican Democratic Third party(ies)
No.%No.%No.%
2024 16435.19%29162.45%112.36%
2020 18333.33%35264.12%142.55%
2016 17134.90%29660.41%234.69%
2012 16625.90%47273.63%30.47%
2008 15625.20%45473.34%91.45%
2004 22326.52%60371.70%151.78%
2000 14034.31%25662.75%122.94%
1996 13420.94%46572.66%416.41%
1992 13727.62%28256.85%7715.52%
1988 15130.82%33468.16%51.02%
1984 25351.21%23647.77%51.01%
1980 27259.65%14732.24%378.11%
1976 19444.70%24055.30%00.00%
1972 22144.47%27555.33%10.20%
1968 26147.11%26547.83%285.05%
1964 27835.69%50164.31%00.00%
1960 29446.82%33453.18%00.00%
1956 31449.68%31850.32%00.00%
1952 41361.46%25938.54%00.00%
1948 31348.01%33451.23%50.77%
1944 32456.45%25043.55%00.00%
1940 49155.42%39544.58%00.00%
1936 36846.29%41051.57%172.14%
1932 27029.64%63469.59%70.77%
1928 40551.01%38748.74%20.25%
1924 30941.53%22530.24%21028.23%
1920 20059.70%10130.15%3410.15%
1916 8030.19%18268.68%31.13%
1912 00.00%10553.85%9046.15%
1908 10558.99%6938.76%42.25%
1904 11860.51%4322.05%3417.44%
1900 8746.28%10053.19%10.53%
1896 6846.26%7953.74%00.00%
1892 7850.65%138.44%6340.91%

See also

Further reading

References

  1. 1 2 "State & County QuickFacts". United States Census Bureau. Retrieved March 21, 2024.
  2. "Find a County". National Association of Counties. Archived from the original on May 31, 2011. Retrieved June 7, 2011.
  3. "Dakota Territory, South Dakota, and North Dakota: Individual County Chronologies". Dakota Territory Atlas of Historical County Boundaries. The Newberry Library. 2006. Archived from the original on April 2, 2018. Retrieved March 28, 2015.
  4. "Centers of Population by State: 2010". United States Census Bureau. Archived from the original on January 3, 2014. Retrieved April 25, 2014.
  5. 2013 Small Area Income and Poverty Estimates, Interactive SAIPE Data and Mapping Tool, Bureau of the Census.
  6. Unemployment Rate in Buffalo County, SD, Federal Reserve Economic Data, Federal Reserve Bank of St. Louis.
  7. Cara Hetland, South Dakota has nation's poorest county, Minnesota Public Radio (October 1, 2002).
  8. "2010 Census Gazetteer Files". United States Census Bureau. August 22, 2012. Retrieved March 22, 2015.
  9. One or more of the preceding sentences incorporates text from a publication now in the public domain : Ripley, George; Dana, Charles A., eds. (1879). "Buffalo. III. A S. E. county of Dakota"  . The American Cyclopædia .
  10. "County Population Totals and Components of Change: 2020-2024" . Retrieved March 15, 2025.
  11. "U.S. Decennial Census". United States Census Bureau. Retrieved July 20, 2014.
  12. "Historical Census Browser". University of Virginia Library. 2007. Archived from the original on December 12, 2009. Retrieved July 20, 2014.
  13. Forstall, Richard L. (March 27, 1995). "Population of Counties by Decennial Census: 1900 to 1990". United States Census Bureau. Archived from the original on February 19, 1999. Retrieved July 20, 2014.
  14. "Census 2000 PHC-T-4. Ranking Tables for Counties: 1990 and 2000" (PDF). United States Census Bureau. Archived (PDF) from the original on March 27, 2010. Retrieved July 20, 2014.
  15. "US Census Bureau, Table P16: Household Type". United States Census Bureau. Retrieved March 21, 2024.
  16. Crow Creek SD Google Maps (accessed January 31, 2019)
  17. North Buffalo SD Google Maps (accessed January 31, 2019)
  18. Shelby SD Google Maps (accessed January 31, 2019)
  19. Southeast Buffalo SD Google Maps (accessed January 31, 2019)
  20. https://electionresults.sd.gov/resultsSW.aspx?type=BQ&map=CTY
  21. Leip, David. "Atlas of US Presidential Elections". uselectionatlas.org. Retrieved April 13, 2018.