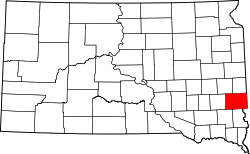
Minnehaha County is a county on the eastern border of the state of South Dakota. As of the 2020 census, the population was 197,214,[1] making it the state's most populous county, and was estimated to be 208,639 in 2024.[2] It contains over 22.56% of the state's population.[3] Its county seat is Sioux Falls,[4] South Dakota's most populous city. The county was created on April 5, 1862 and organized in 1868.[5] Its name was derived from the Sioux word Mnihaha, meaning "rapid water," or "waterfall" (often incorrectly translated as "laughing water").[6]
Minnehaha County lies on the east side of South Dakota. Its eastern boundary abuts Minnesota as well as the northern and western boundaries of Iowa. The Big Sioux River flows south-southeast through the east central part of the county. Its terrain consists of rolling hills, devoted to agriculture except around built-up areas, and dotted with lakes and ponds in its western portion.[7] Its terrain generally slopes southward, and the east and west edges slope to the river valley through the center of the county. Its highest point is in the northwest corner, at 1,752ft (534m) ASL.[8]
According to the United States Census Bureau, the county has a total area of 813.861 square miles (2,107.89km2), of which 806.847 square miles (2,089.72km2) is land and 7.014 square miles (18.17km2) (0.9%) is water.[9] It is the 13th largest county in South Dakota by total area.
U.S. Decennial Census[11] 1790–1960[12] 1900–1990[13] 1990–2000[14] 2010–2020[2]
As of the third quarter of 2024, the median home value in Minnehaha County was $305,100.[15]
As of the 2023 American Community Survey, there are 82,394 estimated households in Minnehaha County with an average of 2.37 persons per household. The county has a median household income of $76,074. Approximately 9.7% of the county's population lives at or below the poverty line. Minnehaha County has an estimated 74.2% employment rate, with 34.6% of the population holding a bachelor's degree or higher and 93.1% holding a high school diploma.[2]
The top five reported ancestries (people were allowed to report up to two ancestries, thus the figures will generally add to more than 100%) were English (87.2%), Spanish (5.6%), Indo-European (2.4%), Asian and Pacific Islander (1.4%), and Other (3.4%).
The median age in the county was 36.7 years.
Minnehaha County, South Dakota – racial and ethnic composition Note: the US Census treats Hispanic/Latino as an ethnic category. This table excludes Latinos from the racial categories and assigns them to a separate category. Hispanics/Latinos may be of any race.
As of the 2020 census, there were 197,214 people, 78,715 households, and 48,690 families residing in the county.[20] The population density was 244.4 inhabitants per square mile (94.4/km2). There were 83,717 housing units at an average density of 103.8 per square mile (40.1/km2). The racial makeup of the county was 80.29% White, 5.84% African American, 2.71% Native American, 2.34% Asian, 0.04% Pacific Islander, 2.85% from some other races and 5.91% from two or more races. Hispanic or Latino people of any race were 6.10% of the population.[21]
2010 census
As of the 2010 census, there were 169,468 people, 67,028 households, and 42,052 families in the county. The population density was 210.0 inhabitants per square mile (81.1/km2). There were 71,557 housing units at an average density of 88.7 per square mile (34.2/km2). The racial makeup of the county was 88.05% White, 3.78% African American, 2.48% Native American, 1.48% Asian, 0.08% Pacific Islander, 1.84% from some other races and 2.29% from two or more races. Hispanic or Latino people of any race were 4.12% of the population. In terms of ancestry, 43.8% were German, 17.7% were Norwegian, 11.6% were Irish, 6.8% were Dutch, 6.3% were English, and 3.2% were American.
Of the 67,028 households, 32.7% had children under the age of 18 living with them, 47.7% were married couples living together, 10.5% had a female householder with no husband present, 37.3% were non-families, and 29.3% of all households were made up of individuals. The average household size was 2.43 and the average family size was 3.03. The median age was 34.5 years.
The median income for a household in the county was $51,799 and the median income for a family was $64,645. Males had a median income of $40,187 versus $31,517 for females. The per capita income for the county was $26,392. About 6.9% of families and 9.7% of the population were below the poverty line, including 12.2% of those under age 18 and 7.6% of those age 65 or over.
Politics
Minnehaha is somewhat conservative for an urban county. Only four Democratic presidential candidates in five different elections have carried the county since 1940, and in only two of those elections the Democrat obtained a majority of the county's vote.
In the South Dakota Legislature, Sioux Falls falls into Districts 9-15, with each district electing two Representatives and one Senator. Only two out of seven districts (10th and 15th) are represented by Democrats.
United States presidential election results for Minnehaha County, South Dakota[22]
↑ Stewart, George R. (1945). Names on the Land. Random House. p.291. In the language of the Sioux, a waterfall was haha; water itself was minne. White men by a misunderstanding had coupled the two words, and produced Minnehaha Falls, a name thus meaning "water-waterfalls-falls". By a complete though natural misunderstanding of haha, the name had been romantically translated as Laughing Water
This page is based on this Wikipedia article Text is available under the CC BY-SA 4.0 license; additional terms may apply. Images, videos and audio are available under their respective licenses.