| ||||||||||||||||||||||||||||
All 70 Seats in the South Dakota House of Representatives 36 seats needed for a majority | ||||||||||||||||||||||||||||
---|---|---|---|---|---|---|---|---|---|---|---|---|---|---|---|---|---|---|---|---|---|---|---|---|---|---|---|---|
|
Elections in South Dakota |
---|
Elections to the South Dakota House of Representatives were held on November 3, 2020, as a part of the biennial elections in the U.S. state of South Dakota. All 70 seats were up for re-election. Each of the 70 seats are subdivided in two single-member districts. [1]
Primary elections were held on June 2, 2020. [2]
Source | Ranking | As of |
---|---|---|
The Cook Political Report [3] | Safe R | October 21, 2020 |
District 1 • District 2 • District 3 • District 4 • District 5 • District 6 • District 7 • District 8 • District 9 • District 10 • District 11 • District 12 • District 13 • District 14 • District 15 • District 16 • District 17 • District 18 • District 19 • District 20 • District 21 • District 22 • District 23 • District 24 • District 25 • District 26A • District 26B •District 27 • District 28A • District 28B •District 29 • District 30 • District 31 • District 32 • District 33 • District 34 • District 35 |
Party | Candidate | Votes | % | |
---|---|---|---|---|
Republican | Tamara St. John (incumbent) | 6,150 | 41.27% | |
Democratic | Jennifer Healy Keintz | 4,502 | 30.21% | |
Democratic | Steven McCleerey (incumbent) | 4,248 | 28.51% | |
Total votes | 14,901 | 100.0% | ||
Republican hold | ||||
Democratic hold | ||||
Party | Candidate | Votes | % | |
---|---|---|---|---|
Republican | Lana Greenfield (incumbent) | 6,428 | 50.18% | |
Republican | Kaleb Weis (incumbent) | 6,381 | 49.82% | |
Total votes | 12,809 | 100.0% | ||
Republican hold | ||||
Party | Candidate | Votes | % | |
---|---|---|---|---|
Republican | Drew Dennert (incumbent) | 7,108 | 34.24% | |
Republican | Carl E. Perry (incumbent) | 6,087 | 29.32% | |
Democratic | Leslie McLaughlin | 3,843 | 18.51% | |
Democratic | Justin Roemmick | 3,720 | 17.92% | |
Total votes | 20,758 | 100.0% |
Party | Candidate | Votes | % | |
---|---|---|---|---|
Republican | Fred Deutsch (incumbent) | 8,012 | 42.95% | |
Republican | John Mills | 7,001 | 37.53% | |
Democratic | Becky Holtquist | 3,642 | 19.52% | |
Total votes | 18,655 | 100.0% | ||
Republican hold | ||||
Party | Candidate | Votes | % | |
---|---|---|---|---|
Republican | Hugh Bartels (incumbent) | 7,311 | 54.18% | |
Republican | Nancy York (incumbent) | 6,182 | 45.82% | |
Total votes | 13,493 | 100.0% | ||
Republican hold | ||||
Party | Candidate | Votes | % | |
---|---|---|---|---|
Republican | Ernie Otten | 9,504 | 45.06% | |
Republican | Aaron Aylward | 6,504 | 30.84% | |
Democratic | Cody Ingle | 5,084 | 24.10% | |
Total votes | 21,092 | 100.0% | ||
Republican hold | ||||
Party | Candidate | Votes | % | |
---|---|---|---|---|
Republican | Tim Reed (incumbent) | 5,821 | 33.31% | |
Republican | Larry Tidemann | 5,235 | 29.95% | |
Democratic | Louise Snodgrass | 3,635 | 20.80% | |
Democratic | Bill Adamson | 2,786 | 15.94% | |
Total votes | 17,477 | 100.0% | ||
Republican hold | ||||
Party | Candidate | Votes | % | |
---|---|---|---|---|
Republican | Marli Wiese (incumbent) | 7,029 | 35.54% | |
Republican | Randy Gross (incumbent) | 6,327 | 31.99% | |
Democratic | Val Parsley | 4,260 | 21.54% | |
Democratic | John P. Kessinger | 2,162 | 10.93% | |
Total votes | 19,778 | 100.0% | ||
Republican hold | ||||
Party | Candidate | Votes | % | |
---|---|---|---|---|
Republican | Rhonda Milstead (incumbent) | 7,656 | 32.69% | |
Republican | Bethany Soye | 6,720 | 28.69% | |
Democratic | Michael Saba (incumbent) | 4,679 | 19.98% | |
Democratic | Toni Miller | 4,368 | 18.65% | |
Total votes | 23,423 | 100.0% | ||
Republican hold | ||||
Republican gain from Democratic | ||||
Party | Candidate | Votes | % | |
---|---|---|---|---|
Republican | Steven Haugaard (incumbent) | 6,527 | 37.40% | |
Republican | Doug Barthel (incumbent) | 6,188 | 35.46% | |
Democratic | Michelle L. Hentschel | 4,736 | 27.14% | |
Total votes | 17,451 | 100.0% | ||
Republican hold | ||||
Party | Candidate | Votes | % | |
---|---|---|---|---|
Republican | Chris Karr (incumbent) | 7,253 | 29.30% | |
Republican | Mark Willadsen (incumbent) | 7,172 | 28.97% | |
Democratic | Sheryl Johnson | 5,900 | 23.83% | |
Democratic | Margaret M Kuipers | 4,429 | 17.89% | |
Total votes | 24,754 | 100.0% | ||
Republican hold | ||||
Party | Candidate | Votes | % | |
---|---|---|---|---|
Republican | Greg Jamison | 6,799 | 37.82% | |
Republican | Arch Beal (incumbent) | 5,621 | 31.27% | |
Democratic | Erin Royer | 5,555 | 30.90% | |
Total votes | 17,975 | 100.0% | ||
Republican hold | ||||
Party | Candidate | Votes | % | |
---|---|---|---|---|
Republican | Sue Peterson (incumbent) | 6,746 | 28.22% | |
Republican | Richard Thomason | 6,215 | 26.00% | |
Democratic | Kelly Sullivan (incumbent) | 5,846 | 24.46% | |
Democratic | Norman B. Bliss | 5,094 | 21.31% | |
Total votes | 23,901 | 100.0% | ||
Republican hold | ||||
Republican gain from Democratic | ||||
Party | Candidate | Votes | % | |
---|---|---|---|---|
Republican | Taylor Rehfeldt | 6,933 | 28.49% | |
Democratic | Erin Healy (incumbent) | 6,388 | 26.25% | |
Republican | Tom Holmes | 5,782 | 23.76% | |
Democratic | Mike Huber | 5,228 | 21.49% | |
Total votes | 24,331 | 100.0% | ||
Republican hold | ||||
Democratic hold | ||||
Party | Candidate | Votes | % | |
---|---|---|---|---|
Democratic | Linda Duba (incumbent) | 3,918 | 28.86% | |
Democratic | Jamie Smith (incumbent) | 3,727 | 27.45% | |
Republican | Cole Heisey | 2,987 | 22.00% | |
Republican | Matt Rosburg | 2,943 | 21.68% | |
Total votes | 13,575 | 100.0% | ||
Democratic hold | ||||
Party | Candidate | Votes | % | |
---|---|---|---|---|
Republican | David Anderson (incumbent) | 8,383 | 56.29% | |
Republican | Kevin Jensen (incumbent) | 6,510 | 43.71% | |
Total votes | 14,893 | 100.0% | ||
Republican hold | ||||
Party | Candidate | Votes | % | |
---|---|---|---|---|
Republican | Sydney Davis | 5,278 | 31.25% | |
Republican | Richard Vasgaard | 4,786 | 28.34% | |
Democratic | Al Leber | 3,645 | 21.58% | |
Democratic | Caitlin F. Collier | 3,181 | 18.83% | |
Total votes | 16,890 | 100.0% | ||
Republican hold | ||||
Party | Candidate | Votes | % | |
---|---|---|---|---|
Republican | Mike Stevens | 6,778 | 57.02% | |
Democratic | Ryan Cwach (incumbent) | 5,109 | 42.98% | |
Total votes | 11,887 | 100.0% | ||
Republican hold | ||||
Democratic hold | ||||
Party | Candidate | Votes | % | |
---|---|---|---|---|
Republican | Kent Peterson (incumbent) | 8,503 | 56.43.% | |
Republican | Marty Overweg (incumbent) | 6,564 | 43.57% | |
Total votes | 15,057 | 100.0% | ||
Republican hold | ||||
Party | Candidate | Votes | % | |
---|---|---|---|---|
Republican | Paul Miskimins (incumbent) | 7,403 | 54.97% | |
Republican | Lance Koth (incumbent) | 6,064 | 45.03% | |
Total votes | 13,467 | 100.0% | ||
Republican hold | ||||
Party | Candidate | Votes | % | |
---|---|---|---|---|
Republican | Rocky Blare | 6,330 | 44.33% | |
Republican | Caleb Finck (incumbent) | 5,038 | 35.28% | |
Democratic | Jessica Hegge | 2,911 | 20.39% | |
Total votes | 14,279 | 100.0% | ||
Republican hold | ||||
Party | Candidate | Votes | % | |
---|---|---|---|---|
Republican | Roger D. Chase (incumbent) | 6,165 | 36.25% | |
Republican | Lynn Schneider | 5,855 | 34.42% | |
Democratic | Mark S Smith | 2,640 | 15.52% | |
Democratic | C. John McEnelly | 2,348 | 13.81% | |
Total votes | 17,008 | 100.0% | ||
Republican hold | ||||
Party | Candidate | Votes | % | |
---|---|---|---|---|
Republican | Spencer Gosch (incumbent) | 8,325 | 55.07% | |
Republican | Charlie Hoffman | 6,791 | 44.93% | |
Total votes | 15,116 | 100.0% | ||
Republican hold | ||||
Party | Candidate | Votes | % | |
---|---|---|---|---|
Republican | Will Mortenson | 8,410 | 43.63% | |
Republican | Mike Weisgram | 7,786 | 40.39% | |
Democratic | Amanda Bachmann | 3,079 | 15.97% | |
Total votes | 19,275 | 100.0% | ||
Republican hold | ||||
Party | Candidate | Votes | % | |
---|---|---|---|---|
Republican | Jon Hansen (incumbent) | 7,826 | 32.90% | |
Republican | Tom Pischke (incumbent) | 7,784 | 32.72% | |
Democratic | Jeff Barth | 4,460 | 18.75% | |
Democratic | Jared Nieuwenhuis | 3,720 | 15.64% | |
Total votes | 23,790 | 100.0% | ||
Republican hold | ||||
Party | Candidate | Votes | % | |
---|---|---|---|---|
Democratic | Shawn Bordeaux (incumbent) | 2,254 | 100.0% | |
Total votes | 2,254 | 100.0% | ||
Democratic hold | ||||
Party | Candidate | Votes | % | |
---|---|---|---|---|
Republican | Rebecca Reimer (incumbent) | 3,578 | 70.43% | |
Democratic | Tim Feliciano | 1,502 | 29.57% | |
Total votes | 5,080 | 100.0% | ||
Republican hold | ||||
Party | Candidate | Votes | % | |
---|---|---|---|---|
Republican | Liz Marty May | 3,320 | 36.75% | |
Democratic | Peri Pourier (incumbent) | 3,234 | 35.80% | |
Democratic | Ernest Weston Jr. | 2,480 | 27.45% | |
Total votes | 9,034 | 100.0% | ||
Republican hold | ||||
Democratic hold | ||||
Party | Candidate | Votes | % | |
---|---|---|---|---|
Democratic | Oren Lesmeister (incumbent) | 2,585 | 100.0% | |
Total votes | 2,585 | 100.0% | ||
Democratic hold | ||||
Party | Candidate | Votes | % | |
---|---|---|---|---|
Republican | J. Sam Marty (incumbent) | 4,847 | 100.0% | |
Total votes | 4,847 | 100.0% | ||
Republican hold | ||||
Party | Candidate | Votes | % | |
---|---|---|---|---|
Republican | Dean Wink | 8,167 | 46.08% | |
Republican | Kirk Chaffee (incumbent) | 6,381 | 36.01% | |
Independent | Jade Addison | 3,174 | 17.91% | |
Total votes | 17,722 | 100.0% | ||
Republican hold | ||||
Party | Candidate | Votes | % | |
---|---|---|---|---|
Republican | Trish Ladner | 8,668 | 50.68% | |
Republican | Tim Goodwin (incumbent) | 8,435 | 49.32% | |
Total votes | 17,103 | 100.0% | ||
Republican hold | ||||
Party | Candidate | Votes | % | |
---|---|---|---|---|
Republican | Scott Odenbach | 8,104 | 41.32% | |
Republican | Mary Fitzgerald | 6,920 | 35.28% | |
Democratic | Brooke Abdallah | 4,590 | 23.40% | |
Total votes | 19,614 | 100.0% | ||
Republican hold | ||||
Party | Candidate | Votes | % | |
---|---|---|---|---|
Republican | Chris P. Johnson (incumbent) | 6,391 | 32.38% | |
Republican | Becky Drury | 5,587 | 28.31% | |
Democratic | James Preston | 3,932 | 19.92% | |
Democratic | Toni Diamond | 3,826 | 19.39% | |
Total votes | 19,736 | 100.0% | ||
Republican hold | ||||
Party | Candidate | Votes | % | |
---|---|---|---|---|
Republican | Phil Jensen | 10,251 | 56.47% | |
Republican | Taffy Howard (incumbent) | 7,902 | 43.53% | |
Total votes | 18,153 | 100.0% | ||
Republican hold | ||||
Party | Candidate | Votes | % | |
---|---|---|---|---|
Republican | Mike Derby | 7,225 | 33.51% | |
Republican | Jess Olson (incumbent) | 6,756 | 31.33% | |
Democratic | Rick Stracqualursi | 3,806 | 17.65% | |
Democratic | Nick Anderson | 3,776 | 17.51% | |
Total votes | 21,563 | 100.0% | ||
Republican hold | ||||
Party | Candidate | Votes | % | |
---|---|---|---|---|
Republican | Tina Mulally (incumbent) | 5,777 | 34.37% | |
Republican | Tony Randolph (incumbent) | 5,375 | 31.98% | |
Democratic | David A. Hubbard | 2,916 | 17.35% | |
Democratic | Pat Cromwell | 2,740 | 16.30% | |
Total votes | 16,808 | 100.0% | ||
Republican hold | ||||
Dakota County is a county in the U.S. state of Nebraska. As of the 2020 United States Census, the population was 21,582. Its county seat is Dakota City.
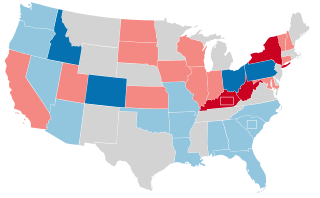
The 1956 United States Senate elections were elections for the United States Senate that coincided with the re-election of President Dwight D. Eisenhower. The 32 seats of Class 3 were contested in regular elections, and three special elections were held to fill vacancies. Although Democrats gained two seats in regular elections, the Republicans gained two seats in special elections, leaving the party balance of the chamber unchanged.
South Dakota's at-large congressional district is the sole congressional district for the state of South Dakota. Based on area, it is the fourth largest congressional district in the nation.
Elections were held in South Dakota on November 2, 2010. Primary elections took place on June 8, 2010 for the Democratic Party, Republican Party, and Constitution Party.
The 2004 South Dakota's at-large congressional district special election was held on July 12, 2004 to select the successor to Republican Representative Bill Janklow who resigned on July 11, 2004, following a conviction of vehicular manslaughter after an accident that had occurred months earlier, creating an open seat and necessitating a special election. Each party held a nominating convention to choose their nominee for the special election. Republicans selected state Senator Larry Diedrich over Barbara Everist, also a member of the South Dakota State Senate, as their nominee while Democrats chose attorney Stephanie Herseth, who had unsuccessfully challenged Janklow in 2002.
Brock L. Greenfield is an American politician serving as School and Public Lands Commissioner of South Dakota. He previously served as a Republican member of the South Dakota Senate. Greenfield was consecutively a member of the House for District 6 from January 2009 until January 11, 2013, and a member of the South Dakota Senate for District 6 from January 2001 until January 2009. Greenfield has represented District 2 since January 10, 2015.
Phil Jensen, is an American politician from Pennington County, South Dakota who is a current member of the South Dakota House of Representatives and has served as a Republican member of the South Dakota Senate representing District 33 from 2013 to 2021. Jensen served consecutively in the South Dakota Legislature from January 2009 until January 8, 2013 in the South Dakota House of Representatives District 33 seat. He supplements his legislative income as a cookware dealer.
A general election was held in the U.S. state of South Dakota on November 4, 2014. All of South Dakota's executive officers were up for election as well as a United States Senate seat and South Dakota's at-large seat in the United States House of Representatives. Primary elections were held on June 3, 2014.
The 2020 United States Senate election in South Dakota was held on November 3, 2020, to elect a member of the United States Senate to represent the State of South Dakota, concurrently with the 2020 U.S. presidential election, as well as other elections to the United States Senate, elections to the United States House of Representatives and various state and local elections. Incumbent Republican Senator Mike Rounds was reelected to a second term in office, overperforming Donald Trump in the concurrent presidential election by 4.93 points.
Dustin Michael Johnson is an American politician serving as the U.S. representative for South Dakota's at-large congressional district since 2019. A member of the Republican Party, he served as South Dakota Public Utilities Commissioner from 2005 to 2011, when he was appointed chief of staff to Governor Dennis Daugaard, a position he held until 2014. Between his state political career and congressional service, Johnson was the vice president of Vantage Point Solutions in Mitchell, South Dakota.
South Dakota state elections in 2020 were held on Tuesday, November 3, 2020. Its primary elections were held on June 2, 2020.
Elections are held in the U.S. state of South Dakota regularly.
Elections to the South Dakota Senate were held on November 3, 2020 as a part of the biennial elections in the U.S. state of South Dakota. Voters in 35 single-member constituencies elected members to the 93rd Senate. Elections were also held in the state for U.S. president, the U.S. Senate, the U.S. House, and the South Dakota House of Representatives.
The 2020 North Dakota Senate election were held on November 3, 2020, to elect members from all even-numbered seats of the North Dakota Senate. Primary elections were held on June 9, 2020.
Elections to the North Dakota House of Representatives were held on November 3, 2020. A total of 46 seats out of 94 were up for re-election.
The 2022 South Dakota House of Representatives elections were held on November 8, 2022, as part of the biennial 2022 United States elections. All 70 seats in the South Dakota House of Representatives were up for election. Primary elections were held on June 7, 2022. The elections coincided with elections for other offices in South Dakota, including the US Senate, US House, South Dakota Governor, South Dakota Secretary of State, South Dakota Attorney General, and the South Dakota Senate.
The 2022 South Dakota Senate elections were held on November 8, 2022, as part of the biennial 2022 United States elections. All 35 seats in the South Dakota Senate were up for election. Primary elections were held on June 7, 2022. The elections coincided with elections for other offices in South Dakota, including the US Senate, US House, South Dakota Governor, South Dakota Secretary of State, South Dakota Attorney General, and the South Dakota House.
South Dakota state elections in 2022 were held on Tuesday, November 8, 2022. Primary elections were held on June 7, 2022.
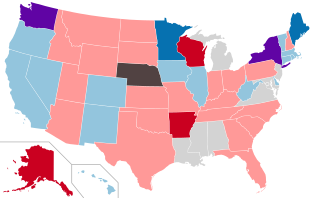
The 2016 United States state legislative elections were held on November 8, 2016, for 86 state legislative chambers in 44 states. Across the fifty states, approximately 65 percent of all upper house seats and 85 percent of all lower house seats were up for election. Nine legislative chambers in the five permanently-inhabited U.S. territories and the federal district of Washington, D.C. also held elections. The elections took place concurrently with several other federal, state, and local elections, including the presidential election, U.S. Senate elections, U.S. House elections, and gubernatorial elections.
The 2012 United States state legislative elections were held on November 6, 2012, for 86 state legislative chambers in 44 states. Across the fifty states, approximately 65 percent of all upper house seats and 85 percent of all lower house seats were up for election. Nine legislative chambers in the five permanently-inhabited U.S. territories and the federal district of Washington, D.C. also held elections. The elections took place concurrently with several other federal, state, and local elections, including the presidential election, U.S. Senate elections, U.S. House elections, and gubernatorial elections.