2020 Kansas House of Representatives election

Last updated

2020 Kansas House of Representatives election
Flag of Kansas.svg
 2018November 3, 2020 (2020-11-03) 2022  

All 125 seats in the Kansas House of Representatives
63 seats needed for a majority
 Majority partyMinority party
  3x4.svg Tom Sawyer debating on the house floor (cropped to show head and shoulders).jpg
Leader Ron Ryckman Jr. Tom Sawyer
Party Republican Democratic
Leader's seat78th district95th district
Seats before8441
Seats won8639
Seat changeIncrease2.svg 2Decrease2.svg 2
Popular vote789,261479,381
Percentage61.92%37.61%

2020 Kansas House of Representatives election results.svg
Results:
     Republican gain     Democratic gain
     Republican hold     Democratic hold

Speaker before election

Ray Merrick
Republican

Elected Speaker

Ron Ryckman Jr.
Republican

The 2020 Kansas House of Representatives elections took place as a part of the 2020 United States elections. All 125 seats in the Kansas House of Representatives were up for re-election. Representatives serve two year terms and are not term limited.

Contents

Results summary

Summary of the November 3, 2020 Kansas House of Representatives election results[ citation needed ]
PartyVotes %Seats+/– %
Republican Party 789,26161.92%86+268.8%
Democratic Party 479,38137.61%39-231.2%
Libertarian Party 3,8650.30%00%
Independent 2,1250.17%00%
Total1,274,632 %125

Predictions

SourceRankingAs of
The Cook Political Report [1] Likely ROctober 21, 2020

Close races

Districts where the margin of victory was under 10%:

  1. District 48, 0.46%
  2. District 102, 0.46%
  3. District 16, 0.48%
  4. District 49, 2.14%
  5. District 56, 2.36%
  6. District 15, 2.94%
  7. District 20, 3.1% (flip)
  8. District 30, 4.18%
  9. District 18, 4.7%
  10. District 78, 4.72%
  11. District 17, 5.06% (flip)
  12. District 14, 5.8%
  13. District 41, 6% (flip)
  14. District 28, 6.3%
  15. District 96, 6.52% (flip)
  16. District 33, 7.16%
  17. District 67, 7.44%
  18. District 3, 7.96% (flip)
  19. District 40, 8.08%
  20. District 87, 8.76%
  21. District 53, 9.74%
  22. District 72, 9.84% (flip)
  23. District 39, 9.56%

Results

District 1District 2District 3District 4District 5District 6District 7District 8District 9District 10District 11District 12District 13District 14District 15District 16District 17District 18District 19District 20District 21District 22District 23District 24District 25District 26District 27District 28District 29District 30District 31District 32District 33District 34District 35District 36District 37District 38District 39District 40District 41District 42District 43District 44District 45District 46District 47District 48District 49District 50District 51District 52District 53District 54District 55District 56District 57District 58District 59District 60District 61District 62District 63District 64District 65District 66District 67District 68District 69District 70District 71District 72District 73District 74District 75District 76District 77District 78District 79District 80District 81District 82District 83District 84District 85District 86District 87District 88District 89District 90District 91District 92District 93District 94District 95District 96District 97District 98District 99District 100District 101District 102District 103District 104District 105District 106District 107District 108District 109District 110District 111District 112District 113District 114District 115District 116District 117District 118District 119District 120District 121District 122District 123District 124District 125

District 1

District 1 [2]
PartyCandidateVotes%
Republican Michael Houser 8,381 100.00
Total votes8,381 100.00
Republican hold

District 2

District 2 [2]
PartyCandidateVotes%
Republican Ken Collins 6,759 62.16
Democratic Lynn D. Grant4,11537.84
Total votes10,874 100.00
Republican hold

District 3

District 3 [2]
PartyCandidateVotes%
Republican Chuck Smith 4,942 53.98
Democratic Monica Murnan (incumbent)4,21346.02
Total votes9,155 100.00
Republican gain from Democratic

District 4

District 4 [2]
PartyCandidateVotes%
Republican Trevor Jacobs 7,881 74.89
Democratic Bill Meyer2,64225.11
Total votes10,523 100.00
Republican hold

District 5

District 5 [2]
PartyCandidateVotes%
Republican Mark Samsel 8,061 77.34
Democratic Roger Sims2,36222.66
Total votes10,423 100.00
Republican hold

District 6

District 6 [2]
PartyCandidateVotes%
Republican Samantha Poetter 11,111 100.00
Total votes11,111 100.00
Republican hold

District 7

District 7 [2]
PartyCandidateVotes%
Republican Richard Proehl 7,795 100.00
Total votes7,795 100.00
Republican hold

District 8

District 8 [2]
PartyCandidateVotes%
Republican Chris Croft 12,649 100.00
Total votes12,649 100.00
Republican hold

District 9

District 9 [2]
PartyCandidateVotes%
Republican Kent Thompson 6,879 74.84
Democratic Alana Cloutier2,31225.16
Total votes9,191 100.00
Republican hold

District 10

District 10 [2]
PartyCandidateVotes%
Democratic Christina Haswood 9,446 100.00
Total votes9,446 100.00
Democratic hold

District 11

District 11 [2]
PartyCandidateVotes%
Republican Jim Kelly 7,467 100.00
Total votes7,467 100.00
Republican hold

District 12

District 12 [2]
PartyCandidateVotes%
Republican Doug Blex 8,908 100.00
Total votes8,908 100.00
Republican hold

District 13

District 13 [2]
PartyCandidateVotes%
Republican Joe Newland 7,633 77.20
Democratic Mark Pringle2,25422.80
Total votes9,887 100.00
Republican hold

District 14

District 14 [2]
PartyCandidateVotes%
Republican Charlotte Esau 8,539 52.40
Democratic Angela Schweller7,75747.60
Total votes16,296 100.00
Republican hold

District 15

District 15 [2]
PartyCandidateVotes%
Republican John Toplikar 5,361 51.47
Democratic Cole Fine5,05448.53
Total votes10,415 100.00
Republican hold

District 16

District 16 [2]
PartyCandidateVotes%
Democratic Linda Featherston 7,130 50.24
Republican Rashard Young7,06349.76
Total votes14,193 100.00
Democratic hold

District 17

District 17 [2]
PartyCandidateVotes%
Democratic Jo Ella Hoye 7,058 50.93
Republican Kristine Sapp6,35645.87
Libertarian Michael Kerner4433.20
Total votes13,857 100.00
Democratic gain from Republican

District 18

District 18 [2]
PartyCandidateVotes%
Democratic Cindy Neighbor 7,098 52.35
Republican Cathy Gordon6,46047.65
Total votes13,558 100.00
Democratic hold

District 19

District 19 [2]
PartyCandidateVotes%
Democratic Stephanie Clayton 12,369 100.00
Total votes12,369 100.00
Democratic gain from Republican

District 20

District 20 [2]
PartyCandidateVotes%
Democratic Mari-Lynn Poskin 8,249 51.55
Republican Jane Dirks7,75248.45
Total votes16,001 100.00
Democratic gain from Republican

District 21

District 21 [2]
PartyCandidateVotes%
Democratic Jerry Stogsdill 9,421 61.98
Republican Bob Reese5,77838.02
Total votes15,199 100.00
Democratic hold

District 22

District 22 [2]
PartyCandidateVotes%
Democratic Lindsay Vaughn 8,413 100.00
Total votes8,413 100.00
Democratic hold

District 23

District 23 [2]
PartyCandidateVotes%
Democratic Susan Ruiz 6,069 55.00
Republican Jeff Shull4,38639.75
Libertarian Matthew Clark5795.25
Total votes11,034 100.00
Democratic hold

District 24

District 24 [2]
PartyCandidateVotes%
Democratic Jarrod Ousley 9,545 100.00
Total votes9,545 100.00
Democratic hold

District 25

District 25 [2]
PartyCandidateVotes%
Democratic Rui Xu 12,177 100.00
Total votes12,177 100.00
Democratic hold

District 26

District 26 [2]
PartyCandidateVotes%
Republican Adam Thomas 9,758 61.28
Democratic W. Michael Shimeall6,16638.72
Total votes15,924 100.00
Republican hold

District 27

District 27 [2]
PartyCandidateVotes%
Republican Sean Tarwater 12,119 63.52
Democratic Sona Patel6,96136.48
Total votes19,080 100.00
Republican hold

District 28

District 28 [2]
PartyCandidateVotes%
Republican Carl Turner 7,638 53.15
Democratic Sally Jercha6,73246.85
Total votes14,370 100.00
Republican hold

District 29

District 29 [2]
PartyCandidateVotes%
Democratic Brett Parker 7,636 56.85
Republican Jerry Clinton5,79543.15
Total votes13,431 100.00
Democratic hold

District 30

District 30 [2]
PartyCandidateVotes%
Democratic Brandon Woodard 6,913 52.09
Republican Laura Williams6,35747.91
Total votes13,270 100.00
Democratic hold

District 31

District 31 [2]
PartyCandidateVotes%
Democratic Louis Ruiz 5,211 71.57
Republican Landon Griffith2,07028.43
Total votes7,281 100.00
Democratic hold

District 32

District 32 [2]
PartyCandidateVotes%
Democratic Pam Curtis 2,822 74.66
Republican Greg Conchola95825.34
Total votes3,780 100.00
Democratic hold

District 33

District 33 [2]
PartyCandidateVotes%
Democratic Tom Burroughs 5,156 48.73
Republican Jordan Mackey4,39841.57
Libertarian Rick Parsons1,0279.71
Total votes10,581 100.00
Democratic hold

District 34

District 34 [2]
PartyCandidateVotes%
Democratic Valdenia Winn 5,544 100.00
Total votes5,544 100.00
Democratic hold

District 35

District 35 [2]
PartyCandidateVotes%
Democratic Broderick Henderson 5,694 80.13
Republican Mark Snelson1,41219.87
Total votes7,106 100.00
Democratic hold

District 36

District 36 [2]
PartyCandidateVotes%
Democratic Kathy Wolfe Moore 8,280 62.58
Republican Mark Gilstrap4,95237.42
Total votes13,232 100.00
Democratic hold

District 37

District 37 [2]
PartyCandidateVotes%
Democratic Aaron Coleman [note 1] 3,649 66.45
Independent Stan Frownfelter (write-in)1,22222.25
Independent Kristina Smith (write-in)62011.29
Total votes5,491 100.00
Democratic hold

District 38

District 38 [2]
PartyCandidateVotes%
Republican Timothy H. Johnson 9,368 63.16
Democratic Sherri D. Grogan5,46436.84
Total votes14,832 100.00
Republican hold

District 39

District 39 [2]
PartyCandidateVotes%
Republican Owen Donohoe 8,511 54.78
Democratic Les Lampe7,02745.22
Total votes15,538 100.00
Republican hold

District 40

District 40 [2]
PartyCandidateVotes%
Republican David French 5,318 54.04
Democratic Joana Scholtz4,52345.96
Total votes9,841 100.00
Republican hold

District 41

District 41 [2]
PartyCandidateVotes%
Republican Pat Proctor 3,846 53.00
Democratic Mike Griswold3,41147.00
Total votes7,257 100.00
Republican gain from Democratic

District 42

District 42 [2]
PartyCandidateVotes%
Republican Lance Neelly 9,652 97.15
Independent Jim Karleskint (write-in)2832.85
Total votes7,257 100.00
Republican hold

District 43

District 43 [2]
PartyCandidateVotes%
Republican Bill Sutton 7,893 64.72
Democratic Pamela Finley4,30235.28
Total votes12,195 100.00
Republican hold

District 44

District 44 [2]
PartyCandidateVotes%
Democratic Barbara Ballard (incumbent) 11,358 100.0%
Total votes11,358 11,358
Democratic hold

District 45

District 45 [2]
PartyCandidateVotes%
Democratic Mike Amyx 14,500 100.0%
Total votes14,500 100.0%
Democratic hold

District 46

District 46 [2]
PartyCandidateVotes%
Democratic Dennis Highberger (incumbent) 9,295 85.97%
Libertarian Dante Javaheri1,51714.03%
Total votes10,812 100.0%
Democratic hold

District 47

District 47 [2]
PartyCandidateVotes%
Republican Ronald Ellis (incumbent) 8,209 71.36%
Democratic Michael Caddell3,29428.64%
Total votes11,503 100.0%
Republican hold

District 48

District 48 [2]
PartyCandidateVotes%
Democratic Jennifer Day (incumbent) 6,911 50.23%
Republican Terry Frederick6,84949.77%
Total votes13,760 100.0%
Republican hold

District 49

District 49 [2]
PartyCandidateVotes%
Republican Megan Lynn (incumbent) 5,546 51.07%
Democratic Katie Dixon5,31348.93%
Total votes10,859 100.0%
Republican hold

District 50

District 50 [2]
PartyCandidateVotes%
Republican Fred Patton (incumbent) 9,901 74.85%
Democratic Timothy B. Reed3,32625.15%
Total votes13,227 100.0%
Republican hold

District 51

District 51 [2]
PartyCandidateVotes%
Republican Ron Highland (incumbent) 11,368 100.0%
Total votes11,368 100.0%
Republican hold

District 52

District 52 [2]
PartyCandidateVotes%
Republican Jesse Borjon 7,957 56.28%
Democratic Mary Lous Davis6,18243.72%
Total votes14,139 100.0%
Republican hold

District 53

District 53 [2]
PartyCandidateVotes%
Democratic Jim Gartner (incumbent) 6,326 54.87%
Republican Jeff Coen5,20345.13%
Total votes11,529 100.0%
Democratic hold

District 54

District 54 [2]
PartyCandidateVotes%
Republican Ken Corbet (incumbent) 8,297 67.87%
Democratic John Brosz3,92732.13%
Total votes12,224 100.0%
Republican hold

District 55

District 55 [2]
PartyCandidateVotes%
Democratic Annie Kuether (incumbent) 5,960 62.90%
Republican Janlyn Nesbett Tucker3,51637.10%
Total votes9,476 100.0%
Democratic hold

District 56

District 56 [2]
PartyCandidateVotes%
Democratic Virgil Weigel (incumbent) 5,661 51.18%
Republican Tim Clothier5,40048.82%
Total votes11,061 100.0%
Democratic hold

District 57

District 57 [2]
PartyCandidateVotes%
Democratic John Alcala (incumbent) 4,513 63.42%
Republican Michael Martin2,60336.58%
Total votes7,116 100.0%
Democratic hold

District 58

District 58 [2]
PartyCandidateVotes%
Democratic Vic Miller 4,786 69.63%
Republican Geoffrey H. Gawdun2,08730.37
Total votes6,873 100.0%
Democratic hold

District 59

District 59 [2]
PartyCandidateVotes%
Republican Blaine Finch (incumbent) 7,679 73.10%
Democratic Caren Rugg2,82626.90%
Total votes10,505 100.0%
Republican hold

District 60

District 60 [2]
PartyCandidateVotes%
Republican Mark Schreiber (incumbent) 5,685 59.32%
Democratic Todd Maddox3,89840.68%
Total votes9,583 100.0%
Republican hold

District 61

District 61 [2]
PartyCandidateVotes%
Republican Francis Awerkamp (incumbent) 9,684 100.0%
Total votes9,684 100.0%
Republican hold

District 62

District 62 [2]
PartyCandidateVotes%
Republican Randy Garber (incumbent) 9,757 100.0%
Total votes9,757 100.0%
Republican hold

District 63

District 63 [2]
PartyCandidateVotes%
Republican John Eplee (incumbent) 9,238 100.0%
Total votes9,238 100.0%
Republican hold

District 64

District 64 [2]
PartyCandidateVotes%
Republican Suzi Carlson (incumbent) 5,050 75.69%
Democratic Jim Vathauer1,62224.31%
Total votes6,672 100.0%
Republican hold

District 65

District 65 [2]
PartyCandidateVotes%
Republican Lonnie Clark (incumbent) 4,345 100.0%
Total votes4,345 100.0%
Republican hold

District 66

District 66 [2]
PartyCandidateVotes%
Democratic Sydney Carlin (incumbent) 7,491 100.0%
Total votes7,491 100.0%
Democratic hold

District 67

District 67 [2]
PartyCandidateVotes%
Republican Mike Dodson 6,928 53.72%
Democratic Cheryl A. Arthur5,96946.28%
Total votes12,897 100.0%
Republican hold

District 68

District 68 [2]
PartyCandidateVotes%
Republican Dave Baker 6,740 72.64%
Democratic Scott T. Dawson2,53827.36%
Total votes9,278 100.0%
Republican hold

District 69

District 69 [2]
PartyCandidateVotes%
Republican Clarke Sanders 4,976 59.00%
Democratic Ryan Holmquist3,45841.00%
Total votes8,434 100.0%
Republican hold

District 70

District 70 [2]
PartyCandidateVotes%
Republican John Barker (incumbent) 8,295 76.61%
Democratic Jo Schwartz2,53323.39%
Total votes10,828 100.0%
Republican hold

District 71

District 71 [2]
PartyCandidateVotes%
Republican Steven Howe 7,169 68.83%
Democratic Jeffrey A. Zamrzla3,24631.17%
Total votes10,415 100.0%
Republican hold

District 72

District 72 [2]
PartyCandidateVotes%
Republican Avery Anderson 6,159 54.92%
Democratic Tim Hodge (incumbent)5,05645.08%
Total votes11,215 100.0%
Republican gain from Democratic

District 73

District 73 [2]
PartyCandidateVotes%
Republican Les Mason (incumbent) 9,761 100.0%
Total votes9,761 100.0%
Republican hold

District 74

District 74 [2]
PartyCandidateVotes%
Republican Stephen Owens (incumbent) 9,204 100.0%
Total votes9,204 100.0%
Republican hold

District 75

District 75 [2]
PartyCandidateVotes%
Republican Will Carpenter (incumbent) 7,146 75.61%
Democratic Ethan D. Caylor2,30524.39%
Total votes9,451 100.0%
Republican hold

District 76

District 76 [2]
PartyCandidateVotes%
Republican Eric Smith (incumbent) 9,413 100.0%
Total votes9,413 100.0%
Republican hold

District 77

District 77 [2]
PartyCandidateVotes%
Republican Kristey Williams (incumbent) 9,601 100.0%
Total votes9,601 100.0%
Republican hold

District 78

District 78 [2]
PartyCandidateVotes%
Republican Ron Ryckman Jr. (incumbent) 6,835 52.36%
Democratic Kathy Meyer6,21947.64%
Total votes13,054 100.0%
Republican hold

District 79

District 79 [2]
PartyCandidateVotes%
Republican Cheryl Helmer (incumbent) 6,208 64.83%
Democratic Ken White3,36835.17%
Total votes9,576 100.0%
Republican hold

District 80

District 80 [2]
PartyCandidateVotes%
Republican Bill Rhiley (incumbent) 7,268 100.0%
Total votes7,268 100.0%
Republican hold

District 81

District 81 [2]
PartyCandidateVotes%
Republican Blake Carpenter (incumbent) 5,478 64.48%
Democratic Matthew Joyce3,01835.52%
Total votes8,496 100.0%
Republican hold

District 82

District 82 [2]
PartyCandidateVotes%
Republican Jesse Burris (incumbent) 7,892 70.13%
Democratic Edward Hackerott3,36129.87%
Total votes11,253 100.0%
Republican hold

District 83

District 83 [2]
PartyCandidateVotes%
Democratic Henry Helgerson (incumbent) 4,536 59.96%
Republican David Robbins3,02940.04%
Total votes7,565 100.0%
Democratic hold

District 84

District 84 [2]
PartyCandidateVotes%
Democratic Gail Finney (incumbent) 5,553 74.06%
Republican Janet Sue Rine1,93825.94%
Total votes7,491 100.0%
Democratic hold

District 85

District 85 [2]
PartyCandidateVotes%
Republican Patrick Penn 8,411 59.93%
Democratic Marcey Gregory5,62440.07%
Total votes14,035 100.0%
Republican hold

District 86

District 86 [2]
PartyCandidateVotes%
Democratic Stephanie Byers 3,616 55.49%
Republican Cyndi Howerton2,90144.51%
Total votes6,517 100.0%
Democratic hold

District 87

District 87 [2]
PartyCandidateVotes%
Republican Susan Estes 6,430 54.38%
Democratic Matt Fox5,39445.62%
Total votes11,824 100.0%
Republican hold

District 88

District 88 [2]
PartyCandidateVotes%
Democratic Elizabeth Bishop 5,923 100.0%
Total votes5,923 100.0%
Democratic hold

District 89

District 89 [2]
PartyCandidateVotes%
Democratic KC Ohaebosim 5,891 61.61%
Republican Robert W. Herrick Jr.3,67138.39%
Total votes9,562 100.0%
Democratic hold

District 90

District 90 [2]
PartyCandidateVotes%
Republican Steve Huebert (incumbent) 10,476 100.0%
Total votes10,476 100.0%
Republican hold

District 91

District 91 [2]
PartyCandidateVotes%
Republican Emil Bergquist (incumbent) 9,585 100.0%
Total votes9,585 100.0%
Republican hold

District 92

District 92 [2]
PartyCandidateVotes%
Democratic John Carmichael (incumbent) 5,254 57.62%
Republican Patrick McCormack3,86442.38%
Total votes9,118 100.0%
Democratic hold

District 93

District 93 [2]
PartyCandidateVotes%
Republican Brian Bergkamp 9,434 100.0%
Total votes9,434 100.0%
Republican hold

District 94

District 94 [2]
PartyCandidateVotes%
Republican Leo Delperdang (incumbent) 8,394 66.84%
Democratic Derek Milligan4,16433.16%
Total votes12,558 100.0%
Republican hold

District 95

District 95 [2]
PartyCandidateVotes%
Democratic Tom Sawyer (incumbent) 3,726 55.50%
Republican Christopher Parisho2,98844.50%
Total votes6,714 100.0%
Democratic hold

District 96

District 96 [2]
PartyCandidateVotes%
Republican Tom Kessler 3,542 53.26%
Democratic Stephanie Yeager (incumbent)3,10946.74%
Total votes6,651 100.0%
Republican gain from Democratic

District 97

District 97 [2]
PartyCandidateVotes%
Republican Nick Hoheisel (incumbent) 5,626 62.30%
Democratic Kim Webb3,40437.70%
Total votes9,030 100.0%
Republican hold

District 98

District 98 [2]
PartyCandidateVotes%
Republican Ron Howard (incumbent) 4,174 56.58%
Democratic Steven G. Crum3,20343.42%
Total votes7,377 100.0%
Republican hold

District 99

District 99 [2]
PartyCandidateVotes%
Republican Susan Humphries (incumbent) 9,860 66.75%
Democratic Phil Hodson4,91133.25%
Total votes14,771 100.0%
Republican hold

District 100

District 100 [2]
PartyCandidateVotes%
Republican Daniel Hawkins (incumbent) 7,976 62.92%
Democratic Chad Smith4,70037.08%
Total votes12,676 100.0%
Republican hold

District 101

District 101 [2]
PartyCandidateVotes%
Republican Joe Seiwert (incumbent) 9,396 74.29%
Democratic Elliott R. Adams3,25225.71%
Total votes12,648 100.0%
Republican hold

District 102

District 102 [2]
PartyCandidateVotes%
Democratic Jason Probst (incumbent) 3,368 50.23%
Republican John Whitesel3,33749.77%
Total votes6,705 100.0%
Democratic hold

District 103

District 103 [2]
PartyCandidateVotes%
Democratic Ponka-We Victors (incumbent) 2,615 61.21%
Republican Susanne Haynes1,35831.79%
Libertarian Loren John Hermreck2997.0%
Total votes4,272 100.0%
Democratic hold

District 104

District 104 [2]
PartyCandidateVotes%
Republican Paul Waggoner (incumbent) 7,583 62.93%
Democratic Garth Strand4,46637.07%
Total votes12,049 100.0%
Republican hold

District 105

District 105 [2]
PartyCandidateVotes%
Republican Brenda Landwehr (incumbent) 5,563 59.07%
Democratic Michelle Snyder3,85540.93%
Total votes9,418 100.0%
Republican hold

District 106

District 106 [2]
PartyCandidateVotes%
Republican Lisa Moser 8,374 75.13%
Democratic James L. Swim2,77224.87%
Total votes11,146 100.0%
Republican hold

District 107

District 107 [2]
PartyCandidateVotes%
Republican Susan Concannon (incumbent) 9,863 100.0%
Total votes9,863 100.0%
Republican hold

District 108

District 108 [2]
PartyCandidateVotes%
Republican Steven C. Johnson (incumbent) 9,592 100.0%
Total votes9,592 100.0%
Republican hold

District 109

District 109 [2]
PartyCandidateVotes%
Republican Troy Waymaster (incumbent) 10,414 100.0%
Total votes10,414 100.0%
Republican hold

District 110

District 110 [2]
PartyCandidateVotes%
Republican Ken Rahjes (incumbent) 9,827 100.0%
Total votes9,827 100.0%
Republican hold

District 111

District 111 [2]
PartyCandidateVotes%
Republican Barbara Wasinger (incumbent) 7,343 63.97%
Democratic Eber Phelps4,13536.03%
Total votes11,478 100.0%
Republican hold

District 112

District 112 [2]
PartyCandidateVotes%
Republican Tory Marie Arnberger (incumbent) 10,414 100.0%
Total votes10,414 100.0%
Republican hold

District 113

District 113 [2]
PartyCandidateVotes%
Republican Brett Fairchild 8,165 100.0%
Total votes8,165 100.0%
Republican hold

District 114

District 114 [2]
PartyCandidateVotes%
Republican Michael Murphy 7,428 70.57%
Democratic Jeff Stroberg3,09729.43%
Total votes10,525 100.0%
Republican hold

District 115

District 115 [2]
PartyCandidateVotes%
Republican Boyd Orr (incumbent) 6,646 100.0%
Total votes6,646 100.0%
Republican hold

District 116

District 116 [2]
PartyCandidateVotes%
Republican Kyle Hoffman (incumbent) 7,809 77.17%
Democratic Rick Roitman2,31022.83%
Total votes10,119 100.0%
Republican hold

District 117

He died in office on September 30, 2020, but still remained on the ballot.

District 117 [2]
PartyCandidateVotes%
Republican Leonard Mastroni (incumbent) 8,092 100.0%
Total votes8,092 100.0%
Republican hold

District 118

District 118 [2]
PartyCandidateVotes%
Republican Jim Minnix 10,217 100.0%
Total votes10,217 100.0%
Republican hold

District 119

District 119 [2]
PartyCandidateVotes%
Republican Bradley Ralph (incumbent) 3,312 60.70%
Democratic Jan Scoggins2,14439.30%
Total votes5,456 100.0%
Republican hold

District 120

District 120 [2]
PartyCandidateVotes%
Republican Adam Smith 10,171 100.0%
Total votes10,171 100.0%
Republican hold

District 121

District 121 [2]
PartyCandidateVotes%
Republican John Resman (incumbent) 10,040 59.18%
Democratic James Rexford6,92440.82%
Total votes16,964 100.0%
Republican hold

District 122

District 122 [2]
PartyCandidateVotes%
Republican Russell Jennings (incumbent) 6,808 100.0%
Total votes6,808 100.0%
Republican hold

District 123

District 123 [2]
PartyCandidateVotes%
Republican John Wheeler (incumbent) 6,090 100.0%
Total votes6,090 100.0%
Republican hold

District 124

District 124 [2]
PartyCandidateVotes%
Republican Marty Long (incumbent) 6,977 100.0%
Total votes6,977 100.0%
Republican hold

District 125

District 125 [2]
PartyCandidateVotes%
Republican Shannon Francis (incumbent) 4,490 100.0%
Total votes4,490 100.0%
Republican hold

Notes

  1. Coleman was elected as a Democrat but changed his affiliation to independent in January 2021 after he had admitted to allegations of bullying, blackmail and revenge porn from before his election. [3] [4] After a House committee investigation in February 2021, he was allowed to rejoin the Democrats. [5]

Related Research Articles

<span class="mw-page-title-main">Kansas House of Representatives</span> Lower house of the government of Kansas

The Kansas House of Representatives is the lower house of the legislature of the U.S. state of Kansas. Composed of 125 state representatives from districts with roughly equal populations of at least 19,000, its members are responsible for crafting and voting on legislation, helping to create a state budget, and legislative oversight over state agencies. Representatives are elected to two-year terms. The Kansas House of Representatives does not have term limits. The legislative session convenes at the Kansas State Capitol in Topeka annually.

Stan S. Frownfelter is an American businessman and former Democratic member of the Kansas House of Representatives, representing the 37th district in Wyandotte County. He was first elected in 2006 and took office on January 3, 2007. He served as the House Assistant Minority Leader from 2017 to 2019. Until 2020, he had never faced primary opposition.

<span class="mw-page-title-main">Barbara Bollier</span> American politician

Barbara Goolsbee Bollier is an American physician and politician. From 2017 to 2021, she was a member of the Kansas Senate representing the 7th district, which includes Mission Hills, Kansas in Johnson County. Bollier is a member of the Democratic Party, after having left the Republican Party in 2018. Bollier was the Democratic nominee in the 2020 United States Senate election in Kansas, losing in the general election to Republican congressman Roger Marshall.

<span class="mw-page-title-main">2020 United States Senate election in Kansas</span> US election

The 2020 United States Senate election in Kansas was held on November 3, 2020, to elect a member of the United States Senate to represent the State of Kansas, concurrently with the 2020 U.S. presidential election, as well as other elections to the United States Senate, elections to the United States House of Representatives and various state and local elections.

<span class="mw-page-title-main">Andrew Garbarino</span> American politician (born 1984)

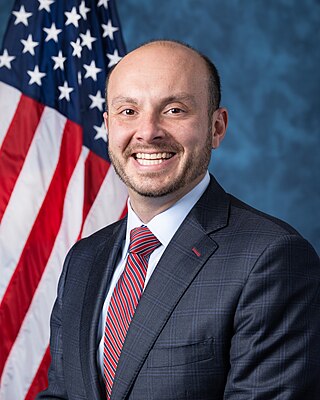
Andrew Reed Garbarino is an American attorney and politician serving as the U.S. representative for New York's 2nd congressional district since 2021. A member of the Republican Party, he served as the New York State Assemblyman for the 7th district from 2013 to 2020.

<span class="mw-page-title-main">2020 United States House of Representatives elections</span> House elections for the 117th U.S. Congress

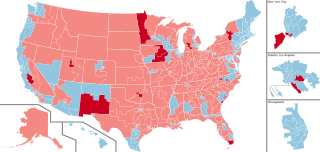
The 2020 United States House of Representatives elections were held on November 3, 2020, to elect representatives from all 435 congressional districts across each of the 50 U.S. states to the 117th United States Congress, as well as six non-voting delegates from the District of Columbia and the inhabited U.S. territories. Special House elections were also held on various dates throughout 2020.

<span class="mw-page-title-main">2018 Pennsylvania House of Representatives election</span>

The 2018 elections for the Pennsylvania House of Representatives was held on November 6, 2018, with all districts being decided. The term of office for those that were elected in 2018 began when the House of Representatives convened in January 2019. Pennsylvania State Representatives are elected for two-year terms, with all 203 seats up for election every two years. The election coincided with the election for Governor and one-half of the State Senate. The Republican Party maintained its majority in the House of Representatives despite receiving less than 45% of the popular vote.

<span class="mw-page-title-main">2018 Georgia State Senate election</span>

The 2018 Georgia State Senate elections took place as part of the biennial United States elections. Georgia voters elected state senators in all 56 of the state senate's districts. State senators serve two-year terms in the Georgia State Senate.

<span class="mw-page-title-main">2018 Texas House of Representatives election</span>

The 2018 Texas House of Representatives elections took place as part of the biennial United States elections. Texas voters elected state representatives in all 150 of the state house's districts. The winners of this election served in the 86th Texas Legislature. State representatives serve two-year terms in the Texas State House. A statewide map of Texas' state House districts can be obtained from the Texas Legislative Council here, and individual district maps can be obtained from the U.S. Census here.

<span class="mw-page-title-main">2018 New Mexico House of Representatives election</span>

The 2018 New Mexico House of Representatives election took place as part of the biennial United States elections. New Mexico voters elected state representatives in all 70 of the state house's districts. State representatives serve two-year terms in the New Mexico House of Representatives.

<span class="mw-page-title-main">2022 United States Senate election in Kansas</span>

The 2022 United States Senate election in Kansas was held on November 8, 2022, to elect a member of the United States Senate to represent the state of Kansas. Incumbent Republican Senator Jerry Moran was first elected in 2010, winning the seat vacated by Sam Brownback, and ran for re-election to a third term in office. Democrat Mark Holland, the former mayor of Kansas City, was Moran's opponent in the general election.

<span class="mw-page-title-main">2020 Colorado House of Representatives election</span>

The 2020 Colorado House of Representatives elections took place on November 3, 2020, with the primary elections held on June 30, 2020. Voters in all 65 districts of the state House elected their representative for a two-year term. It coincided with the state Senate elections and the biennial United States elections. The Democratic Party retained control of the House of Representatives. The Democrats gained the 38th District while the Republicans gained the 47th District, resulting in no net seat change.

<span class="mw-page-title-main">2018 Kentucky House of Representatives election</span>

The 2018 Kentucky House of Representatives elections were held on November 6, 2018, as part of the biennial United States elections. All 100 of Kentucky's state representatives were up for reelection. In Kentucky, members of the House of Representatives serve two-year terms. Accordingly, they are up for reelection in both presidential and midterm election years.

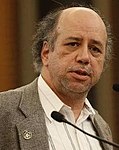
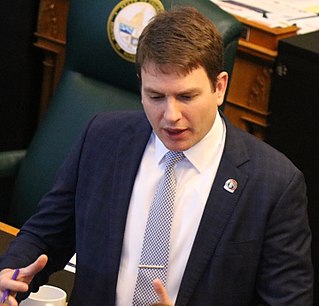
Aaron Coleman is an American politician. A Democrat, he represented District 37 in the Kansas House of Representatives from 2021 to 2023. The district covers the Turner neighborhood and parts of the Argentine and Armourdale neighborhoods of Kansas City in Wyandotte County, Kansas. He was elected to the Kansas House of Representatives at the age of 20. Coleman previously ran a write-in campaign for governor of Kansas in 2018 and ran for the Kansas City Board of Utilities in 2019.

<span class="mw-page-title-main">2020 Oklahoma House of Representatives election</span> Oklahoma elects state representatives; part of 2020 legislative elections

The 2020 Oklahoma House of Representatives election took place as part of the biennial 2020 United States state legislative elections. Oklahoma voters elected state representatives in all 101 House districts. State Representatives serve two-year terms in the Oklahoma House of Representatives.

<span class="mw-page-title-main">2022 Illinois House of Representatives election</span>

The 2022 elections for the Illinois House of Representatives occurred on Tuesday, November 8, 2022, to elect representatives from all 118 Representative districts in the Illinois House of Representatives. The primary election occurred on Tuesday, June 28, 2022. The winners of this election serve in the 103rd General Assembly, with seats apportioned among the state based on the 2020 United States census. The Democratic Party has held a House majority since 1997. 92 Democratic candidates; 104 Republican candidates and 1 independent candidate ran for a house seat. The inauguration of the 103rd General Assembly occurred on Wednesday, January 11, 2023.

<span class="mw-page-title-main">2022 United States state legislative elections</span>

The 2022 United States state legislative elections were held on November 8, 2022, for 88 state legislative chambers in 46 states. Across the fifty states, approximately 56 percent of all upper house seats and 92 percent of all lower house seats were up for election. Additionally, six territorial chambers were up in four territories and the District of Columbia. These midterm elections coincided with other state and local elections, including gubernatorial elections in multiple states.

<span class="mw-page-title-main">2022 Colorado House of Representatives election</span>

The 2022 Colorado House of Representatives elections took place on November 8, 2022 along with the elections in the State Senate, with the primary elections being held on June 28, 2022. Voters in all 65 districts of the state House elected their representative for a two-year term. It coincided with other Colorado elections of the same year and the biennial United States elections.

<span class="mw-page-title-main">2022 Michigan House of Representatives election</span> American state election

An election was held on November 8, 2022, to elect all 110 members to Michigan's House of Representatives. The election coincided with elections for other offices, including governor, State Senate and U.S. House of Representatives. Democrats won a majority of 56 out of 110 seats, winning control of the chamber for the first time since 2008.

<span class="mw-page-title-main">2022 Kansas House of Representatives election</span> State election

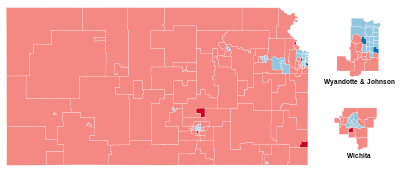
The 2022 Kansas House of Representatives elections took place as a part of the 2022 United States elections. All 125 seats in the Kansas House of Representatives were up for re-election. Representatives serve two year terms and are not term limited.

References

  1. "October Overview: Handicapping the 2020 State Legislature Races". The Cook Political Report . Retrieved November 1, 2020.
  2. 1 2 3 4 5 6 7 8 9 10 11 12 13 14 15 16 17 18 19 20 21 22 23 24 25 26 27 28 29 30 31 32 33 34 35 36 37 38 39 40 41 42 43 44 45 46 47 48 49 50 51 52 53 54 55 56 57 58 59 60 61 62 63 64 65 66 67 68 69 70 71 72 73 74 75 76 77 78 79 80 81 82 83 84 85 86 87 88 89 90 91 92 93 94 95 96 97 98 99 100 101 102 103 104 105 106 107 108 109 110 111 112 113 114 115 116 117 118 119 120 121 122 123 124 125 "Kansas Secretary of State 2020 General Election Official Vote Totals" (PDF). Kansas Secretary of State . Retrieved January 23, 2021.
  3. "New Kansas Representative changes affiliation from Democrat to Independent". KMBC News . January 12, 2021. Archived from the original on January 18, 2021. Retrieved February 21, 2021.
  4. Hailey Godburn (November 4, 2020). "20-year-old who admitted to sexual harassment elected to Kansas House of Representatives". KSHB . Retrieved February 21, 2021.
  5. "Kansas Rep. Aaron Coleman rejoins Democratic Party". KSHB . February 8, 2021. Retrieved February 21, 2021.