2020 United States House of Representatives elections in Illinois Last updated November 04, 2025
2020 United States House of Representatives elections in Illinois Majority party Minority party Party Democratic Republican Last election 13 5 Seats won 13 5 Seat change Popular vote 3,355,487 2,416,929 Percentage 57.10% 41.13% Swing
District results County results Democratic
50–60%
60–70%
70–80%
80–90%
Republican
50–60%
60–70%
70–80%
80–90%
The 2020 United States House of Representatives elections in Illinois were held on November 3, 2020, to elect the 18 U.S. representatives from the state of Illinois , one from each of the state's 18 congressional districts . The elections coincided with the 2020 U.S. presidential election , as well as other elections to the House of Representatives, elections to the United States Senate , various state and local elections , and the Illinois Fair Tax .
Statewide Popular vote Democratic
57.10% Republican
41.13% Other
1.78%
House seats Democratic
72.22% Republican
27.78%
By district Results of the 2020 United States House of Representatives elections in Illinois by district: [ 1]
District 1 2020 Illinois's 1st congressional district election County results Rush: 80–90%White: 60–70%
The 1st district takes in the South Side of Chicago , the southern suburbs of Chicago, and continues southwest to Joliet . The incumbent was Democrat Bobby Rush , who was re-elected with 73.5% of the vote in 2018. [ 2]
Democratic primary Candidates Eliminated in primary Robert Emmons Jr., nonprofit executive [ 4] Sarah Gad, law student and opioid recovery advocate [ 5] Ameena Matthews, community activist [ 6] Third parties Removed Ruth Pellegrini (independent) [ 20] District 2 2020 Illinois's 2nd congressional district election County results Kelly: 50–60% 80-90%Merkle: 50–60%
The 2nd district encompasses South Side Chicago and its southern suburbs, including eastern Will County and Kankakee County . The incumbent was Democrat Robin Kelly , who was re-elected with 81.1% of the vote in 2018. [ 2]
Democratic primary Candidates Eliminated in primary Marcus Lewis, postal worker [ 3] Republican primary Candidates Nominee Theresa Raborn, activist [ 3] District 3 2020 Illinois's 3rd congressional district election County results Newman: 50–60%Fricilone: 50–60%
The 3rd district includes western and southwestern suburbs of Chicago as far as the DuPage County border, as well part of southwest Chicago itself. The incumbent was Democrat Dan Lipinski , who was re-elected with 73.0% of the vote in 2018. [ 2] On March 17, 2020, Marie Newman defeated Dan Lipinski in the Democratic primary in a rematch of their 2018 race.
Democratic primary Candidates Eliminated in primary Rush Darwish, photographer and former broadcaster [ 31] Charles Hughes [ 32] Dan Lipinski , incumbent U.S. representative [ 33] Withdrawn Abe Matthew, attorney [ 34] (endorsed Newman ) Endorsements Dan Lipinski
U.S. representatives
Newspapers
Organizations
Individuals
Marie Newman
U.S. senators
U.S. representatives
State legislators
Municipal officials
Publications
Unions
Organizations
Polling Poll source Date(s) Sample [ a] Margin of Dan Marie Rush Charles Undecided Expedition Strategies (D) [ 69] [ b] January 7–9, 2020 500 (LV) ± 4.4% 47% 25% 2% 1% 26%
Republican primary Candidates Endorsements Mike Fricilone
State legislators
Newspapers
Unions
General election Polling Poll source Date(s) Sample [ a] Margin of Marie Mike Other Ogden & Fry (R) [ 77] September 7, 2020 759 (LV) ± 3.63% 46% 44% 10% [ c]
District 4 2020 Illinois's 4th congressional district election
The 4th district takes in the heavily Hispanic areas of West Side and South Side Chicago . The incumbent was Democrat Chuy García , who was elected with 86.6% of the vote in 2018. [ 2]
Republican primary Candidates Christopher Lasky was originally the only Republican candidate to file, and was the sole Republican candidate in the primary. Lasky died on December 23, 2019, but remained on the ballot as the only candidate winning the nomination, and the Illinois Republican Party nominated Jesus Solorio as his replacement. [ 78]
Nominee Jesus E. Solorio Jr., Chicago Republican Party vice-chair and 23rd Ward Republican committeeman (nominated by party) Winner in primary Christopher Lasky, former member of the board of trustees for the Stickney-Forest View Public Library District [ 3] (deceased, December 23, 2019) District 5 2020 Illinois's 5th congressional district election County results Quigley: 50–60% 70-80%
The 5th district is based in North Side Chicago and its northern and western suburbs, including Elmhurst , Elmwood Park , Franklin Park , Hinsdale , La Grange Park , Norridge , Northlake , River Grove , Schiller Park , and Oakbrook Terrace . The incumbent was Democrat Mike Quigley , who was re-elected with 76.7% of the vote in 2018. [ 2]
Democratic primary Candidates Eliminated in primary Brian Burns, attorney [ 3] Republican primary Candidates Nominee Tom Hanson, nominee for Illinois's 5th congressional district in 2018 [ 3] District 6 2020 Illinois's 6th congressional district election
The 6th district encompasses the western Chicago suburbs, and includes parts of Cook , DuPage , Lake , Kane , and McHenry counties. The incumbent was Democrat Sean Casten , who flipped the district and was elected with 53.6% of the vote in 2018. [ 2]
Democratic primary Endorsements Sean Casten
Former U.S. Executive Branch officials U.S. senators
Organizations
Individuals
Republican primary Candidates Eliminated in primary Jay Kinzler, transplant surgeon and U.S. Army Reserve colonel [ 93] Endorsements Jeanne Ives
U.S. senators
U.S. representatives
Cabinet-level officials
Newspapers
Individuals
Organizations
General election Polling Poll source Date(s) Sample [ a] Margin Sean Jeanne Undecided Ogden & Fry (R) [ 108] [ d] December 17, 2019 575 (LV) ± 4.17% 38% 47% 16%
Hypothetical polling
with Generic Democrat and Generic Republican
District 7 2020 Illinois's 7th congressional district election
The 7th district encompasses West Side Chicago and downtown Chicago, including Bellwood , Forest Park , Oak Park , Maywood , and Westchester . The incumbent was Democrat Danny K. Davis , who was re-elected with 87.6% of the vote in 2018. [ 2]
Democratic primary Endorsements Anthony Clark
Local officials
Notable individuals
Newspapers
The Chicago Sun-Times [ 116] Organizations
Kina Collins
Organizations
Elected officials
Individuals
Channyn Lynne Parker, transgender rights activist [ 118] Third parties Candidates Tracy Jennings (independent), former public service administrator [ 121] District 8 2020 Illinois's 8th congressional district election County results Krishnamoorthi: 70-80%
The 8th district is based in the northwestern suburbs of Chicago. The incumbent was Democrat Raja Krishnamoorthi , who was re-elected with 66.0% of the vote in 2018. [ 2]
Democratic primary Candidates Eliminated in primary Inam Hussain, social worker [ 122] William Olson [ 3] Republican primary Write-in candidates Joseph J Hantsch Richard Mayers Third Parties Libertarian Party Nominee Preston Gabriel Nelson, inventor [ 123] District 9 2020 Illinois's 9th congressional district election
The 9th district is based in the northern Chicago suburbs, including all or parts of Arlington Heights , Des Plaines , Evanston , Glenview , Lincolnwood , Morton Grove , Mount Prospect , Niles , Park Ridge , Prospect Heights , Skokie , Wilmette , and Winnetka . The incumbent was Democrat Jan Schakowsky , who was re-elected with 73.5% of the vote in 2018. [ 2]
Republican primary Candidates Nominee Sargis Sangari, former U.S. Army lieutenant colonel [ 124] District 10 2020 Illinois's 10th congressional district election County results Schneider: 60–70%
The 10th district encompasses the North Shore and the northwestern suburbs of Chicago. The incumbent was Democrat Brad Schneider , who was re-elected with 65.6% of the vote in 2018. [ 2]
Democratic primary Candidates Withdrawn Andrew Wang, progressive activist [ 125] Republican primary Candidates Nominee Valerie Ramirez Mukherjee, venture capitalist [ 126] District 11 2020 Illinois's 11th congressional district election County results Foster: 60–70% 70–80%Laib: 50–60%
The 11th district covers the southwestern and western Chicago suburbs, including all or parts of Aurora , Bolingbrook , Darien , Joliet , Montgomery , Naperville , Lisle , Downers Grove , New Lenox , Shorewood , and Woodridge . The incumbent was Democrat Bill Foster , who was re-elected with 63.8% of the vote in 2018. [ 2]
Democratic primary Endorsements Bill Foster
U.S. senators
Organizations
Labor unions
Newspapers
Primary results Results by county: Foster—60–70%
Foster—50–60%
Republican primary Candidates Eliminated in primary Krishna Bansal, member of the Naperville Zoning and Planning Commission [ 134] District 12 2020 Illinois's 12th congressional district election County resultsBost: 50–60% 60–70% 70–80%Lenzi: 50–60%
The 12th district takes in southwestern Illinois, taking in the suburbs of St. Louis and Metro Lakeland . The incumbent was Republican Mike Bost , who was re-elected with 51.6% of the vote in 2018. [ 2]
Democratic primary Candidates Eliminated in primary Joel Funk, financial consultant and U.S. Army veteran [ 139] District 13 2020 Illinois's 13th congressional district election County resultsDavis: 50–60% 60–70% 70–80%Londrigan: 50–60% 60–70%
The 13th district encompasses parts of Bond , Champaign , Madison , McLean , and Sangamon counties, and all of Christian , Calhoun , De Witt , Greene , Jersey , Macon , Macoupin , Montgomery , and Piatt counties, including all or parts of the cities of Bloomington , Champaign , Decatur , Godfrey , Springfield , Taylorville , and Urbana . The incumbent was Republican Rodney Davis , who was re-elected with 50.4% of the vote in 2018. [ 2]
Democratic primary Candidates Nominee Betsy Dirksen Londrigan, former nonprofit leader, entrepreneur, and nominee for Illinois's 13th congressional district in 2018 [ 141] Eliminated in primary Stefanie Smith, former sex worker and activist [ 142] General election Endorsements Betsy Dirksen Londrigan
U.S. presidents
U.S. vice presidents
U.S. senators
State legislators
Labor unions
Newspapers
Organizations
Individuals
Marie Newman , 2020 Democratic nominee for Illinois's 3rd Congressional District [ 169] District 14 2020 Illinois's 14th congressional district election County results Underwood: 50–60% 60–70%Oberweis: 50–60%
The 14th district encompasses the western Chicago exurbs, including all or parts of Batavia , Campton Hills , Crystal Lake , Geneva , Huntley , McHenry , Naperville , St. Charles , North Aurora , Oswego , Plainfield , Plano , Sycamore , Warrenville , Wauconda , Woodstock , and Yorkville . The incumbent was Democrat Lauren Underwood , who flipped the district and was elected with 52.5% of the vote in 2018. [ 2]
On November 12, the race was called by the Associated Press for Underwood. [ 173] On January 5, 2021, Jim Oberweis filed notice with the U.S. House of Representatives, challenging the results of the election. [ 174]
Democratic primary Candidates Endorsements Lauren Underwood
US presidents
Local officials
Individuals
Publications
Organizations
Republican primary Withdrawn Danny Malouf, human resource director [ 189] Matt Quigley, U.S. Navy veteran [ 190] Endorsements Jim Oberweis
U.S. Executive Branch officials
U.S. senators
U.S. representatives
Sue Rezin
State-wide officials
Newspapers
Primary results Results by county: Oberweis—30–40%
Oberweis—20–30%
Rezin—20–30%
Lauf—20–30%
District 15 2020 Illinois's 15th congressional district election County results Miller: 60–70% 70–80% 80–90%
The 15th district encompasses rural east-central and southeastern Illinois . The incumbent was Republican John Shimkus , who was re-elected with 70.9% of the vote in 2018. [ 2] Shimkus announced he would not be seeking re-election on August 30, 2019. [ 203] After briefly considering reversing his retirement plans, Shimkus reaffirmed his decision to not run on November 4, 2019. [ 204]
Republican primary Candidates Withdrawn Alex Walker, U.S. Air Force veteran [ 208] General election Endorsements Mary Miller (R)
Federal officials
Organizations
District 16 2020 Illinois's 16th congressional district election County results Kinzinger: 60–70% 70–80% 80–90%Brzozowski: 50–60%
The 16th district encompasses north-central Illinois , taking in the east side of Rockford , Belvidere , Ottawa , and DeKalb . The incumbent was Republican Adam Kinzinger , who was re-elected with 59.1% of the vote in 2018. [ 2]
Endorsements Dani Brzozowski (D)
U.S. senators
U.S. representatives
Statewide elected officials
State senators
State representatives
Congressional candidates
Unions
Organizations
Individuals
District 17 2020 Illinois's 17th congressional district election County results Bustos: 50–60% 60–70%King: 50–60% 60–70%
The 17th district encompasses northwestern Illinois , including the Quad cities metro , the westside of Rockford , and Peoria . Democratic incumbent Cheri Bustos was re-elected with 52.0% of the vote while the district voted for Donald Trump in the concurrently-held presidential election by 1.6%, making it one of only seven Trump-won districts held by a Democrat in the 117th Congress . [ 238]
Democratic primary Candidates Eliminated in primary Spanky Edwards, chairman of the Youth Works Committee of the Illinois branch of the NAACP [ 239] Republican primary Candidates Nominee Esther Joy King, attorney and businesswoman [ 240] Eliminated in primary Bill Fawell, real estate broker and nominee for Illinois's 17th congressional district in 2018 [ 241] Endorsements Esther Joy King (R)
U.S. Executive Branch officials
Organizations
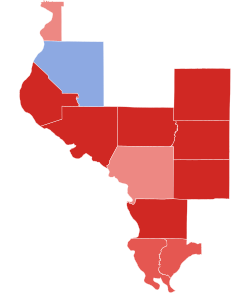
District 18 2020 Illinois's 18th congressional district election County resultsLaHood: 60–70% 70–80% 80–90%
The 18th district covers rural west-central Illinois , including Jacksonville , Quincy , and parts of Bloomington , Peoria , and Springfield . The incumbent was Republican Darin LaHood , who was re-elected with 67.2% of the vote in 2018. [ 2]
Democratic primary After the primaries ended, Democratic Party leaders in the district placed George Petrilli, an attorney, on the ballot. [ 248]
Notes 1 2 3 4 5 6 7 8 Key: ↑ Poll sponsored by the Dan Lipinski campaign ↑ "Other or Undecided" with 10% 1 2 Poll sponsored by Jeanne Ives' campaign ↑ Poll conducted for the DCCC . ↑ Poll sponsored by Londrigan's campaign 1 2 3 Poll sponsored by Oberweis' campaign ↑ Standard VI response Partisan clients
↑ Poll sponsored by the NRCC , which endorsed King prior to the sampling period. ↑ Poll sponsored by the Congressional Leadership Fund , which endorsed King prior to the sampling period. References 1 2 3 4 5 6 7 8 9 10 11 12 13 14 15 16 17 18 19 "Election Results 2020 GENERAL ELECTION" . Illinois State Board of Elections . December 4, 2020. Archived from the original on May 30, 2021. Retrieved December 4, 2020 . 1 2 3 4 5 6 7 8 9 10 11 12 13 14 15 16 17 Wasserman, David; Flinn, Ally (November 7, 2018). "2018 House Popular Vote Tracker" . Cook Political Report. Archived from the original on April 3, 2019. Retrieved February 15, 2019 . 1 2 3 4 5 6 7 8 9 10 11 12 13 14 15 "Candidate List - GENERAL PRIMARY - 3/17/2020" . Illinois State Board of Elections . Retrieved December 2, 2019 . [ permanent dead link ] ↑ McQueary, Kristen (April 8, 2019). "Column: Ignore Bobby Rush. Kim Foxx's wounds are self-inflicted" . Chicago Tribune . Retrieved April 16, 2019 . ↑ "Chicago activist Sarah Gad could be nation's first formerly incarcerated women legislator" . The Chicago Defender . October 28, 2019. Retrieved November 23, 2019 . ↑ Garmes, Kyle (July 9, 2019). "Matthews follows activism with run in First District" . The Beverly Review. Retrieved July 9, 2019 . 1 2 3 4 5 6 "2020 Endorsements" . plannedparenthoodaction.org . Planned Parenthood Action Fund. Archived from the original on November 15, 2019. Retrieved January 25, 2020 . 1 2 3 4 5 6 7 8 "Sierra Club #ClimateVoter Guide: Endorsements" . Sierra Club . July 16, 2012. ↑ "Endorsement: Robert Emmons, Jr., for Illinois's First Congressional District" . www.chicagomaroon.com . February 14, 2020. ↑ "Endorsement: Robert Emmons Jr. Endorsement" . Chicago Tribune . February 14, 2020. ↑ "Robert Emmons" . Brand New Congress . October 21, 2019. Archived from the original on October 23, 2019. Retrieved January 12, 2020 . ↑ Movement, Sunrise (December 12, 2019). "Sunrise Movement launches first wave of Congressional primary endorsements, fortifying Green New…" . Medium . ↑ YouTube 1 2 3 4 5 6 7 8 9 10 11 12 13 14 15 16 17 18 19 20 21 22 23 24 25 26 27 28 29 30 31 32 33 34 "Election Results 2020 GENERAL PRIMARY" . Illinois State Board of Elections . Retrieved April 17, 2020 . [ permanent dead link ] 1 2 3 4 5 6 7 "Election Results 2020 Primary - DEM - 3/17/2020" . Chicago Board of Election Commissioners. Retrieved April 8, 2020 . 1 2 3 4 5 6 7 8 9 10 11 12 13 14 15 16 17 "Suburban Cook County Election Results March 17, 2020 Presidential Primary Election" . Cook County Clerk's Office. Retrieved April 8, 2020 . 1 2 3 4 5 6 "WILL COUNTY, ILLINOIS March 17, 2020 GENERAL PRIMARY ELECTION" . Will County Clerk. Retrieved April 8, 2020 . ↑ "FROM ILLINOIS CONSERVATIVE ACTIVIST CONFERENCE: MEET PHILANISE WHITE, CANDIDATE IN 1ST CD" . Illinois Review . August 26, 2019. Retrieved November 24, 2019 . 1 2 3 4 5 6 7 "Election Results 2020 Primary - REP - 3/17/2020" . Chicago Board of Election Commissions. Retrieved April 8, 2020 . ↑ Slowik, Ted (March 12, 2020). "Column: Challengers face uphill battles to overcome election advantages by incumbents" . Chicago Tribune . 1 2 3 4 5 6 7 8 9 10 11 12 13 14 15 16 17 18 "2020 House Race Ratings" . The Cook Political Report . October 21, 2020. Retrieved October 28, 2020 . 1 2 3 4 5 6 7 8 9 10 11 12 13 14 15 16 17 18 "House Ratings" . Inside Elections . October 16, 2020. Retrieved October 28, 2020 . 1 2 3 4 5 6 7 8 9 10 11 12 13 14 15 16 17 18 "2020 House race ratings" . Sabato's Crystal Ball . October 20, 2020. Retrieved October 28, 2020 . 1 2 3 4 5 6 7 8 9 10 11 12 13 14 15 16 17 18 "Here's who we think will win the 2020 elections in Illinois" . Politico . October 11, 2020. Retrieved October 28, 2020 . 1 2 3 4 5 6 7 8 9 10 11 12 13 14 15 16 17 18 "House 2020" . Daily Kos . October 26, 2020. Retrieved October 28, 2020 . 1 2 3 4 5 6 7 8 9 10 11 12 13 14 15 16 17 18 "Battle for the House 2020" . RealClearPolitics . Retrieved October 28, 2020 . 1 2 3 4 5 6 7 8 9 10 11 12 13 14 15 16 17 18 "2020 Negative Partisanship and the 2020 Congressional Elections" . Niskanen Center . April 28, 2020. Archived from the original on June 21, 2020. Retrieved April 29, 2020 . 1 2 3 4 5 6 7 8 9 10 11 12 13 14 15 16 17 18 "Illinois 2020 Election Results" . Chicago Sun-Times . November 20, 2020. Retrieved November 20, 2020 . 1 2 "March 17, 2020 General Primary Election" . Kankakee County Clerk. Retrieved April 9, 2020 . ↑ Sweet, Lynn (April 16, 2019). "Marie Newman officially jumps in Democratic primary against Rep. Dan Lipinski" . Chicago Sun-Times . Archived from the original on April 16, 2019. Retrieved April 16, 2019 . ↑ Ortiz, Alex (May 28, 2019). "Small business owner, former broadcaster launches challenge to Lipinski in 2020" . The Times-Herald. Archived from the original on May 28, 2019. Retrieved May 28, 2019 . 1 2 3 Sweet, Lynn (December 2, 2019). "Holocaust denier, activist anti-Semite files again for Chicago-area House seat" . Chicago Sun Times . Retrieved December 3, 2019 . 1 2 Candidates Filed [ permanent dead link ] ↑ Sweet, Lynn (November 12, 2019). "Lipinski challenger drops out, endorses Newman in Democratic primary for Congress" . Chicago Sun Times . 1 2 "Democrats Rally Behind Incumbents" . The Hill . September 23, 2019. Retrieved January 28, 2020 . ↑ "Editorial: Endorsement for Lipinski" . Chicago Tribune . February 14, 2020. Retrieved February 14, 2020 . 1 2 3 4 5 6 7 "Endorsements" . Lipinski for Congress . Archived from the original on January 27, 2020. Retrieved January 28, 2020 . ↑ "Election Endorsements" (PDF) . Archived from the original (PDF) on January 29, 2020. Retrieved January 24, 2020 . 1 2 "Democrats for Life" . democratsforlife.org . Retrieved January 28, 2020 . ↑ "AFL-CIO backs Lipinski" . chicagobusiness.com . January 16, 2020. Retrieved January 28, 2020 . ↑ "National Right to Life Supports Pro-Life Candidates" (PDF) . ↑ "Pro-Life Group Supports Lipinski" . ↑ Kapos, Shai; Hurst, Adrienne (October 17, 2019). "TEACHER STRIKE! — LIPINSKI down in the money race — CINESPACE didn't get a leg up" . POLITICO . Retrieved October 17, 2019 . ↑ Weigel, David (April 16, 2019). "Gillibrand backs challenger to antiabortion House Democrat" . The Washington Post . Retrieved April 18, 2019 . ↑ Baird, Addy (June 5, 2019). "Bernie Sanders Is Endorsing Marie Newman Against One Of The Last Anti-Abortion Democrats In Congress" . buzzfeednews.com . Retrieved January 12, 2020 . ↑ Bowman, Bridget; Akin, Stephanie; Bowman, Bridget; Akin, Stephanie (September 9, 2019). "Elizabeth Warren backs primary challengers against sitting House Democrats" . Roll Call . Retrieved January 12, 2020 – via www.rollcall.com. ↑ Slevin, Peter (March 26, 2020). "A Narrow Win for Progressives in the Chicago Suburbs" . New Yorker . Retrieved February 28, 2021 . ↑ Edmondson, Catie (September 17, 2019). "Alexandria Ocasio-Cortez to Back First 2020 Challenger to Sitting Democrat" . The New York Times . Retrieved January 12, 2020 . 1 2 3 Swanson, Lorraine (February 12, 2020). "Lipinski Wins Cop-Firefighter Support, Sun-Times Endorses Newman" . msn.com . Microsoft News. Retrieved February 12, 2020 . ↑ Pearson, Rick (November 5, 2019). "Rep. Jan Schakowsky again backs Marie Newman over Rep. Dan Lipinski" . Chicago Tribune . Retrieved January 12, 2020 . 1 2 3 4 5 6 7 8 9 10 11 Pearson, Rick (October 8, 2019). "Marie Newman, progressive challenger to Democratic U.S. Rep. Dan Lipinski, picks up endorsements from 17 local officials" . Chicago Tribune . Retrieved January 12, 2020 . 1 2 3 4 5 Hanania, Ray (February 4, 2020). "Marie Newman wins endorsements from leaders in the 3rd District" . Suburban Chicagoland . Retrieved February 28, 2021 . ↑ Vaisvilas, Frank (February 9, 2020). "Chicago Mayor Lori Lightfoot endorses challenger Marie Newman in congressional primary against U.S. Rep. Dan Lipinski" . Chicago Tribune – via chicagotribune.com. 1 2 3 4 5 "Endorsements" . Retrieved January 12, 2020 . ↑ Pearson, Rick (December 3, 2019). "Marie Newman gets SEIU state council backing in Democratic primary challenge to U.S. Rep. Dan Lipinski" . Chicago Tribune . Retrieved January 12, 2020 . ↑ "Democracy for America : DFA endorses Marie Newman's IL-3 primary after DCCC policy props up Lipinski" . democracyforamerica.com . Retrieved January 12, 2020 . 1 2 3 4 5 "Leading Progressive Groups Endorse Marie Newman for Congress.rtf" . Google Docs . Retrieved January 12, 2020 . 1 2 "Giffords Endorses Slate of Women Running to Keep Gun Safety a Top Congressional Priority" . Giffords . April 30, 2020. ↑ Riley, John (June 9, 2020). "Human Rights Campaign makes congressional endorsements ahead of November's election" . www.metroweekly.com . Metro Weekly . Retrieved May 30, 2022 . ↑ "Indivisible Chicago Marie Newman Endorsement" . Indivisible Chicago . Archived from the original on February 22, 2020. Retrieved January 12, 2020 . ↑ "Justice Democrats | It's #OurTime" . justicedemocrats.com . Retrieved January 12, 2020 . ↑ Sittenfeld, Tiernan (April 15, 2020). "LCV Action Fund Endorses Marie Newman for Congress" . League of Conservation Voters . LCV Action Fund. ↑ "Endorsed Candidates" . ↑ "PeaceVoter 2020 Endorsements" . Peace Action . Archived from the original on March 20, 2020. Retrieved March 19, 2020 . ↑ "Help Elect An Empowered Pro-Choice Progressive" . May 24, 2019. Retrieved January 12, 2020 . ↑ "Richard Stallman's Personal Page" . stallman.org . Retrieved January 21, 2020 . ↑ Golshan, Tara (September 10, 2020). "Sunrise Movement Unveils 2020 Endorsements To Defeat Climate Change Deniers" . HuffPost . Retrieved September 10, 2020 . ↑ Expedition Strategies (D) 1 2 3 4 5 6 7 "MARCH 17, 2020 2020 GENERAL PRIMARY" . DuPage County Clerk. Retrieved April 9, 2020 . ↑ Kapos, Shia; Hurst, Adrienne (June 12, 2019). "Eye on 2020: GOP Will County Board Member Mike Fricilone kicks off 3rd District bid for Congress" . Politico . Retrieved June 12, 2019 . ↑ Sweet, Lynn; Main, Frank (February 4, 2018). "Holocaust denier poised to claim GOP nomination in Illinois race for Congress" . Chicago Sun-Times . Archived from the original on February 5, 2018. Retrieved February 5, 2018 . 1 2 "Capitol Fax.com - Your Illinois News Radar » Rate the first Marie Newman TV ad" . capitolfax.com . ↑ "ENDORSEMENT: Mike Fricilone for Congress in 3rd District Republican Primary" . Chicago Sun-Times. October 30, 2020. ↑ "Editorial: For the U.S. House: Ives, Kelly, Fricilone, Garcia, Quigley" . Chicago Tribune . October 30, 2020. ↑ "Fricilone earns Chicago police union endorsement in Congressional race" . The Hearald News. October 30, 2020. Archived from the original on November 4, 2020. Retrieved October 31, 2020 . ↑ Ogden & Fry (R) ↑ "GOP congressional candidate in 4th District dies" . www.rblandmark.com . January 21, 2020. Retrieved March 20, 2020 . ↑ Wilson, Marie (July 29, 2019). "Casten seeking second term after 'awesome, humbling' first months in Congress" . Daily Herald . Retrieved August 22, 2019 . ↑ Ortiz, Alex (August 3, 2020). "Obama Endorses, Underwood, Newman for Congress" . Shaw Local . Retrieved February 28, 2021 . 1 2 3 "Endorsements" . Sean Casten for Congress . Retrieved August 1, 2020 . 1 2 3 "Endorsed Candidates — 314actionfund" . 314 Action . Archived from the original on April 4, 2020. Retrieved January 25, 2020 . ↑ Muller, Tiffany (September 30, 2019). "End Citizens United Endorses Seventeen House Democrats" . End Citizens United . 1 2 3 4 5 "JStreetPAC Candidates" . JStreetPAC . Archived from the original on May 2, 2018. Retrieved January 25, 2020 . ↑ Sittenfeld, Tiernan (June 5, 2019). "LCV Action Fund Announces First Round of 2020 Environmental Majority Makers" . League of Conservation Voters . LCV Action Fund. ↑ Hogue, Ilyse (March 8, 2019). "NARAL Announces First Slate of Frontline Pro-Choice Endorsements for 2020" . NARAL Pro-Choice America . Archived from the original on August 5, 2020. Retrieved January 25, 2020 . ↑ "2020 Endorsements" . Population Connection . Archived from the original on September 18, 2020. Retrieved January 25, 2020 . ↑ Lissau, Russell (September 10, 2020). "Former Illinois GOP chair Pat Brady endorses Dem Sean Casten over Jeanne Ives" . Daily Herald . 1 2 "2020 General Primary Democratic Contest Results" . Kane County Clerk. Retrieved April 9, 2020 . 1 2 "MARCH 17, 2020 GENERAL PRIMARY" . Lake County Clerk. April 2, 2020. Retrieved April 9, 2020 . 1 2 "PRIMARY ELECTION MARCH 17, 2020" . McHenry County Clerk. April 2, 2020. Retrieved April 9, 2020 . ↑ Sweet, Lynn (July 18, 2019). "Republican Jeanne Ives jumps in Congress race for Democratic Rep. Casten seat" . Chicago Sun-Times . Retrieved July 18, 2019 . ↑ Hegarty, Erin (October 10, 2019). "Republican surgeon from Glen Ellyn announces primary run for Rep. Sean Casten's seat in 2020" . The Chicago Tribune . Retrieved November 24, 2019 . ↑ Hinz, Greg (October 11, 2019). "Sanguinetti drops out of GOP race in 6th Congressional District" . Crain's Chicago Business . Retrieved October 12, 2019 . ↑ Smith, Katlyn (April 22, 2019). "Sanguinetti aiming for Casten's seat in 6th Congressional District" . Daily Herald . Retrieved April 22, 2019 . ↑ "Ted Cruz Endorses Jeanne Ives for Congress (IL-06)" . February 24, 2020. Archived from the original on October 15, 2020. Retrieved September 24, 2020 . 1 2 3 4 5 "New TV Spot: Republicans Are All in For Jeanne Ives" . March 4, 2020. Archived from the original on September 28, 2020. Retrieved September 24, 2020 . ↑ "Roskam endorses Ives over Sanguinetti for Congress" . Chicago Business. July 24, 2019. ↑ "Editorial: More choices for U.S. House: Quigley, Ives, Davis, Krishnamoorthi, Foster, Bansal ..." Chicago Tribune . February 14, 2020. ↑ "ICYMI: Chicago Tribune Endorses Ives for Congress (IL-06)" . Chicago Tribune . February 17, 2020. Archived from the original on September 13, 2020. Retrieved September 4, 2020 . ↑ "Club for Growth PAC is endorsing Jeanne Ives" . Politico. December 17, 2019. ↑ "House Freedom Fund Endorses Ives in IL-06 Race" . September 11, 2019. Archived from the original on November 12, 2020. Retrieved September 26, 2020 . ↑ "Jeanne Ives is Good for Business" . June 9, 2020. Archived from the original on October 9, 2020. Retrieved September 26, 2020 . ↑ "The GOP Continues to Unite Behind Ives" . January 28, 2020. Archived from the original on September 28, 2020. Retrieved September 26, 2020 . ↑ "Jeanne Ives" . Archived from the original on December 6, 2019. Retrieved January 12, 2020 . ↑ "U.S. Chamber Endorses Jeanne Ives for Illinois' Sixth Congressional District" . October 7, 2020. Retrieved October 7, 2020 . ↑ "2020 General Primary Republican Contest Results" . Kane County Clerk. Retrieved April 9, 2020 . ↑ Ogden & Fry (R) Archived February 13, 2020, at the Wayback Machine ↑ Ogden & Fry/Jeanne for Congress Archived February 13, 2020, at the Wayback Machine ↑ "Rep. Danny Davis announces re-election plans" . San Diego Union-Tribune . September 8, 2019. Retrieved September 25, 2019 . ↑ Schering, Steve (April 9, 2019). "OPRF teacher, community activist Anthony Clark announces second run for Congress" . Chicago Tribune . Retrieved April 9, 2019 . ↑ Romain, Michael (May 22, 2019). "Second activist announces bid to succeed Davis" . Oak Park . Retrieved November 24, 2019 . ↑ Kapos, Shia (July 1, 2019). "FOXX's white liberal election challenge — ATTORNEY eyes DAVIS' seat — KURTH backs WILLIAMSON" . Politico. Retrieved July 1, 2019 . 1 2 3 4 5 6 "Endorsements" . Anthony Clark Democrat for IL-7 Congress . Archived from the original on February 3, 2020. Retrieved February 3, 2020 . ↑ "Anthony Clark Is a Socialist Running for Congress with the Spirit of Fred Hampton at His Back" . lawandcrime.com . December 17, 2019. ↑ Editorial Board (February 12, 2020). "Endorsement: Anthony Clark for Congress in 7th District Democratic primary" . Chicago Sun-Times . ↑ "Anthony Clark" . Brand New Congress . October 21, 2019. Archived from the original on October 23, 2019. Retrieved January 12, 2020 . 1 2 3 4 5 "Endorsements" . Kina Collins for Congress . Archived from the original on April 8, 2020. Retrieved January 31, 2020 . ↑ "Northside Democracy for America" . Northside Democracy for America . Archived from the original on January 4, 2020. Retrieved January 31, 2020 . 1 2 3 4 5 6 7 8 Sheridan, Stacey (January 30, 2020). "Austin congressional hopeful nabs suburban endorsements" . austinweeklynews.com . Archived from the original on January 31, 2020. Retrieved January 31, 2020 . ↑ Janik, Mateusz (October 23, 2019). "Congressman Davis, four challengers report campaign cash raised in third quarter" . ↑ Khalil Ullah, Syed (October 18, 2019). "Inam Hussain announces candidacy for 8th Congressional District" . Patch . Retrieved November 24, 2019 . ↑ "Preston Gabriel Nelson, 8th Congressional District Libertarian nominee profile" . Chicago Sun-Times . September 5, 2020. Retrieved December 4, 2020 . 1 2 Robb, Tom (September 9, 2019). "Challengers On Right, Left, Ready To Face U.S. Reps. Schakowsky, Schneider" . Retrieved September 25, 2019 . ↑ Wang, Andrew [@WangCongress] (December 2, 2019). ".@rlissau @adambroad2020" (Tweet ). Retrieved December 3, 2019 – via Twitter . ↑ "GOP woman running for House says social issues no longer matter" . ThinkProgress . August 29, 2019. Retrieved November 23, 2019 . ↑ Ortiz, Alex (July 19, 2019). "Foster draws 2020 primary challenge from Will County Board member" . mySuburbanLife . Archived from the original on July 19, 2019. Retrieved July 19, 2019 . 1 2 Ortiz, Alex (January 27, 2020). "Durbin, AFL-CIO endorse Foster for reelection to Congress" . Shaw Media . ↑ CST Editorial Board (February 13, 2020). "ENDORSEMENT: Bill Foster for Congress in 11th District Democratic primary" . Chicago Sun-Times . ↑ Chicago Tribune Editorial Board (February 14, 2020). "Editorial: More choices for U.S. House: Quigley, Ives, Davis, Krishnamoorthi, Foster, Bansal" . Chicago Tribune . 1 2 3 4 5 6 "Endorsements" . Rachel Ventura For US Congress, District 11 . Retrieved February 3, 2020 . ↑ "Friends of the Earth Action endorses progressive challengers ahead of Super Tuesday" . February 25, 2020. 1 2 3 4 5 6 7 "Illinois Primary Results 2020" . Politico . Retrieved March 18, 2020 . 1 2 Hegarty, Erin (November 5, 2019). "Naperville Planning and Zoning commissioner, India Day organizer announces run for Foster's seat in 2020" . Chicago Tribune . Naperville Sun. Retrieved November 24, 2019 . ↑ "Rick Laib's Political Summary" . Retrieved September 30, 2020 . ↑ "Illinois Endorsements" . Retrieved September 24, 2020 . 1 2 Bustos, Joseph (September 5, 2019). "These candidates have announced they are running for office in the 2020 election" . Retrieved December 1, 2019 . ↑ "GOP Rep. Bost faces election challenger in former SIU chancellor Dem Lenzi" . September 18, 2019. Retrieved September 25, 2019 . ↑ "Funk announces bid for 12th District seat" . The Daily Telegraph . September 28, 2019. Retrieved November 24, 2019 . 1 2 Palmer, Kenny (June 14, 2020). "INDIVISIBLE ANNOUNCES NEXT WAVE OF CONGRESSIONAL ENDORSEMENTS" . Archived from the original on June 15, 2020. Retrieved June 14, 2020 . ↑ Schoenburg, Bernard (April 11, 2019). "Londrigan to take on Davis again in 13th" . The State Journal-Register . Retrieved April 11, 2019 . ↑ Denham, Ryan; Newgent, Sean (October 11, 2019). "Second Democrat In 13th District Race Backs Single-Payer Health Care, Green New Deal" . Illinois Public Media . Retrieved November 24, 2019 . 1 2 3 "Endorsements" . Stefanie Smith: US Congress in IL-13 . Archived from the original on February 3, 2020. Retrieved February 3, 2020 . ↑ "Slate | Rose Caucus | Political Movement | Socialist" . Archived from the original on January 19, 2020. Retrieved January 19, 2020 . ↑ YouTube 1 2 Obama, Barack (August 3, 2020). "First Wave of 2020 Endorsements" . Medium . ↑ Londrigan, Betsy [@BetsyforIL] (September 14, 2020). "I am honored and humbled to have the support of Vice President @JoeBiden. I am ready to work with Vice President Biden and Senator @KamalaHarris to bring our country together and fight to ensure Central Illinois families have access to quality, affordable health care" (Tweet ). Retrieved September 20, 2020 – via Twitter . ↑ "IL-13: Sen. Dick Durbin (D) Helps Betsy Dirksen Londrigan (D) Get Ready To Unseat Rodney Davis (R)" . Daily Kos . ↑ Londrigan, Betsy [@BetsyforIL] (July 30, 2020). "Thank you Sen. @KamalaHarris for your support and for your kind words. I will always stand up for the working families of Central Illinois and fight to ensure access to quality, affordable health care" (Tweet ). Retrieved December 21, 2020 – via Twitter . ↑ Manar, Andy [@AndyManar] (February 2, 2020). "Let's do this! Join me on Feb 19th at the Blackbird Cafe in Staunton to support @BetsyforIL & Chase Wilhelm for State Representative. #RedtoBlue #Flipthe13th #Macoupin" (Tweet ). Retrieved December 21, 2020 – via Twitter . ↑ "AFSCME Endorsements: 2020 General Election" . AFSCME 31 . ↑ "Illinois State COPE" . Illinois AFL-CIO . January 15, 2020. ↑ Londrigan, Betsy [@BetsyforIL] (March 13, 2020). "Thank you to the @INAaction for your support. Nurses put themselves at risk every day to take care of sick patients. Thank you for your incredible work" (Tweet ). Retrieved December 21, 2020 – via Twitter . 1 2 3 4 Miller, Rich (January 7, 2020). "Congressional roundup" . Capitol Fax . ↑ Londrigan, Betsy [@BetsyforIL] (February 12, 2020). "So true. I hear every day from people around the 13th district who are struggling. I'm proud to be endorsed by Teamsters and look forward to building union power together" (Tweet ). Retrieved December 21, 2020 – via Twitter . ↑ The Editorial Board (October 9, 2020). "Editorial | Our choices for Congress" . The News-Gazette . ↑ Londrigan, Betsy [@BetsyforIL] (October 20, 2020). "Honored to have the support of @ActiveRetirees in my mission to protect and expand Social Security & Medicare. People have paid into this system their entire working lives, and in Congress I will stand up for #IL13 seniors and fight to protect their earned benefits from any cuts" (Tweet ). Retrieved December 21, 2020 – via Twitter . ↑ Londrigan, Betsy [@BetsyforIL] (March 31, 2020). "Thank you so much for your support!" (Tweet ). Retrieved December 21, 2020 – via Twitter . ↑ "Betsy Londrigan for House (IL-13)" . Council for a Livable World . ↑ "Betsy Dirksen Londrigan" . emilyslist.org . Archived from the original on February 14, 2020. Retrieved January 12, 2020 . ↑ Muller, Tiffany (June 26, 2019). "End Citizens United Endorses Betsy Dirksen Londrigan for IL-13" . End Citizens United . ↑ "2020 ENDORSED CANDIDATES" . Gun Sense Voter . Archived from the original on June 16, 2020. Retrieved May 29, 2020 . ↑ "Human Rights Campaign Makes Endorsements to Expand the Pro-Equality Majority in Congress" . June 4, 2020. ↑ Londrigan, Betsy [@BetsyforIL] (May 18, 2020). "I am proud to once again receive the Moms Demand Action Gun Sense Candidate distinction. Together, we can pass common sense gun safety laws like universal background checks and work to end gun violence in our communities" (Tweet ). Retrieved December 21, 2020 – via Twitter . ↑ Hogue, Ilyse (September 3, 2019). "NARAL Pro-Choice America Endorses Betsy Dirksen Londrigan for Congress" . NARAL Pro-Choice America . Archived from the original on August 5, 2020. Retrieved January 25, 2020 . ↑ Londrigan, Betsy [@BetsyforIL] (September 21, 2020). "I'm honored to receive @NCPSSM's endorsement and am ready to work to protect & expand Social Security & Medicare for #IL13 families. People have spent their entire working lives paying into this system, and in Congress I will fight to protect these earned benefits from any cuts" (Tweet ). Retrieved December 21, 2020 – via Twitter . ↑ "NOW PAC Announces First Slate of 2020 Endorsements" . NOW PAC . April 23, 2020. ↑ "Frontier – NewDem Action Fund" . NewDem Action Fund . Archived from the original on January 16, 2020. Retrieved January 25, 2020 . ↑ Newman, Marie [@Marie4Congress] (October 21, 2020). "In 2018, my friend @BetsyforILcame within 1000 votes of flipping #IL13. This time around, she's going to get the job done. Join me in supporting her today!" (Tweet ). Retrieved December 21, 2020 – via Twitter . ↑ Tulchin Research (D) ↑ GBAO Strategies (D) ↑ RMG Research ↑ Associated Press [@AP_Politics]"BREAKING: Democrat Lauren Underwood wins reelection to U.S. House in Illinois' 14th Congressional District. #APracecall at 2:10 p.m. CST. #Election2020 (Tweet ) – via Twitter . ↑ Pearson, Rick (January 5, 2021). "Alleging voting irregularities, state Sen. Jim Oberweis contests Rep. Lauren Underwood's reelection in U.S. House" . Chicago Tribune . Retrieved January 6, 2021 – via chicagotribune.com. ↑ Pearson, Rick (June 29, 2019). "U.S. Rep. Lauren Underwood makes it official: She'll run for a second term" . Chicago Tribune . Retrieved June 29, 2019 . ↑ "Former Obama Health Sr. Advisor Lauren Underwood Runs for Congress | The Chicago Defender" . Chicago Defender . January 27, 2019. Archived from the original on January 27, 2019. ↑ Merica, Dan (May 13, 2020). "Buttigieg highlights importance of local officials in first post-campaign endorsements" . CNN . Retrieved May 14, 2020 . ↑ "Page by Page Report Display (Page 850 of 1022)" . ↑ Board, Daily Herald Editorial (September 12, 2020). "Endorsement: Underwood over Oberweis for Congress from District 14" . Daily Herald . ↑ "Candidates- Black Economic Alliance PAC" . Black Economic Alliance . ↑ "Our Candidates" . Democracy for America . Retrieved May 1, 2020 . ↑ Sittenfeld, Tiernan (August 15, 2019). "LCV Action Fund Announces Second Round of 2020 Environmental Majority Makers" . League of Conservation Voters . LCV Action Fund. ↑ Pearson, Rick (February 18, 2019). "Dairy magnate Jim Oberweis launching GOP challenge to first-term Democratic U.S. Rep. Lauren Underwood" . Chicago Tribune . Archived from the original on February 19, 2019. Retrieved February 18, 2019 . ↑ Ortiz, Alex (March 12, 2019). "St. Charles man announces bid to challenge Underwood in 2020" . The Herald-News . Archived from the original on July 9, 2019. Retrieved March 13, 2019 . ↑ Gradel, Ted [@TedGradel14] (April 23, 2019). "I'm running for Congress in #IL14. As a husband and dad of 3 girls, a dedicated coach and advocate of girls' youth sports in our area, and former @NDFootball player for Lou Holtz, I'm a political outsider through and through. Send me to Washington and I'll kick some tails. #twill" (Tweet ) – via Twitter . ↑ Bowden, Ebony; Hauswirth, Heather (August 22, 2019). "Meet Catalina Lauf, the young Republican congressional hopeful billing herself as the anti-AOC" . New York Post . Retrieved August 22, 2019 . ↑ Girardi, Linda (May 30, 2019). "Former Kendall GOP chairman announces run for Congress in 14th District" . Chicago Tribune . Retrieved May 31, 2019 . ↑ Pearson, Rick (July 9, 2019). "Freshman Democratic Rep. Lauren Underwood gets another GOP challenger" . Chicago Tribune . Retrieved July 9, 2019 . ↑ "Danny Malouf" . Ballotpedia . Retrieved April 12, 2020 . ↑ Quigley, Matt (April 5, 2019). "On January 4th of this year, I was the first individual to announce that I was running for Congress in the 14th Congressional District of Illinois as a candidate in the Republican Party. I held a news conference in front of the Will County Courthouse in Joliet to make that formal announcement" . Retrieved April 8, 2019 – via Facebook. ↑ "SKILLICORN TAKES A PASS ON 14TH CD GOP PRIMARY BID; ENDORSES OBERWEIS" . Illinois Review . September 4, 2019. Retrieved November 28, 2019 . ↑ "Endorsement: Catalina Lauf for Congress (IL-14)" . The New York Young Republican Club . February 19, 2020. Retrieved March 12, 2020 . ↑ "Trump tweets endorsement of Oberweis in Illinois 14th Congressional District race" . October 22, 2020. Retrieved October 22, 2020 . ↑ Schory, Brenda (October 17, 2019). "Marco Rubio to headline Oberweis campaign fundraiser" . Kane County Chronicle . Retrieved March 12, 2020 . ↑ "2020 GOP 6TH & 14TH CONGRESSIONAL CANDIDATES BOAST ENDORSEMENTS" . Illinois Review . January 10, 2020. Retrieved March 12, 2020 . ↑ "Endorsements - Sue Rezin for Congress" . Archived from the original on April 8, 2025. Retrieved March 12, 2020 . ↑ "Editorial: More choices for U.S. House: Quigley, Ives, Davis, Krishnamoorthi, Foster, Bansal ..." Chicago Tribune . February 14, 2020. Retrieved March 12, 2020 . ↑ "Endorsement: Rezin for Republicans in House 14th District" . Daily Herald . February 17, 2020. Retrieved March 12, 2020 . ↑ McLaughlin and Associates ↑ McLaughlin and Associates ↑ "Illinois Primary Election Results: 14th House District" . The New York Times . March 17, 2020. Retrieved March 18, 2020 . ↑ McLaughlin and Associates (R) 1 2 Lally, Caitlin (August 30, 2019). "KMOX EXCLUSIVE: Illinois GOP congressman John Shimkus will not run in 2020" . KMOX News Radio . Retrieved August 30, 2019 . 1 2 Adragna, Anthony. "Rep. John Shimkus sticks to decision to retire from Congress" . POLITICO . Retrieved January 12, 2020 . 1 2 Sapp, Greg (October 23, 2019). "Ellington, Miller Announce Runs for Republican Congressional Nomination" . 97.9 XFM . Retrieved October 23, 2019 . ↑ "Duncan Announces He's Running for Congress" . Vermilion County First. Retrieved November 23, 2019 . ↑ Perry, Scott (October 29, 2019). "Altamont man joins race to replace John Shimkus in Congress" . Journal Gazette & Times-Courier . Retrieved October 29, 2019 . ↑ Walker #MAGA #KAG 🇺🇸, 🇺🇸Alex (November 25, 2019). "For immediate release...pic.twitter.com/oQxnxbGG4o" . Retrieved January 12, 2020 . ↑ Ditman, Tim (September 17, 2019). "Harold doesn't plan to make run for Congress" . Champaign/Urbana News-Gazette . Retrieved September 17, 2019 . ↑ Bustos, Joseph (September 3, 2019). "State representative to explore run to replace Shimkus in 15th district" . Belleville News-Democrat . Retrieved September 3, 2019 . 1 2 3 Bustos, Joseph (September 13, 2019). "With Shimkus not running, which notable GOP names will enter the 15th district race?" . Belleville News-Democrat . Retrieved September 13, 2019 . 1 2 Schoenburg, Bernard (December 4, 2019). "Schoenburg: Despite distance, Gray thinks he's best for 15th" . The State Journal-Register . Retrieved December 12, 2019 . ↑ Bustos, Joseph (September 11, 2019). "Democrat who lost a bid for Congress in 2018 wants another chance" . Belleville News-Democrat . Retrieved September 13, 2019 . ↑ Bustos, Joseph (July 22, 2019). "Democrat to challenge Shimkus but admits he doesn't have 'a chance in hell of winning' . Belleville News-Democrat . Retrieved September 3, 2019 . ↑ "Mary Miller - Susan B. Anthony List" . Archived from the original on June 15, 2020. Retrieved June 14, 2020 . ↑ Hinz, Greg (August 5, 2019). "Kinzinger set to run for the U.S. House again" . Crain's Chicago Business . Retrieved August 22, 2019 . ↑ Barichello, David (September 13, 2019). "La Salle Democrat to challenge U.S. Rep. Kinzinger in 2020" . Retrieved September 25, 2019 . 1 2 3 4 5 6 7 8 9 10 11 12 13 14 15 16 17 18 19 20 21 22 23 24 25 26 27 28 "Endorsements" . Dani for Illinois . Archived from the original on June 29, 2020. Retrieved June 29, 2020 . ↑ "Dani Brzozowski" – via Facebook. ↑ "Dani Brzozowski" – via Facebook. ↑ "Dani Brzozowski" – via Facebook. ↑ "Bill Foster Endorsement" – via Facebook. ↑ "Chuy Garcia Support Video" – via Facebook. ↑ "Congresswoman Robin Kelly Endorsement" – via Facebook. ↑ "Dani Brzozowski" – via Facebook. ↑ BarichelloEmailFollow, Derek. "Congressional candidate Dani Brzozowski is looking to continue blue wave" . www.mywebtimes.com . Archived from the original on May 25, 2020. Retrieved August 1, 2020 . ↑ "Representative Lauren Underwood Support Video" – via Facebook. ↑ "Dani Brzozowski" – via Facebook. ↑ Brzozowski, Dani [@DaniForCongress] (March 3, 2020). ".@INAaction is the largest Nurses' Union in Illinois, representing thousands of hardworking women and men. I am beyond thrilled to have their support in our race to flip the 16th! #IL16" (Tweet ). Retrieved December 21, 2020 – via Twitter . ↑ "Dani Brzozowski" – via Facebook. ↑ Brzozowski, Dani [@DaniForCongress] (February 20, 2020). "I am pleased to announce that we have earned the support of the Independent Voters of Illinois-Independent Precinct Organization! IVI-IPO, established in 1944, is an independent organization that supports honest government. I am thrilled to have them on #TeamDani!" (Tweet ). Retrieved December 21, 2020 – via Twitter . ↑ "Dani Brzozowski" – via Facebook. ↑ Brzozowski, Dani [@DaniForCongress] (February 26, 2020). "The company you keep. ❤️ I am so honored to join the likes of Lauren Underwood, Marie Newman, and Betsy Dirksen Londrigan on the list of women endorsed by @NationalNOWPAC. #IL16" (Tweet ). Retrieved January 21, 2021 – via Twitter . ↑ Brzozowski, Dani [@DaniForCongress] (May 20, 2020). "BIG news today: I am thrilled to have the support of @PPact!🎉🎉 Their endorsement shows the momentum behind our campaign to fight for the people of #IL16. We are going to win this race. And when we do, I will head to Congress a champion for choice. Let's do the damn thing" (Tweet ). Retrieved December 21, 2020 – via Twitter . ↑ Brzozowski, Dani [@DaniForCongress] (August 24, 2020). "I'm honored to have the endorsement of @SierraClub – particularly because our district is full of beautiful fields, prairies, rivers, lakes, and valleys. I'm running for Congress to protect our fields and families, and to create sustainable, clean energy jobs in #IL16" (Tweet ). Retrieved December 21, 2020 – via Twitter . ↑ "Dani Brzozowski" – via Facebook. ↑ "Citizens for Responsible Energy formally endorses U.S. Rep Adam Kinzinger for Congress" . Citizens for Responsible Energy Solutions . Archived from the original (Press release) on May 24, 2021. Retrieved May 24, 2021 . ↑ Coleman, J. Miles (February 4, 2021). "2020's Crossover Districts" . University of Virginia’s Center for Politics — Sabato’s Crystal Ball . ↑ Shelley, Tim (November 18, 2019). "Peoria Democrat Spanky Edwards Looks to Challenge Cheri Bustos" . Northern Public Radio . Retrieved November 24, 2019 . ↑ Hayden, Sarah (August 21, 2019). "Republican attorney to challenge Cheri Bustos for U.S. congressional seat next year" . The Dispatch / The Rock Island Argus . Retrieved August 22, 2019 . ↑ Eggemeier, Pam (September 25, 2019). "Fawell officially launches another run in 17th District" . Archived from the original on September 26, 2019. Retrieved September 27, 2019 . ↑ "Endorsed Candidates" . End Citizens United . Archived from the original on December 8, 2019. Retrieved January 25, 2020 . ↑ Trump, Donald [@realDonaldTrump] (October 31, 2020). "We need Esther Joy King (@Esther4Congress) in Congress for Illinois! She is a Strong Supporter of our #MAGA agenda and she's running against a Total Fraud who the Democrats are now rushing to save. Esther has my Complete and Total Endorsement! #IL17" (Tweet ). Retrieved December 21, 2020 – via Twitter . ↑ "Esther Joy King" . Archived from the original on January 3, 2020. Retrieved January 12, 2020 . ↑ Tarrance Group (R) ↑ Public Opinion Strategies (R) ↑ Vlahos, Nick (August 14, 2019). "U.S. Rep. Darin LaHood says he's running for re-election in 2020" . The State Journal-Register . Retrieved August 22, 2019 . ↑ Packowitz, Howard (July 25, 2020). "LaHood's Democratic challenger gears up for fall campaign" . WEEK-TV . Archived from the original on September 13, 2020. Retrieved August 26, 2020 . ↑ Schoenburg, Bernard (October 23, 2019). "Democrat announces bid against Darin LaHood" . Retrieved November 3, 2019 . External links Find your district/elected officials
Official campaign websites for 1st district candidates
Official campaign websites for 2nd district candidates
Official campaign websites for 3rd district candidates
Official campaign websites for 4th district candidates
Official campaign websites for 5th district candidates
Official campaign websites for 6th district candidates
Official campaign websites for 7th district candidates
Official campaign websites for 8th district candidates
Official campaign websites for 9th district candidates
Official campaign websites for 10th district candidates
Official campaign websites for 11th district candidates
Official campaign websites for 12th district candidates
Official campaign websites for 13th district candidates
Official campaign websites for 14th district candidates
Official campaign websites for 15th district candidates
Official campaign websites for 16th district candidates
Official campaign websites for 17th district candidates
Official campaign websites for 18th district candidates
By year Presidential U.S. Senate U.S. House Special Gubernatorial Lieutenant gubernatorial Other state executive offices Attorney General Secretary of State Comptroller State Senate State House State judicial Ballot measures and referendums Chicago mayoral Chicago City Council Other municipal Cook County
U.S. U.S. U.S. (election ) Governors Attorneys Secretaries State State Alaska Arizona Arkansas California Colorado Connecticut Delaware Florida Georgia Hawaii Idaho Illinois Indiana Iowa Kansas Kentucky Maine Massachusetts Michigan House Minnesota Missouri Montana Nebraska Nevada New Hampshire New Mexico New York North Carolina North Dakota Ohio Oklahoma Oregon Pennsylvania Puerto Rico Rhode Island South Carolina South Dakota Tennessee Texas Utah Vermont Washington West Virginia Wisconsin Wyoming Mayors Bakersfield, CA Baltimore, MD Baton Rouge, LA Clearwater, FL Corpus Christi, TX El Paso, TX Fort Lauderdale, FL Fresno, CA Honolulu, HI Irvine, CA Lubbock, TX Macon, GA Mesa, AZ Miami-Dade County, FL Milwaukee, WI Phoenix, AZ Portland, OR Richmond, VA Riverside, CA Sacramento, CA Salt Lake County, UT San Diego, CA San Juan, PR Santa Ana, CA Stockton, CA Tulsa, OK Virginia Beach, VA Wilmington, DE Winston-Salem, NC Local Bay County, MI Clearwater, FL Cook County, IL DeKalb County, GA Los Angeles, CA Los Angeles County, CA Milwaukee County, WI New Castle County, DE Oakland County, MI Orange County, CA Portland, OR St. Louis County, MO San Diego, CA San Diego County, CA San Francisco, CA Summit County, OH Volusia County, FL Washington, D.C. Will County, IL Statewide Related
This page is based on this
Wikipedia article Text is available under the
CC BY-SA 4.0 license; additional terms may apply.
Images, videos and audio are available under their respective licenses.