Grundy County | |
---|---|
Coordinates: 41°17′N88°26′W / 41.29°N 88.43°W | |
Country | United States |
State | Illinois |
Founded | February 17, 1841 |
Named for | Felix Grundy |
Seat | Morris |
Largest city | Morris |
Area | |
• Total | 430 sq mi (1,100 km2) |
• Land | 418 sq mi (1,080 km2) |
• Water | 12 sq mi (30 km2) 2.9% |
Population (2020) | |
• Total | 52,533 |
• Density | 120/sq mi (47/km2) |
Time zone | UTC−6 (Central) |
• Summer (DST) | UTC−5 (CDT) |
Congressional district | 16th |
Website | www |
Grundy County is a county in the U.S. state of Illinois. According to the 2020 census, it has a population of 52,533. [1] Its county seat is Morris. [2]
Grundy County is part of the Chicago-Naperville-Elgin, IL-IN-WI Metropolitan Statistical Area.
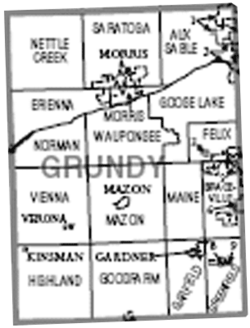
In 2010, the center of population of Illinois was in Grundy County, just northeast of the village of Mazon. [3]
Illinois's state fossil, the unique and bizarre Tully Monster, was first found in Mazon Creek. Grundy County is home to Dresden Generating Station—the first privately financed nuclear power plant built in the United States—and the Morris Operation—the only de facto high-level radioactive waste storage site in the United States.
Grundy County was established on February 17, 1841. It was formed out of LaSalle County and named after U.S. Attorney General Felix Grundy (1777–1840). [4] The county was well known for its coal mines [5] and attracted miners from Pennsylvania and other regions to work its deposits. The 1883 Diamond Mine Disaster occurred in Grundy County. The disaster took the lives of 69 men and boys who were trapped underground when water broke through into the mine after days of heavy rain and the pumps could not keep up with the rising water. 22 bodies were eventually recovered, the remaining 44 were left in the mine and the mine was sealed. Today a marker stands near where it was believed the majority of victims were entombed. [6]
According to the U.S. Census Bureau, the county has a total area of 430 square miles (1,100 km2), of which 418 square miles (1,080 km2) is land and 12 square miles (31 km2) (2.9%) is water. [7]
Morris, Illinois | ||||||||||||||||||||||||||||||||||||||||||||||||||||||||||||
---|---|---|---|---|---|---|---|---|---|---|---|---|---|---|---|---|---|---|---|---|---|---|---|---|---|---|---|---|---|---|---|---|---|---|---|---|---|---|---|---|---|---|---|---|---|---|---|---|---|---|---|---|---|---|---|---|---|---|---|---|
Climate chart (explanation) | ||||||||||||||||||||||||||||||||||||||||||||||||||||||||||||
| ||||||||||||||||||||||||||||||||||||||||||||||||||||||||||||
|
In recent years, average temperatures in the county seat of Morris have ranged from a low of 13 °F (−11 °C) in January to a high of 85 °F (29 °C) in July, although a record low of −24 °F (−31 °C) was recorded in January 1985 and a record high of 103 °F (39 °C) was recorded in June 1988. Average monthly precipitation ranged from 1.59 inches (40 mm) in February to 4.16 inches (106 mm) in June. [8]
Census | Pop. | Note | %± |
---|---|---|---|
1850 | 3,023 | — | |
1860 | 10,379 | 243.3% | |
1870 | 14,938 | 43.9% | |
1880 | 16,732 | 12.0% | |
1890 | 21,024 | 25.7% | |
1900 | 24,136 | 14.8% | |
1910 | 24,162 | 0.1% | |
1920 | 18,580 | −23.1% | |
1930 | 18,678 | 0.5% | |
1940 | 18,398 | −1.5% | |
1950 | 19,217 | 4.5% | |
1960 | 22,350 | 16.3% | |
1970 | 26,535 | 18.7% | |
1980 | 30,582 | 15.3% | |
1990 | 32,337 | 5.7% | |
2000 | 37,535 | 16.1% | |
2010 | 50,063 | 33.4% | |
2020 | 52,533 | 4.9% | |
2023 (est.) | 53,578 | [9] | 2.0% |
U.S. Decennial Census [10] 1790-1960 [11] 1900-1990 [12] 1990-2000 [13] 2010 [14] |
As of the 2010 United States Census, there were 50,063 people, 18,546 households, and 13,431 families residing in the county. [15] The population density was 119.8 inhabitants per square mile (46.3/km2). There were 19,996 housing units at an average density of 47.8 per square mile (18.5/km2). [7] The racial makeup of the county was 93.7% white, 1.2% black or African American, 0.7% Asian, 0.2% American Indian, 2.7% from other races, and 1.5% from two or more races. Those of Hispanic or Latino origin made up 8.2% of the population. [15] In terms of ancestry, 28.3% were German, 23.0% were Irish, 12.7% were Italian, 9.4% were Polish, 8.6% were English, 7.1% were Norwegian, and 3.0% were American. [16]
Of the 18,546 households, 38.6% had children under the age of 18 living with them, 57.8% were married couples living together, 9.7% had a female householder with no husband present, 27.6% were non-families, and 22.5% of all households were made up of individuals. The average household size was 2.69 and the average family size was 3.16. The median age was 36.1 years. [15]
The median income for a household in the county was $64,297 and the median income for a family was $75,000. Males had a median income of $58,491 versus $36,592 for females. The per capita income for the county was $27,895. About 5.2% of families and 6.9% of the population were below the poverty line, including 8.0% of those under age 18 and 6.5% of those age 65 or over. [17]
Grundy County is divided into seventeen townships:
Year | Republican | Democratic | Third party | |||
---|---|---|---|---|---|---|
No. | % | No. | % | No. | % | |
2020 | 16,523 | 61.75% | 9,626 | 35.98% | 607 | 2.27% |
2016 | 13,454 | 57.90% | 8,065 | 34.71% | 1,718 | 7.39% |
2012 | 11,343 | 53.22% | 9,451 | 44.34% | 519 | 2.44% |
2008 | 10,687 | 48.07% | 11,063 | 49.76% | 482 | 2.17% |
2004 | 11,198 | 56.47% | 8,463 | 42.68% | 170 | 0.86% |
2000 | 8,709 | 52.51% | 7,516 | 45.32% | 359 | 2.16% |
1996 | 6,177 | 41.45% | 6,759 | 45.36% | 1,966 | 13.19% |
1992 | 6,346 | 39.02% | 6,122 | 37.64% | 3,797 | 23.34% |
1988 | 8,743 | 60.88% | 5,525 | 38.47% | 93 | 0.65% |
1984 | 9,595 | 66.98% | 4,671 | 32.61% | 59 | 0.41% |
1980 | 8,397 | 63.59% | 3,970 | 30.07% | 837 | 6.34% |
1976 | 7,581 | 57.43% | 5,534 | 41.92% | 86 | 0.65% |
1972 | 8,725 | 70.70% | 3,584 | 29.04% | 32 | 0.26% |
1968 | 6,607 | 59.50% | 3,407 | 30.68% | 1,091 | 9.82% |
1964 | 5,522 | 51.28% | 5,246 | 48.72% | 0 | 0.00% |
1960 | 6,948 | 61.88% | 4,276 | 38.08% | 4 | 0.04% |
1956 | 7,640 | 74.46% | 2,618 | 25.51% | 3 | 0.03% |
1952 | 7,347 | 70.12% | 3,118 | 29.76% | 13 | 0.12% |
1948 | 5,954 | 64.44% | 3,255 | 35.23% | 31 | 0.34% |
1944 | 6,310 | 63.89% | 3,544 | 35.88% | 22 | 0.22% |
1940 | 6,593 | 61.38% | 4,105 | 38.22% | 43 | 0.40% |
1936 | 5,360 | 52.63% | 4,481 | 44.00% | 344 | 3.38% |
1932 | 4,491 | 48.21% | 4,755 | 51.05% | 69 | 0.74% |
1928 | 5,126 | 61.54% | 3,174 | 38.11% | 29 | 0.35% |
1924 | 4,337 | 63.97% | 742 | 10.94% | 1,701 | 25.09% |
1920 | 4,647 | 80.05% | 803 | 13.83% | 355 | 6.12% |
1916 | 4,811 | 66.37% | 2,241 | 30.91% | 197 | 2.72% |
1912 | 1,919 | 36.41% | 1,172 | 22.24% | 2,179 | 41.35% |
1908 | 3,127 | 63.08% | 1,359 | 27.42% | 471 | 9.50% |
1904 | 3,448 | 69.73% | 841 | 17.01% | 656 | 13.27% |
1900 | 3,735 | 65.50% | 1,687 | 29.59% | 280 | 4.91% |
1896 | 3,246 | 59.68% | 2,074 | 38.13% | 119 | 2.19% |
1892 | 2,159 | 50.26% | 1,892 | 44.04% | 245 | 5.70% |
Clinton County is a county located in the U.S. state of Illinois. At the 2020 census, the population was 36,899. Its county seat is Carlyle.
Lee County is a county located in the U.S. state of Illinois. According to the 2020 census, it has a population of 34,145. Its county seat is Dixon. The Dixon, IL Micropolitan Statistical Area includes all of Lee County.
Henderson County is a county located in the U.S. state of Illinois. According to the 2020 United States Census, it has a population of 6,387. Its county seat is Oquawka.
Franklin County is a county in Southern Illinois. At the 2020 census, it had a population of 37,804. The largest city is West Frankfort and the county seat is Benton. This area of Southern Illinois is known locally as "Little Egypt".
Braceville is a village in Will County, Illinois, United States, with a portion in Grundy County. The population was 724 at the 2020 census.
Mazon is a village in Mazon Township, Grundy County, Illinois, United States. The name derives from the Potawatomi word for "nettles" (mzan). The population was 979 at the 2020 census. Illinois' State Fossil, the unique and bizarre Tully Monster was first found in nearby Mazon Creek. Mazon was formerly served by the Santa Fe railway at the Mazon Depot. It was established in 1876.
Morris is a city in and the county seat of Grundy County, Illinois, United States and part of the southwest Chicago metropolitan area. The population was 14,163 as of the 2020 census.
Seneca is a village in LaSalle and Grundy counties in the U.S. state of Illinois. The population was 2,353 at the 2020 census, down from 2,371 at the 2010 census.
South Wilmington is a village in Grundy County, Illinois, United States. The population was 710 at the 2020 census.
Mount Morris is a village in Mount Morris Township, Ogle County, Illinois, United States. The population was 2,998 at the 2010 census, down from 3,013 in 2000.
Aux Sable Township is one of seventeen townships in Grundy County, Illinois, USA. As of the 2020 census, its population was 15,361 and it contained 5,184 housing units.
Braceville Township is one of seventeen townships in Grundy County, Illinois, USA. As of the 2010 census, its population was 6,463 and it contained 2,617 housing units.
Erienna Township is one of seventeen townships in Grundy County, Illinois, USA. As of the 2020 census, its population was 2,408 and it contained 974 housing units.
Felix Township is one of seventeen townships in Grundy County, Illinois, USA. As of the 2020 census, its population was 4,438 and it contained 1,923 housing units.
Goose Lake Township is one of seventeen townships in Grundy County, Illinois, USA. As of the 2020 census, its population was 1,755 and it contained 811 housing units.
Mazon Township is one of seventeen townships in Grundy County, Illinois, USA. As of the 2020 census, its population was 1,503 and it contained 591 housing units.
Morris Township is one of seventeen townships in Grundy County, Illinois, USA. As of the 2020 United States Census, its population was 7,139 and it contained 3,353 housing units.
Saratoga Township is one of seventeen townships in Grundy County, Illinois, USA. As of the 2020 census, its population was 6,342 and it contained 2,681 housing units.
Vienna Township is one of seventeen townships in Grundy County, Illinois, USA. As of the 2020 census, its population was 666 and it contained 267 housing units.
Wauponsee Township is one of seventeen townships in Grundy County, Illinois, USA. As of the 2020 census, its population was 2,289 and it contained 953 housing units.