| |||||||||||||||||||||||||||||||
All 100 seats in the Indiana House of Representatives 51 seats needed for a majority | |||||||||||||||||||||||||||||||
---|---|---|---|---|---|---|---|---|---|---|---|---|---|---|---|---|---|---|---|---|---|---|---|---|---|---|---|---|---|---|---|
| |||||||||||||||||||||||||||||||
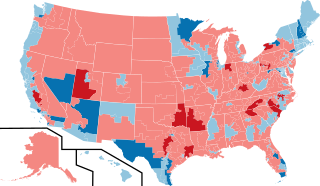
Results: Democratic hold Democratic gain Republican hold Republican gain | |||||||||||||||||||||||||||||||
|
Elections in Indiana |
---|
The 2020 elections for the Indiana House of Representatives were held on Tuesday, November 3, 2020, to elect representatives from all 100 districts. The primary election occurred on June 2, 2020. The Republican Party has held a House majority since 2010. [1] Indiana legislators assume office on the second Tuesday after the general election.
The elections for the United States President, Indiana's 9 congressional districts, Indiana's Governor race, and the Indiana Senate were held on this date.
Source | Ranking | As of |
---|---|---|
The Cook Political Report [2] | Safe R | October 21, 2020 |
2020 Indiana State House General Election [3] | ||||||||
---|---|---|---|---|---|---|---|---|
Party | Votes | Percentage | % Change | Candidates | Seats before | Seats after | +/– | |
Republican | 1,276,363 | 59.42% | 85 | 67 | 71 | 4 | ||
Democratic | 857,461 | 39.92% | 83 | 34 | 29 | 4 | ||
Libertarian | 10,059 | 0.47% | 5 | 0 | 0 | |||
Independent | 4,186 | 0.19% | 1 | 0 | 0 | |||
Totals | 2,148,069 | 100.00% | — | 174 | 100 | 100 | — |
Party | Candidate | Votes | % | |
---|---|---|---|---|
Democratic | Carolyn Jackson (incumbent) | Unopposed | 100.0 | |
Total votes | 100.0 | |||
Democratic hold |
Party | Candidate | Votes | % | |
---|---|---|---|---|
Democratic | Earl Harris (incumbent) | Unopposed | 100.0 | |
Total votes | 100.0 | |||
Democratic hold |
Party | Candidate | Votes | % | |
---|---|---|---|---|
Democratic | Ragen Hatcher (incumbent) | Unopposed | 100.0 | |
Total votes | 100.0 | |||
Democratic hold |
Party | Candidate | Votes | % | |
---|---|---|---|---|
Republican | Ed Soliday (incumbent) | 20,072 | 54.6 | |
Democratic | Debora Porter | 16,704 | 45.4 | |
Total votes | 36,776 | 100.0 | ||
Republican hold |
Party | Candidate | Votes | % | |
---|---|---|---|---|
Republican | Dale DeVon (incumbent) | 14,617 | 50.7 | |
Democratic | Donald Westerhausen | 14,190 | 49.3 | |
Total votes | 28,807 | 100.0 | ||
Republican hold |
Democrat B. Patrick Bauer announced he would be not seek re-election. There were three Democrats running in the primaries including Bauer's daughter, Maureen Bauer. [8]
Party | Candidate | Votes | % | |
---|---|---|---|---|
Democratic | Maureen Bauer | Unopposed | 100 | |
Total votes | 100.0 | |||
Democratic hold |
Party | Candidate | Votes | % | |
---|---|---|---|---|
Republican | Jake Teshka | 14,668 | 54.0 | |
Democratic | Ross Deal (incumbent) | 12,498 | 46.0 | |
Total votes | 27,166 | 100.0 | ||
Republican gain from Democratic |
Party | Candidate | Votes | % | |
---|---|---|---|---|
Democratic | Ryan Dvorak (incumbent) | 16,554 | 56.8 | |
Republican | Timothy Jaycox | 12,568 | 43.2 | |
Total votes | 29,122 | 100.0 | ||
Democratic hold |
Party | Candidate | Votes | % | |
---|---|---|---|---|
Democratic | Patricia Boy (incumbent) | 15,781 | 56.6 | |
Republican | Dion Bergeron | 12,096 | 43.4 | |
Total votes | 27,877 | 100.0 | ||
Democratic hold |
Party | Candidate | Votes | % | |
---|---|---|---|---|
Democratic | Charles Moseley (incumbent) | Unopposed | 100 | |
Total votes | 100.0 | |||
Democratic hold |
Party | Candidate | Votes | % | |
---|---|---|---|---|
Republican | Michael Aylesworth (incumbent) | 25,742 | 68.8 | |
Democratic | Keegan Damron | 11,697 | 31.2 | |
Total votes | 37,439 | 100.0 | ||
Republican hold |
Democrat Mara Candelaria Reardon announced she would be not seek re-election in the 12th district leaving the seat open. [15]
Party | Candidate | Votes | % | |
---|---|---|---|---|
Democratic | Mike Andrade | 18,733 | 57.7 | |
Republican | Tom Wichlinski | 13,730 | 42.3 | |
Total votes | 37,439 | 100.0 | ||
Democratic hold |
Party | Candidate | Votes | % | |
---|---|---|---|---|
Republican | Sharon Negele (incumbent) | 22,080 | 72.8 | |
Democratic | Keegan Damron | 8,256 | 27.2 | |
Total votes | 30,336 | 100.0 | ||
Republican hold |
Party | Candidate | Votes | % | |
---|---|---|---|---|
Democratic | Vernon Smith (incumbent) | Unopposed | 100.0 | |
Total votes | 100.0 | |||
Democratic hold |
Party | Candidate | Votes | % | |
---|---|---|---|---|
Republican | Hal Slager | 17,813 | 51.5 | |
Democratic | Chris Chyung (incumbent) | 16,751 | 48.5 | |
Total votes | 34,564 | 100.0 | ||
Republican gain from Democratic |
Party | Candidate | Votes | % | |
---|---|---|---|---|
Republican | Douglas Gutwein (incumbent) | 21,686 | 74.1 | |
Democratic | Michael Lovely | 7,573 | 25.9 | |
Total votes | 29,259 | 100.0 | ||
Republican hold |
Party | Candidate | Votes | % | |
---|---|---|---|---|
Republican | Jack Jordan (incumbent) | 19,955 | 74.7 | |
Democratic | Bianka Tinklenberg | 6,748 | 25.3 | |
Total votes | 26,703 | 100.0 | ||
Republican hold |
Republican incumbent David Wolkins did not file to run for re-election. [22]
Party | Candidate | Votes | % | |
---|---|---|---|---|
Republican | Craig Snow | 22,637 | 78.1 | |
Democratic | Chad Harris | 6,353 | 21.9 | |
Total votes | 28,990 | 100.0 | ||
Republican hold |
Party | Candidate | Votes | % | |
---|---|---|---|---|
Republican | Julie Olthoff | 19,496 | 51.8 | |
Democratic | Lisa Beck (incumbent) | 18,135 | 48.2 | |
Total votes | 29,259 | 100.0 | ||
Republican gain from Democratic |
Party | Candidate | Votes | % | |
---|---|---|---|---|
Republican | Jim Pressel (incumbent) | 20,028 | 68.2 | |
Democratic | Tim Gust | 9,322 | 31.8 | |
Total votes | 29,350 | 100.0 | ||
Republican hold |
Party | Candidate | Votes | % | |
---|---|---|---|---|
Republican | Timothy Wesco (incumbent) | 15,346 | 64.5 | |
Democratic | Ryan Liedtky | 8,446 | 35.5 | |
Total votes | 29,350 | 100.0 | ||
Republican hold |
Party | Candidate | Votes | % | |
---|---|---|---|---|
Republican | Curt Nisly (incumbent) | 20,694 | 72.1 | |
Democratic | Kelly Thompson | 8,003 | 27.9 | |
Total votes | 28,697 | 100.0 | ||
Republican hold |
Party | Candidate | Votes | % | |
---|---|---|---|---|
Republican | Ethan Manning (incumbent) | Unopposed | 100 | |
Total votes | 100.0 | |||
Republican hold |
Party | Candidate | Votes | % | |
---|---|---|---|---|
Republican | Donna Schaibley (incumbent) | 30,321 | 58.1 | |
Democratic | Naomi Bechtold | 21,853 | 41.9 | |
Total votes | 52,174 | 100.0 | ||
Republican hold |
Party | Candidate | Votes | % | |
---|---|---|---|---|
Republican | Donald Lehe (incumbent) | 22,475 | 70.3 | |
Democratic | Naomi Bechtold | 9,500 | 29.7 | |
Total votes | 31,975 | 100.0 | ||
Republican hold |
Party | Candidate | Votes | % | |
---|---|---|---|---|
Democratic | Chris Campbell (incumbent) | Unopposed | 100 | |
Total votes | 100.0 | |||
Democratic hold |
Party | Candidate | Votes | % | |
---|---|---|---|---|
Democratic | Sheila Klinker (incumbent) | 14,631 | 62.1 | |
Republican | James Hass | 8,934 | 37.9 | |
Total votes | 31,975 | 100.0 | ||
Democratic hold |
Party | Candidate | Votes | % | |
---|---|---|---|---|
Republican | Jeff Thompson (incumbent) | 27,826 | 71.5 | |
Democratic | Eric Shotwell | 11,075 | 28.5 | |
Total votes | 31,975 | 100.0 | ||
Republican hold |
Party | Candidate | Votes | % | |
---|---|---|---|---|
Republican | Chuck Goodrich (incumbent) | 27,618 | 66.0 | |
Democratic | Mike Vick | 14,228 | 34.0 | |
Total votes | 41,846 | 100.0 | ||
Republican hold |
Party | Candidate | Votes | % | |
---|---|---|---|---|
Republican | Mike Karickhoff (incumbent) | 19,226 | 66.1 | |
Democratic | Dylan McHenry | 9,839 | 33.9 | |
Total votes | 29,065 | 100.0 | ||
Republican hold |
Party | Candidate | Votes | % | |
---|---|---|---|---|
Republican | Ann Vermilion (incumbent) | Unopposed | 100 | |
Total votes | 100.0 | |||
Republican hold |
Party | Candidate | Votes | % | |
---|---|---|---|---|
Republican | Anthony Cook (incumbent) | 26,430 | 75.4 | |
Democratic | Amie Neiling | 8,615 | 24.6 | |
Total votes | 35,045 | 100.0 | ||
Republican hold |
Party | Candidate | Votes | % | |
---|---|---|---|---|
Republican | John Prescott (incumbent) | 20,198 | 72.5 | |
Democratic | Amie Neiling | 7,649 | 27.5 | |
Total votes | 27,847 | 100.0 | ||
Republican hold |
Party | Candidate | Votes | % | |
---|---|---|---|---|
Democratic | Sue Errington (incumbent) | 11,293 | 56.4 | |
Republican | Dale Basham | 8,744 | 43.6 | |
Total votes | 20,037 | 100.0 | ||
Democratic hold |
Party | Candidate | Votes | % | |
---|---|---|---|---|
Republican | Elizabeth Rowray | 16,767 | 55.3 | |
Democratic | Melanie Wright (incumbent) | 13,570 | 44.7 | |
Total votes | 30,337 | 100.0 | ||
Republican gain from Democratic |
Party | Candidate | Votes | % | |
---|---|---|---|---|
Democratic | Terri Austin (incumbent) | 12,951 | 53.0 | |
Republican | Kyle Pierce | 11,485 | 47.0 | |
Total votes | 24,436 | 100.0 | ||
Democratic hold |
Party | Candidate | Votes | % | |
---|---|---|---|---|
Republican | Todd Huston (incumbent) | 24,591 | 56.2 | |
Democratic | Aimee Cole | 19,159 | 43.8 | |
Total votes | 43,750 | 100.0 | ||
Republican hold |
Party | Candidate | Votes | % | |
---|---|---|---|---|
Republican | Heath VanNatter (incumbent) | 20,746 | 71.5 | |
Democratic | Tom Hedde | 8,272 | 28.5 | |
Total votes | 29,018 | 100.0 | ||
Republican hold |
Party | Candidate | Votes | % | |
---|---|---|---|---|
Republican | Jerry Torr (incumbent) | 23,396 | 53.6 | |
Democratic | Ashley Klein | 20,262 | 46.4 | |
Total votes | 43,658 | 100.0 | ||
Republican hold |
Party | Candidate | Votes | % | |
---|---|---|---|---|
Republican | Gregory Steuerwald (incumbent) | 24,004 | 60.0 | |
Democratic | Kevin Short | 15,974 | 40.0 | |
Total votes | 39,978 | 100.0 | ||
Republican hold |
Party | Candidate | Votes | % | |
---|---|---|---|---|
Republican | Tim Brown (incumbent) | 22,639 | 75.3 | |
Democratic | Greg Woods | 7,407 | 24.7 | |
Total votes | 30,046 | 100.0 | ||
Republican hold |
Party | Candidate | Votes | % | |
---|---|---|---|---|
Republican | Alan Morrison (incumbent) | 18,945 | 66.8 | |
Democratic | Amy Adams | 9,421 | 33.2 | |
Total votes | 28,366 | 100.0 | ||
Republican hold |
Party | Candidate | Votes | % | |
---|---|---|---|---|
Democratic | Tonya Pfaff (incumbent) | 13,172 | 57.5 | |
Republican | Bill Treadway | 9,722 | 42.5 | |
Total votes | 22,894 | 100.0 | ||
Republican hold |
Party | Candidate | Votes | % | |
---|---|---|---|---|
Republican | Beau Baird (incumbent) | Unopposed | 100 | |
Total votes | 100.0 | |||
Republican hold |
Party | Candidate | Votes | % | |
---|---|---|---|---|
Republican | Bruce Borders (incumbent) | Unopposed | 100 | |
Total votes | 100.0 | |||
Republican hold |
Party | Candidate | Votes | % | |
---|---|---|---|---|
Republican | Bob Heaton (incumbent) | Unopposed | 100 | |
Total votes | 100.0 | |||
Republican hold |
Party | Candidate | Votes | % | |
---|---|---|---|---|
Republican | John Young (incumbent) | Unopposed | 100 | |
Total votes | 100.0 | |||
Republican hold |
Party | Candidate | Votes | % | |
---|---|---|---|---|
Republican | Doug Miller (incumbent) | 16,430 | 64.3 | |
Democratic | Aaron Mishler | 9,105 | 35.7 | |
Total votes | 25,535 | 100.0 | ||
Republican hold |
Party | Candidate | Votes | % | |
---|---|---|---|---|
Republican | Christy Stutzman (incumbent) | 16,539 | 66.5 | |
Democratic | Amanda Qualls | 8,341 | 33.5 | |
Total votes | 24,880 | 100.0 | ||
Republican hold |
Party | Candidate | Votes | % | |
---|---|---|---|---|
Republican | Dan Leonard (incumbent) | 21,418 | 71.5 | |
Democratic | Jorge Fernandez | 8,517 | 28.5 | |
Total votes | 29,935 | 100.0 | ||
Republican hold |
Party | Candidate | Votes | % | |
---|---|---|---|---|
Republican | Dennis Zent (incumbent) | 17,633 | 77.1 | |
Democratic | Michael Stephenson | 5,250 | 22.9 | |
Total votes | 22,883 | 100.0 | ||
Republican hold |
Party | Candidate | Votes | % | |
---|---|---|---|---|
Republican | Ben Smaltz (incumbent) | 24,713 | 72.0 | |
Democratic | Martha Lemert | 8,322 | 24.3 | |
Libertarian | Morgan Rigg | 1,271 | 3.7 | |
Total votes | 34,306 | 100.0 | ||
Republican hold |
Party | Candidate | Votes | % | |
---|---|---|---|---|
Republican | Robert Cherry (incumbent) | Unopposed | 100 | |
Total votes | 100.0 | |||
Republican hold |
Party | Candidate | Votes | % | |
---|---|---|---|---|
Republican | Tom Saunders (incumbent) | Unopposed | 100 | |
Total votes | 100.0 | |||
Republican hold |
Party | Candidate | Votes | % | |
---|---|---|---|---|
Republican | Cindy Ziemke (incumbent) | Unopposed | 100 | |
Total votes | 100.0 | |||
Republican hold |
Party | Candidate | Votes | % | |
---|---|---|---|---|
Republican | Brad Barrett (incumbent) | Unopposed | 100 | |
Total votes | 100.0 | |||
Republican hold |
Party | Candidate | Votes | % | |
---|---|---|---|---|
Republican | Sean Eberhart (incumbent) | Unopposed | 100 | |
Total votes | 100.0 | |||
Republican hold |
Republican Charles "Woody" Burton retired after being in office since 1988. His retirement left the seat open in this election. [63]
Party | Candidate | Votes | % | |
---|---|---|---|---|
Republican | Michelle Davis | 22,282 | 67.6 | |
Democratic | Cindy Reinert | 10,664 | 32.4 | |
Total votes | 32,946 | 100.0 | ||
Republican hold |
Party | Candidate | Votes | % | |
---|---|---|---|---|
Republican | Ryan Lauer (incumbent) | 17,729 | 59.9 | |
Democratic | Dale Nowlin | 11,873 | 40.1 | |
Total votes | 29,602 | 100.0 | ||
Republican hold |
Party | Candidate | Votes | % | |
---|---|---|---|---|
Republican | Peggy Mayfield (incumbent) | 21,712 | 63.5 | |
Democratic | Tiffany Grant | 12,484 | 36.5 | |
Total votes | 34,196 | 100.0 | ||
Republican hold |
Party | Candidate | Votes | % | |
---|---|---|---|---|
Democratic | Matt Pierce (incumbent) (incumbent) | Unopposed | 100 | |
Total votes | 100.0 | |||
Democratic hold |
Party | Candidate | Votes | % | |
---|---|---|---|---|
Republican | Jeff Ellington (incumbent) | 19,036 | 60.4 | |
Democratic | Alyssa Bailey | 12,468 | 39.6 | |
Total votes | 31,504 | 100.0 | ||
Republican hold |
Party | Candidate | Votes | % | |
---|---|---|---|---|
Republican | Shane Lindauer (incumbent) | 21,494 | 73.8 | |
Democratic | Teresa Kendall | 7,626 | 26.2 | |
Total votes | 29,120 | 100.0 | ||
Republican hold |
Party | Candidate | Votes | % | |
---|---|---|---|---|
Republican | Matt Hostettler (incumbent) | 25,191 | 75.9 | |
Democratic | Ian Gamroth | 7,986 | 24.1 | |
Total votes | 33,177 | 100.0 | ||
Republican hold |
Party | Candidate | Votes | % | |
---|---|---|---|---|
Republican | Chris May (incumbent) | 23,721 | 72.9 | |
Democratic | Ian Gamroth | 8,803 | 27.1 | |
Total votes | 32,524 | 100.0 | ||
Republican hold |
Party | Candidate | Votes | % | |
---|---|---|---|---|
Republican | Zach Payne | 16,585 | 55.8 | |
Democratic | Terry Goodin (incumbent) | 13,160 | 44.2 | |
Total votes | 29,745 | 100.0 | ||
Republican gain from Democratic |
Party | Candidate | Votes | % | |
---|---|---|---|---|
Republican | Randy Frye (incumbent) | Unopposed | 100 | |
Total votes | 100.0 | |||
Republican hold |
Party | Candidate | Votes | % | |
---|---|---|---|---|
Republican | Randy Lyness (incumbent) | Unopposed | 100 | |
Total votes | 100.0 | |||
Republican hold |
Party | Candidate | Votes | % | |
---|---|---|---|---|
Republican | Jim Lucas (incumbent) | 18,784 | 67.3 | |
Democratic | Jeffery Prewitt | 4,924 | 17.7 | |
Independent | Katrina Hardwick | 4,186 | 15.0 | |
Total votes | 27,894 | 100.0 | ||
Republican hold |
Party | Candidate | Votes | % | |
---|---|---|---|---|
Republican | Karen Engleman (incumbent) | 25,166 | 70.7 | |
Democratic | Kent Yeager | 10,437 | 29.3 | |
Total votes | 35,603 | 100.0 | ||
Republican hold |
Party | Candidate | Votes | % | |
---|---|---|---|---|
Democratic | Rita Fleming (incumbent) | 19,167 | 77.6 | |
Libertarian | Russell Brooksbank | 5,523 | 22.4 | |
Total votes | 24,690 | 100.0 | ||
Democratic hold |
Party | Candidate | Votes | % | |
---|---|---|---|---|
Republican | Edward Clere (incumbent) | 20,850 | 59.4 | |
Democratic | Erica Lawrence | 14,275 | 40.6 | |
Total votes | 35,125 | 100.0 | ||
Republican hold |
Party | Candidate | Votes | % | |
---|---|---|---|---|
Republican | Steve Davisson (incumbent) | Unopposed | 100 | |
Total votes | 100.0 | |||
Republican hold |
Party | Candidate | Votes | % | |
---|---|---|---|---|
Republican | Stephen Bartels (incumbent) | Unopposed | 100 | |
Total votes | 100.0 | |||
Republican hold |
Republican Ron Bacon did not file for re-election leaving his seat open. [81]
Party | Candidate | Votes | % | |
---|---|---|---|---|
Republican | Cindy Ledbetter | 20,945 | 61.2 | |
Democratic | John Hurley | 13,306 | 38.8 | |
Total votes | 34,251 | 100.0 | ||
Republican hold |
Party | Candidate | Votes | % | |
---|---|---|---|---|
Republican | Wendy McNamara (incumbent) | 18,507 | 64.0 | |
Democratic | Stephen Folz | 10,391 | 36.0 | |
Total votes | 28,898 | 100.0 | ||
Republican hold |
Party | Candidate | Votes | % | |
---|---|---|---|---|
Democratic | Ryan Hatfield (incumbent) | 13,695 | 63.2 | |
Republican | Gregory Peete | 7,975 | 36.8 | |
Total votes | 21,670 | 100.0 | ||
Democratic hold |
Party | Candidate | Votes | % | |
---|---|---|---|---|
Republican | Holli Sullivan (incumbent) | 20,273 | 63.9 | |
Democratic | Tonda Pauley | 11,453 | 36.1 | |
Total votes | 31,726 | 100.0 | ||
Republican hold |
Party | Candidate | Votes | % | |
---|---|---|---|---|
Republican | Matt Lehman (incumbent) | Unopposed | 100 | |
Total votes | 100.0 | |||
Republican hold |
Party | Candidate | Votes | % | |
---|---|---|---|---|
Democratic | Phil GiaQuinta (incumbent) | Unopposed | 100 | |
Total votes | 100.0 | |||
Democratic hold |
Party | Candidate | Votes | % | |
---|---|---|---|---|
Republican | Martin Carbaugh (incumbent) | 13,725 | 52.0 | |
Democratic | Kyle Miller | 12,653 | 48.0 | |
Total votes | 26,378 | 100.0 | ||
Republican hold |
Party | Candidate | Votes | % | |
---|---|---|---|---|
Republican | David Abbott (incumbent) | Unopposed | 100 | |
Total votes | 100.0 | |||
Republican hold |
Party | Candidate | Votes | % | |
---|---|---|---|---|
Republican | Christopher Judy (incumbent) | 24,783 | 64.7 | |
Democratic | Michael Bienz | 11,953 | 31.2 | |
Libertarian | Jason Eicholtz | 1,578 | 4.1 | |
Total votes | 38,314 | 100.0 | ||
Republican hold |
Party | Candidate | Votes | % | |
---|---|---|---|---|
Republican | Bob Morris (incumbent) | 21,482 | 61.1 | |
Democratic | Emma Steele | 13,670 | 38.9 | |
Total votes | 35,152 | 100.0 | ||
Republican hold |
Party | Candidate | Votes | % | |
---|---|---|---|---|
Republican | Dave Heine (incumbent) | 21,238 | 71.8 | |
Democratic | Pablo Hurtado | 8,332 | 28.2 | |
Total votes | 29,570 | 100.0 | ||
Republican hold |
Party | Candidate | Votes | % | |
---|---|---|---|---|
Democratic | Ed DeLaney (incumbent) | 27,901 | 70.0 | |
Republican | Paul Tinkle | 11,930 | 30.0 | |
Total votes | 39,831 | 100.0 | ||
Democratic hold |
Party | Candidate | Votes | % | |
---|---|---|---|---|
Democratic | Carey Hamilton (incumbent) | 22,729 | 62.7 | |
Republican | Ryan Royer | 13,549 | 37.3 | |
Total votes | 36,278 | 100.0 | ||
Democratic hold |
Party | Candidate | Votes | % | |
---|---|---|---|---|
Republican | Chris Jeter (incumbent) | 26,659 | 59.3 | |
Democratic | Pam Dechert | 18,285 | 40.7 | |
Total votes | 44,944 | 100.0 | ||
Republican hold |
Party | Candidate | Votes | % | |
---|---|---|---|---|
Democratic | Mitch Gore | 13,898 | 51.3 | |
Republican | Cynthia Kirchhofer (incumbent) | 13,173 | 48.7 | |
Total votes | 27,071 | 100.0 | ||
Democratic gain from Republican |
Party | Candidate | Votes | % | |
---|---|---|---|---|
Republican | Mike Speedy (incumbent) | 22,311 | 63.9 | |
Democratic | Jordan Nienaber | 12,584 | 36.1 | |
Total votes | 34,895 | 100.0 | ||
Republican hold |
Party | Candidate | Votes | % | |
---|---|---|---|---|
Republican | Robert Behning (incumbent) | 16,113 | 59.5 | |
Democratic | Beverly McDermott-Piazza | 9,300 | 34.3 | |
Libertarian | Crystal Henry | 1,687 | 6.2 | |
Total votes | 27,100 | 100.0 | ||
Republican hold |
Democrat Karlee Macer did not seek re-election. [99]
Party | Candidate | Votes | % | |
---|---|---|---|---|
Democratic | Renee Pack | Unopposed | 100 | |
Total votes | 100.0 | |||
Democratic hold |
Republican incumbent Dollyne Sherman lost in the primaries to John Jacob. [101]
Party | Candidate | Votes | % | |
---|---|---|---|---|
Republican | John Jacob | 18,485 | 61.0 | |
Democratic | Angela Elliott | 11,806 | 39.0 | |
Total votes | 30,291 | 100.0 | ||
Republican hold |
Party | Candidate | Votes | % | |
---|---|---|---|---|
Democratic | Cherrish Pryor | 21,430 | 85.5 | |
Republican | Angela Elliott | 3,629 | 14.5 | |
Total votes | 25,059 | 100.0 | ||
Democratic hold |
Party | Candidate | Votes | % | |
---|---|---|---|---|
Democratic | John Bartlett | Unopposed | 100 | |
Total votes | 100.0 | |||
Democratic hold |
Party | Candidate | Votes | % | |
---|---|---|---|---|
Democratic | Greg Porter | Unopposed | 100 | |
Total votes | 100.0 | |||
Democratic hold |
Party | Candidate | Votes | % | |
---|---|---|---|---|
Democratic | Justin Moed (incumbent) | 9,707 | 55.5 | |
Republican | John Schmitz | 6,962 | 39.8 | |
Libertarian | Mark Renholzberger | 816 | 4.7 | |
Total votes | 17,485 | 100.0 | ||
Democratic hold |
Party | Candidate | Votes | % | |
---|---|---|---|---|
Democratic | Robin Shackleford | Unopposed | 100 | |
Total votes | 100.0 | |||
Democratic hold |
Party | Candidate | Votes | % | |
---|---|---|---|---|
Democratic | Vanessa Summers | Unopposed | 100 | |
Total votes | 100.0 | |||
Democratic hold |
Party | Candidate | Votes | % | |
---|---|---|---|---|
Democratic | Blake Johnson (incumbent) | 16,353 | 67.0 | |
Republican | Wayne Harmon | 8,037 | 33.0 | |
Total votes | 24,390 | 100.0 | ||
Democratic hold |
The 2012 United States House of Representatives elections were held on November 6, 2012. It coincided with the reelection of President Barack Obama. Elections were held for all 435 seats representing the 50 U.S. states and also for the delegates from the District of Columbia and five major U.S. territories. The winners of this election cycle served in the 113th United States Congress. This was the first congressional election using districts drawn up based on the 2010 United States census.
The 2012 United States House of Representatives elections in Indiana were held on Tuesday, November 6, 2012, to elect the nine U.S. representatives from the state, one from each of the state's nine congressional districts. The elections coincided with the elections of other federal and state offices, including a quadrennial presidential election, an election to the U.S. Senate, and a gubernatorial election.
The 2014 United States House of Representatives elections in Alabama took place on November 4, 2014. Voters elected the 7 U.S. representatives from the state of Alabama. The elections coincided with the elections of other offices, including the Governor of Alabama.
The 2018 New York state elections took place on November 6, 2018. On that date, the State of New York held elections for the following offices: Governor and Lieutenant Governor, Attorney General, Comptroller, U.S. Senate, U.S. House of Representatives, New York State Senate, New York state assembly, and various others. Primary elections took place on September 13, 2018. As of May 2018, Democrats had won all 19 elections to statewide offices that have occurred in New York since 2002.
The 2018 United States House of Representatives elections in Nebraska were held on Tuesday, November 6, 2018, to elect the three U.S. representatives from the U.S. state of Nebraska; one from each of the state's three congressional districts. Primaries were held on May 15, 2018. The elections and primaries coincided with the elections and primaries of other federal and state offices.
A general election was held in the U.S. state of Nebraska on November 6, 2018. All of Nebraska's executive officers were up for election as well as a United States Senate seat, and all of Nebraska's three seats in the United States House of Representatives.
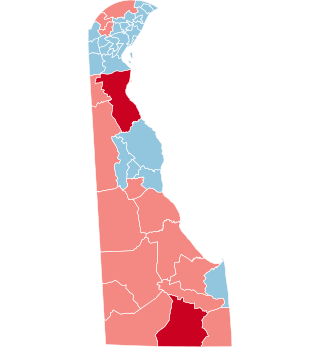
An election was held on November 4, 2014, to elect all 41 members to Delaware's House of Representatives. The election coincided with the elections for other offices, including U.S. Senate, U.S. House of Representatives, and state senate. The primary election was held on September 9, 2014. Democrats retained control of the House despite losing two seats, winning 25 seats compared to 16 seats for the Republicans.
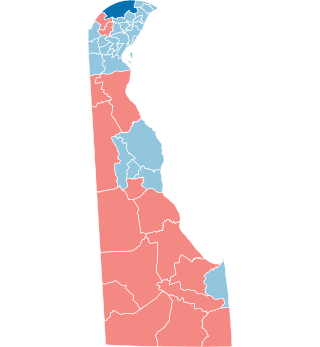
An election was held on November 6, 2018, to elect all 41 members to Delaware's House of Representatives. The election coincided with the elections for other offices, including for the U.S. Senate, U.S. House of Representatives, Attorney General, State Treasurer, and state senate. The primary election was held on September 6, 2018. Democrats consolidated their majority in the House by gaining one seat, winning 26 seats compared to 15 seats for the Republicans.
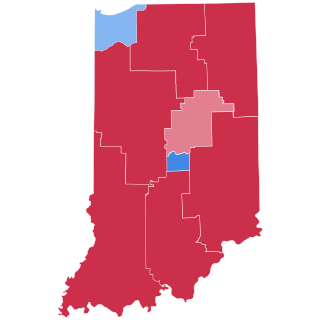
The 2020 United States House of Representatives elections in Indiana were held on November 3, 2020, to elect the nine U.S. representatives from the state of Indiana, one from each of the state's nine congressional districts. The elections coincided with the 2020 U.S. presidential election, as well as other elections to the House of Representatives, elections to the United States Senate and various state and local elections.
General elections were held in the U.S. state of Washington on November 3, 2020. A primary was held on August 4. This election cycle is notable as it was only the second in state history in which Democrats won the top three statewide elections by double digits. The first was the 1936 election, in the middle of the Great Depression.
Elections were held in Illinois on Tuesday, November 6, 1990. The primary elections were held on March 20, 1990.
The 2012 Iowa State Senate elections took place as part of the biennial 2012 United States elections. Iowa voters elected state senators in 26 of the state senate's 50 districts—the 25 even-numbered state senate districts and the 49th district. State senators serve four-year terms in the Iowa State Senate, with half of the seats up for election each cycle. This was the first election cycle following the 2010 census and 2011 redistricting process.
An election was held on November 3, 2020, to elect all 110 members of Michigan's House of Representatives.
An election was held on November 3, 2020 to elect 25 members to Montana's Senate. The election coincided with elections for other offices, including the presidency, U.S Senate, U.S. House of Representatives, governorship, and state house. The primary election was held on June 2, 2020
The 2020 United States attorney general elections were held on November 3, 2020, in 10 states. The previous attorney general elections for this group of states took place in 2016, except in Vermont where attorneys general only serve two-year terms and elected their current attorney general in 2018. Nine state attorneys general ran for reelection and eight won, while Republican Tim Fox of Montana could not run again due to term limits and Republican Curtis Hill of Indiana was eliminated in the Republican convention.
The 2016 United States attorney general elections were held on November 8, 2016, in 10 states. The previous attorney general elections for eight of the 10 states took place in 2012. The last attorney general elections for Utah and Vermont took place in 2014, as Utah held a special election due to the resignation of John Swallow, while the attorney general of Vermont serves two-year terms. The elections took place concurrently with the 2016 presidential election, elections to the House of Representatives and Senate, and numerous state and local elections.
The 2022 elections for the Indiana House of Representatives took place on Tuesday November 8, 2022, to elect representatives from all 100 districts in the Indiana House of Representatives. The primary election took place on Tuesday May 3, 2022. The Republican Party had held a House majority since 2011.
All 62 members of the Wyoming House of Representatives were elected on November 8, 2022, as part of the 2022 Wyoming elections. Primary elections were held on August 16. Republicans expanded their supermajority, gaining six seats.
The 2022 Delaware House of Representatives elections took place on November 8, 2022, as part of the 2022 United States elections. The election coincided with elections for other offices, including for U.S. House, Attorney General, and state senate. Delaware voters elected state senators in all 41 of the state's Senate districts. 41 State Representatives serve four-year terms in the Delaware House of Representatives.
The 2022 South Carolina House of Representatives election took place on November 8, 2022, as part of the biennial United States elections. South Carolina voters elected state representatives in all 124 of the state's house districts. Republicans flipped eight seats held by Democrats, while Democrats flipped one seat held by a Republican; with their majority expanded by a net gain of seven seats, Republicans achieved a supermajority in the chamber.