2012 United States presidential election in Ohio

Last updated

2012 United States presidential election in Ohio
Flag of Ohio.svg
  2008 November 6, 2012 2016  
Turnout70.54% [1]
  President Barack Obama, 2012 portrait crop.jpg Mitt Romney by Gage Skidmore 6 cropped.jpg
Nominee Barack Obama Mitt Romney
Party Democratic Republican
Home state Illinois Massachusetts
Running mate Joe Biden Paul Ryan
Electoral vote180
Popular vote2,827,7092,661,437
Percentage50.58%47.60%

Ohio Presidential Election Results 2012.svg
County Results

President before election

Barack Obama
Democratic

Elected President

Barack Obama
Democratic

The 2012 United States presidential election in Ohio took place on November 6, 2012, as part of the 2012 United States presidential election in which all 50 states plus the District of Columbia participated. Ohio voters chose 18 electors to represent them in the Electoral College via a popular vote pitting incumbent Democratic President Barack Obama and his running mate, Vice President Joe Biden, against Republican challenger and former Massachusetts Governor Mitt Romney and his running mate, Congressman Paul Ryan. This election continued Ohio's bellwether streak, as the state voted for the winner of the presidency in every election from 1964 to 2016.

Contents

President Obama won the popular vote in Ohio with 50.58% of the vote over Mitt Romney in second place at 47.60%, a Democratic victory margin of 2.98%. [2] Obama's performance was a decline from 2008 when he won the state by a 4.58% margin over U.S. Senator John McCain, and he narrowly lost five counties that he won in 2008. [3] However, he narrowly improved his margins in Cuyahoga County and Franklin County, home to the second largest city, Cleveland, and the state's capital and largest city, Columbus, respectively and greatly improved his losing margin in Ross County home to the state's 1st and 3rd capital Chillicothe, allowing him to carry the state. Obama became the first Democrat to win the White House without Belmont County since Grover Cleveland in 1892, as well as the first to win without neighboring Jefferson County since Woodrow Wilson in 1916 and the first to win without Monroe or Tuscarawas Counties since John F. Kennedy in 1960.

As of the 2020 United States presidential election, this is the last time the Democratic presidential nominee won Ohio, as well as the last time Ashtabula County, Erie County, Ottawa County, Portage County, Sandusky County, Stark County, Trumbull County, and Wood County, have voted Democratic in a presidential election.

Primaries

Democratic primary

The Democratic primary was held on March 6, 2012, the same day as the Republican primary. Incumbent President Barack Obama ran unopposed, and thus won all 151 of the state's delegates.

Republican primary

2012 Ohio Republican presidential primary
Flag of Ohio.svg
  2008 March 6, 2012 (2012-03-06) 2016  
  Mitt Romney by Gage Skidmore 6 cropped.jpg Rick Santorum by Gage Skidmore.jpg
Candidate Mitt Romney Rick Santorum
Home state Massachusetts Pennsylvania
Delegate count3825
Popular vote456,513446,255
Percentage37.9%37.1%

  Newt Gingrich by Gage Skidmore 3 (cropped).jpg Ron Paul by Gage Skidmore 3 (crop 2).jpg
Candidate Newt Gingrich Ron Paul
Home state Georgia Texas
Delegate count00
Popular vote175,556111,238
Percentage14.6%9.2%

Ohio Republican Presidential Primary Election Results by County, 2012.svg
Ohio results by county
  Mitt Romney
  Rick Santorum

The 2012 Ohio Republican presidential primary took place on March 6, 2012. [4]

Ohio has 66 delegates to the Republican National Convention. Three party officials (also known as "superdelegates") are not bound by the primary result. Forty-eight delegates are generally awarded winner-take-all by Congressional district. Another 15 delegates are awarded to the candidate who gets an outright majority statewide, or are allocated proportionately among candidates winning at least 20% of the vote if no candidate wins a majority. [5]

2012 Ohio Republican presidential primary [6]
CandidateVotesPercentageEstimated national delegates
Mitt Romney 460,83137.9%38
Rick Santorum 448,58037.1%25
Newt Gingrich 177,18314.6%0
Ron Paul 113,2569.3%0
Rick Perry 7,5390.6%0
Jon Huntsman, Jr. 6,4900.5%0
Unprojected delegates7
Totals1,213,879100.0%66

Despite an early lead in the vote count and having won most counties, Santorum's lead was reduced and overcome by Romney as Hamilton and Cuyahoga County results came in. [7] Romney also won areas such as Akron, Youngstown, Dayton and Columbus. These and other highly populated counties would eventually go to Obama in November.

Key:Withdrew
prior to contest

Notes:

1. In the six congressional districts where Rick Santorum submitted only a partial slate of district delegates and district alternates by the late December 2011 deadline, he will be automatically awarded only the number of delegates he submitted, assuming he wins the particular district. The Ohio Republican Party said on March 2, 2012, that the remaining delegates in such districts will be "considered unbound" until a panel composed of three members of the Ohio GOP's central committee decides which campaign (if any) is permitted to appoint such delegates. [8]

2. In three congressional districts (OH-6, OH-9 and OH-13), Rick Santorum did not make the district-specific portion of the ballot.

3. In every district, each of the 6 candidates listed above appears on the "at-large" portion of the ballot. The results of the at-large ballot will determine the allocation of fifteen national convention delegates.

General election

Campaign

Ohio was considered a key battleground state throughout the general election campaign, and both Barack Obama and Mitt Romney campaigned extensively in the state. [9]

Results

2012 United States presidential election in Ohio [10]
PartyCandidateRunning mateVotesPercentageElectoral votes
Democratic Barack Obama Joe Biden 2,827,70950.58%18
Republican Mitt Romney Paul Ryan 2,661,43747.60%0
Libertarian Gary Johnson Jim Gray 49,4930.89%0
Green Jill Stein Cheri Honkala 18,5730.33%0
Independent Richard DuncanRicky Johnson12,5020.22%0
Constitution Virgil Goode Jim Clymer8,1520.15%0
Socialist Stewart Alexander Alex Mendoza 2,9670.05%0
Others230.00%0
Totals5,590,934100.00%18
Voter turnout (registered voters)70.54%

Results by county

County [11] Barack Obama
Democratic
Mitt Romney
Republican
Gary Johnson [12]
Libertarian
Jill Stein [12]
Green
Various candidates
Other parties
MarginTotal votes cast
#%#%#%#%#%#%
Adams 3,97635.76%6,86561.75%980.87%550.49%1241.11%-2,889-25.99%11,118
Allen 17,91437.06%29,50261.03%4640.96%1640.34%2970.61%-11,588-23.97%48,341
Ashland 8,28134.02%15,51963.76%2210.91%1150.47%2040.84%-7,238-29.74%24,340
Ashtabula 23,80355.10%18,29842.36%4331.00%2240.52%4421.03%5,50512.74%43,200
Athens 18,30766.02%8,54330.81%4341.57%1880.68%2560.92%9,76435.21%27,728
Auglaize 5,83124.87%17,16973.22%2090.89%830.35%1570.67%-11,338-48.35%23,449
Belmont 14,15644.67%16,75852.88%2320.73%1780.56%3641.15%-2,602-8.21%31,688
Brown 7,10736.65%11,91661.45%1910.98%680.35%1100.57%-4,809-24.80%19,392
Butler 62,38836.58%105,17661.68%1,6540.97%4130.24%8990.52%-42,788-25.10%170,530
Carroll 5,54341.73%7,31555.07%1731.30%710.53%1821.37%-1,772-13.34%13,284
Champaign 7,04438.14%11,04559.81%1590.86%660.36%1540.83%-4,001-21.67%18,468
Clark 31,29748.67%31,82049.49%5090.79%2140.33%4610.72%-523-0.82%64,301
Clermont 30,45831.55%64,20866.52%1,0691.11%2480.26%5420.56%-33,750-34.97%96,525
Clinton 5,79131.85%12,00966.05%1951.07%560.31%1320.73%-6,218-34.20%18,183
Columbiana 19,82142.90%25,25154.66%4340.94%2160.47%4771.03%-5,430-11.76%46,199
Coshocton 6,94043.97%8,39053.16%1570.99%960.61%2011.28%-1,450-9.19%15,784
Crawford 7,50737.82%11,85259.72%1860.94%1080.54%1940.98%-4,345-21.90%19,847
Cuyahoga 447,27369.32%190,66029.55%3,4480.53%1,5640.24%2,3170.36%256,61339.77%645,262
Darke 6,82626.84%18,10871.21%2120.83%860.34%1980.78%-11,282-44.37%25,430
Defiance 7,73242.16%10,17655.49%1871.02%640.35%1800.99%-2,444-13.33%18,339
Delaware 37,29237.71%60,19460.86%8510.86%2050.21%3570.36%-22,902-23.15%98,899
Erie 21,79355.17%16,95242.92%3000.76%1580.40%2970.75%4,84112.25%39,500
Fairfield 29,89041.39%41,03456.82%6240.86%2100.29%4620.64%-11,144-15.43%72,220
Fayette 4,24938.49%6,62059.97%870.79%180.16%640.58%-2,371-21.48%11,038
Franklin 346,37360.53%215,99737.75%5,5350.97%1,6590.29%2,6240.46%130,37622.78%572,188
Fulton 9,07342.58%11,73855.08%2481.16%820.38%1690.80%-2,665-12.50%21,310
Gallia 4,55736.10%7,75061.40%790.63%690.55%1671.32%-3,193-25.30%12,622
Geauga 19,65938.46%30,58959.85%3860.76%1820.36%2970.58%-10,930-21.39%51,113
Greene 32,25638.57%49,81959.57%9331.12%2450.29%3730.45%-17,563-21.00%83,626
Guernsey 7,45044.22%8,99353.37%1741.03%700.42%1620.96%-1,543-9.15%16,849
Hamilton 219,92752.50%193,32646.15%3,7560.90%1,0120.24%8730.21%26,6016.35%418,894
Hancock 12,56435.11%22,44362.72%3520.98%1300.36%2940.82%-9,879-27.61%35,783
Hardin 4,61937.04%7,48960.06%1721.38%680.55%1220.98%-2,870-23.02%12,470
Harrison 2,95041.24%4,01956.19%620.87%470.66%751.05%-1,069-14.95%7,153
Henry 5,65839.69%8,25757.92%1691.19%550.39%1180.83%-2,599-18.23%14,257
Highland 6,05433.86%11,41363.83%1760.98%670.37%1690.95%-5,359-29.97%17,879
Hocking 6,15748.22%6,28549.22%1331.04%570.45%1361.06%-128-1.00%12,768
Holmes 2,60822.55%8,70275.23%930.80%430.37%1211.05%-6,094-52.68%11,567
Huron 11,00644.54%13,06052.85%2601.05%1150.47%2701.10%-2,054-8.31%24,711
Jackson 5,16638.54%7,90458.97%940.70%1010.75%1391.04%-2,738-20.43%13,404
Jefferson 15,38546.37%17,03451.34%2480.75%1570.47%3531.06%-1,649-4.97%33,177
Knox 10,47036.78%17,26660.66%3061.08%1140.40%3071.07%-6,796-23.88%28,463
Lake 57,68048.61%58,74449.50%1,0730.90%4360.37%7320.62%-1,064-0.89%118,665
Lawrence 10,74441.43%14,65156.50%1710.66%930.36%2731.05%-3,907-15.07%25,932
Licking 34,20141.94%45,50355.80%8171.00%3110.38%7180.88%-11,302-13.86%81,550
Logan 7,06233.31%13,63364.31%2141.01%800.38%2100.99%-6,571-31.00%21,199
Lorain 81,46456.87%59,40541.47%1,2750.89%5540.39%5550.39%22,05915.40%143,253
Lucas 136,61664.86%69,94033.21%2,3181.10%6520.31%1,0950.52%66,67631.65%210,621
Madison 6,84538.99%10,34258.91%1670.95%670.38%1360.77%-3,497-19.92%17,557
Mahoning 77,05963.38%42,64135.07%7440.61%3700.30%7700.63%34,41828.31%121,584
Marion 12,50445.61%14,26552.03%2851.04%1320.48%2320.85%-1,761-6.42%27,418
Medina 38,78542.65%50,41855.45%8380.92%3260.36%5640.62%-11,633-12.80%90,931
Meigs 4,02739.41%5,89557.69%1111.09%700.69%1151.13%-1,868-18.28%10,218
Mercer 4,74521.89%16,56176.40%1420.66%830.38%1450.67%-11,816-54.51%21,676
Miami 16,38331.50%34,60666.53%5541.07%1440.28%3270.63%-18,223-35.03%52,014
Monroe 3,03544.75%3,54852.31%480.71%470.69%1041.54%-513-7.56%6,782
Montgomery 137,13951.42%124,84146.81%2,5480.96%7750.29%1,4040.53%12,2984.61%266,707
Morgan 2,81445.86%3,17951.81%420.68%270.44%741.21%-365-5.95%6,136
Morrow 5,93336.59%9,86560.83%1741.07%790.49%1661.02%-3,932-24.24%16,217
Muskingum 17,00245.73%19,26451.81%3520.95%1850.50%3761.00%-2,262-6.08%37,179
Noble 2,13136.17%3,56360.48%621.05%440.75%911.54%-1,432-24.31%5,891
Ottawa 11,50351.11%10,53846.83%2200.98%970.43%1470.65%9654.28%22,505
Paulding 3,53838.67%5,35458.51%1011.10%480.52%1091.19%-1,816-19.84%9,150
Perry 7,03346.82%7,62750.78%1200.80%760.51%1641.10%-594-3.96%15,020
Pickaway 9,68440.09%14,03758.11%2060.85%740.31%1530.63%-4,353-18.02%24,154
Pike 5,68449.02%5,68549.03%770.66%440.38%1060.91%-1-0.01%11,596
Portage 39,45351.65%35,24246.14%8441.10%3160.41%5290.70%4,2115.51%76,384
Preble 6,21130.71%13,53566.92%2301.14%820.41%1670.83%-7,324-36.21%20,225
Putnam 4,31823.47%13,72174.57%1600.87%710.39%1300.71%-9,403-51.10%18,400
Richland 22,68739.25%33,86758.59%5030.87%2450.42%5040.87%-11,180-19.34%57,806
Ross 14,56948.31%15,00849.76%2230.74%1050.35%2550.85%-439-1.45%30,160
Sandusky 14,54149.98%13,75547.28%3241.11%1620.56%3131.07%7862.70%29,095
Scioto 15,07748.23%15,49249.56%2110.67%1540.49%3281.04%-415-1.33%31,262
Seneca 11,35344.80%13,24352.26%3161.25%1360.54%2951.17%-1,890-7.46%25,343
Shelby 6,34326.54%17,14271.71%1780.74%750.31%1650.69%-10,799-45.17%23,903
Stark 89,43249.21%88,58148.74%1,5880.87%7320.40%1,4130.78%8510.47%181,746
Summit 153,04157.03%111,00141.36%2,0590.77%7640.28%1,4930.56%42,04015.67%268,358
Trumbull 61,67260.48%38,27937.54%7390.72%4320.42%8410.83%23,39322.94%101,963
Tuscarawas 18,40744.15%22,24253.35%4351.04%1750.42%4341.03%-3,835-9.20%41,693
Union 8,80534.36%16,28963.57%2801.09%830.32%1660.65%-7,484-29.21%25,623
Van Wert 4,02928.99%9,58568.97%950.68%650.47%1240.89%-5,556-39.98%13,898
Vinton 2,43644.37%2,85652.02%621.13%410.75%951.72%-420-7.65%5,490
Warren 32,90929.60%76,56468.85%1,0110.91%2200.20%4930.44%-43,655-39.25%111,197
Washington 11,65139.36%17,28458.39%2350.79%1340.45%2981.01%-5,633-19.03%29,602
Wayne 19,80838.71%30,25159.12%4510.88%1840.36%4710.93%-10,443-20.41%51,165
Williams 7,26641.04%10,04756.74%1480.84%950.54%1500.84%-2,781-15.70%17,706
Wood 32,80251.21%29,70446.37%9401.47%2790.44%3340.52%3,0984.84%64,059
Wyandot 4,13739.02%6,18058.29%990.93%680.64%1181.11%-2,043-19.27%10,602
Totals2,827,70950.58%2,661,43747.60%49,4930.89%18,5730.33%33,7220.60%166,2722.98%5,590,934
County Flips:
Democratic
Hold
Republican
Hold
Gain from Democratic Ohio County Flips 2012.svg
County Flips:

Counties that flipped from Democratic to Republican

By congressional district

Despite losing the state, Romney won 12 of 16 congressional districts. [13]

DistrictRomneyObamaRepresentative
1st 52.4%46.26% Steve Chabot
2nd 54.75%43.66% Brad Wenstrup
3rd 28.9%69.65% Joyce Beatty
4th 55.98%42% Jim Jordan
5th 53.88%44.1% Bob Latta
6th 55.2%42.67% Bill Johnson
7th 53.71%44.23% Bob Gibbs
8th 61.9%36.45% John Boehner
9th 30.87%67.55% Marcy Kaptur
10th 50.14%48.23% Mike Turner
11th 16.55%82.74% Marcia Fudge
12th 54.37%43.9% Pat Tiberi
13th 35.42%62.95% Tim Ryan
14th 50.89%47.58% Steve LaTourette
15th 51.86%46.34% Steve Stivers
16th 53.35%45.19% Jim Renacci

Analysis

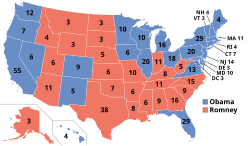
Obama's victory in Ohio was enough to push him over the 270 electoral vote line allowing him to win the election. At first the Romney campaign contested the call, but conceded at about 1:00 A.M. President Obama's victory in the state can be attributed to several factors; he only won 17 out of Ohio's 88 counties. However, those 17 counties combined account for 56.56% of its total population. [14] Romney did do well in most rural areas of the state, particularly in western Ohio. Romney also won all but one county in the Appalachia region, becoming the first Republican since Richard Nixon’s 2,900-plus-county landslide in 1972 to carry Belmont, Jefferson and Monroe Counties, and losing only Athens County, home of Ohio University. He also managed to flip the swing counties of Lake and Tuscarawas. Romney also did well in the northern Columbus suburbs. For Romney, most of his wins came from smaller populated counties. Obama won by comfortable margins in Franklin, Hamilton, and Lucas counties, home to the cities of Columbus, Cincinnati, and Toledo, respectively. Obama's greatest support came from northeast Ohio, centered in Cuyahoga and Summit counties, home to the cities of Cleveland and Akron, respectively, the second and fourth largest cities in the state. The surrounding Cleveland–Akron–Canton metropolitan area and the Lake Erie shore went mostly to Obama, allowing him to carry the state as a whole by a modest 2.98% margin.

In February 2013, nineteen cases of voter fraud were investigated in Hamilton County. [15] Three individuals were charged with voter fraud the following month, with one individual alleged to have voted six times. [16] These incidents would not have affected the outcome of the Ohio race as President Obama ultimately carried the state by 166,272 votes. Some experts believe that the popularity of the auto industry bailout put in place under President Obama helped him take the state. [9] [17]

See also

Related Research Articles

<span class="mw-page-title-main">2012 United States presidential election</span> 57th quadrennial U.S. presidential election

The 2012 United States presidential election was the 57th quadrennial presidential election, held on Tuesday, November 6, 2012. Incumbent Democratic President Barack Obama and his running mate, incumbent Vice President Joe Biden, were re-elected to a second term. They defeated the Republican ticket of former Governor Mitt Romney of Massachusetts and Representative Paul Ryan of Wisconsin.

<span class="mw-page-title-main">2012 United States presidential election in Nevada</span>

The 2012 United States presidential election in Nevada took place on November 6, 2012, as part of the 2012 United States presidential election in which all 50 states plus the District of Columbia participated. State voters chose six electors to represent them in the Electoral College via a popular vote pitting incumbent Democratic President Barack Obama and his running mate, Vice President Joe Biden, against Republican challenger and former Massachusetts Governor Mitt Romney and his running mate, Congressman Paul Ryan.

<span class="mw-page-title-main">2012 United States presidential election in Colorado</span> Election in Colorado

The 2012 United States presidential election in Colorado took place on November 6, 2012, as part of the 2012 United States presidential election in which all 50 states plus the District of Columbia participated. Colorado voters chose nine electors to represent them in the Electoral College via a popular vote pitting incumbent Democratic President Barack Obama and his running mate, Vice President Joe Biden, against Republican challenger and former Massachusetts Governor Mitt Romney and his running mate, Congressman Paul Ryan. Obama and Biden carried Colorado with 51.45% of the popular vote to Romney's and Ryan's 46.09%, thus winning the state's nine electoral votes by a 5.36% margin.

<span class="mw-page-title-main">2012 United States presidential election in Minnesota</span>

The 2012 United States presidential election in Minnesota took place on November 6, 2012, as part of the 2012 United States presidential election in which all 50 states plus the District of Columbia participated. State voters chose ten electors to represent them in the Electoral College via a popular vote pitting incumbent Democratic President Barack Obama and his running mate, Vice President Joe Biden, against Republican challenger and former Massachusetts Governor Mitt Romney and his running mate, Congressman Paul Ryan.

<span class="mw-page-title-main">2012 United States presidential election in Michigan</span> Election in Michigan

The 2012 United States presidential election in Michigan took place on November 6, 2012, as part of the 2012 United States presidential election in which all 50 states plus the District of Columbia participated. Voters chose 16 electors to represent them in the Electoral College via a popular vote pitting incumbent Democratic President Barack Obama and his running mate, Vice President Joe Biden, against Republican challenger and former Massachusetts Governor Mitt Romney and his running mate, Congressman Paul Ryan.

<span class="mw-page-title-main">2012 United States presidential election in Washington (state)</span> Election in Washington

The 2012 United States presidential election in Washington took place on November 6, 2012, as part of the 2012 United States presidential election in which all 50 states plus the District of Columbia participated. Washington voters chose 12 electors to represent them in the Electoral College via a popular vote pitting incumbent Democratic President Barack Obama and his running mate, Vice President Joe Biden, against Republican challenger and former Massachusetts Governor Mitt Romney and his running mate, Congressman Paul Ryan.

<span class="mw-page-title-main">2012 United States presidential election in Georgia</span> Election in Georgia

The 2012 United States presidential election in Georgia took place on November 6, 2012, as part of the 2012 General Election in which all 50 states plus the District of Columbia participated. Georgia voters chose 16 electors to represent them in the Electoral College via a popular vote pitting incumbent Democratic President Barack Obama and his running mate, Vice President Joe Biden, against Republican challenger and former Massachusetts Governor Mitt Romney and his running mate, Congressman Paul Ryan.

<span class="mw-page-title-main">2012 United States presidential election in Kentucky</span> Election in Kentucky

The 2012 United States presidential election in Kentucky took place on November 6, 2012, as part of the 2012 General Election in which all 50 states plus the District of Columbia participated. Kentucky voters chose eight electors to represent them in the Electoral College via a popular vote pitting incumbent Democratic President Barack Obama and his running mate, Vice President Joe Biden, against Republican challenger and former Massachusetts Governor Mitt Romney and his running mate, Congressman Paul Ryan.

<span class="mw-page-title-main">2012 United States presidential election in Missouri</span> Election in Missouri

The 2012 United States presidential election in Missouri took place on November 6, 2012, as part of the 2012 United States presidential election, in which all 50 states plus the District of Columbia participated. Missouri voters chose 10 electors to represent them in the Electoral College via a popular vote pitting incumbent Democratic President Barack Obama and his running mate, Vice President Joe Biden, against Republican challenger and former Massachusetts Governor Mitt Romney and his running mate, Congressman Paul Ryan.

<span class="mw-page-title-main">2012 United States presidential election in Idaho</span> Election in Idaho

The 2012 United States presidential election in Idaho took place on November 6, 2012, as part of the 2012 United States presidential election in which all 50 states plus the District of Columbia participated. Idaho voters chose four electors to represent them in the Electoral College via a popular vote pitting incumbent Democratic President Barack Obama and his running mate, Vice President Joe Biden, against Republican challenger and former Massachusetts Governor Mitt Romney and his running mate, Congressman Paul Ryan. Prior to the election, 17 news organizations considered this a state Romney would win, or otherwise considered as a safe red state. Romney and Ryan carried Idaho with 64.09% of the popular vote to Obama's and Biden's 32.40%, thus winning the state's four electoral votes. Romney's victory in Idaho made it his fourth strongest state in the 2012 election after Utah, Wyoming and Oklahoma. He improved on McCain's performance in 2008, expanding his margin from 25.3% to 31.69% and flipping Teton County which had previously voted for Obama.

<span class="mw-page-title-main">2012 United States presidential election in North Carolina</span>

The 2012 United States presidential election in North Carolina took place on November 6, 2012, as part of the 2012 general election in which all 50 states plus the District of Columbia participated. North Carolina voters chose 15 electors to represent them in the Electoral College via a popular vote pitting incumbent Democratic President Barack Obama and his running mate, Vice President Joe Biden, against Republican challenger and former Massachusetts Governor Mitt Romney and his running mate, Congressman Paul Ryan.

<span class="mw-page-title-main">2012 United States presidential election in Oregon</span> Election in Oregon

The 2012 United States presidential election in Oregon took place on November 6, 2012, as part of the 2012 United States presidential election in which all 50 states plus the District of Columbia participated. Oregon voters chose seven electors to represent them in the Electoral College via a popular vote pitting incumbent Democratic President Barack Obama and his running mate, Vice President Joe Biden, against Republican challenger and former Massachusetts Governor Mitt Romney and his running mate, Representative Paul Ryan.

<span class="mw-page-title-main">2012 United States presidential election in Pennsylvania</span> Selection of Pennsylvanias presidential electors

The 2012 United States presidential election in Pennsylvania took place on November 6, 2012, as part of the 2012 United States presidential election in which all 50 states plus the District of Columbia participated. The primary election to select the Democratic and Republican candidates had been held on April 24, 2012. Pennsylvania voters chose 20 electors to represent them in the Electoral College via a popular vote pitting incumbent Democratic President Barack Obama and his running mate, Vice President Joe Biden, against Republican challenger and former Massachusetts Governor Mitt Romney and his running mate, Congressman Paul Ryan. Pennsylvania's electoral vote number was a reduction from the 2008 delegation, which had 21 electors. This change was due to reapportionment following the 2010 United States Census. Pennsylvania's 20 electoral votes are allotted on a winner-take-all basis.

<span class="mw-page-title-main">2012 United States presidential election in Rhode Island</span> Election in Rhode Island

The 2012 United States presidential election in Rhode Island took place on November 6, 2012, as part of the 2012 United States presidential election in which all 50 states plus the District of Columbia participated. Rhode Island voters chose four electors to represent them in the Electoral College via a popular vote pitting incumbent Democratic President Barack Obama and his running mate, Vice President Joe Biden, against Republican challenger and former Massachusetts Governor Mitt Romney and his running mate, Congressman Paul Ryan.

<span class="mw-page-title-main">2012 United States presidential election in Tennessee</span> Election in Tennessee

The 2012 United States presidential election in Tennessee was held on November 6, 2012, as part of the 2012 United States presidential election in which all 50 states plus the District of Columbia participated. Tennessee voters chose 11 electors to represent them in the Electoral College via a popular vote pitting incumbent Democratic President Barack Obama and his running mate, Vice President Joe Biden, against Republican challenger and former Massachusetts Governor Mitt Romney and his running mate, Congressman Paul Ryan.

<span class="mw-page-title-main">2012 United States presidential election in Virginia</span> Election in Virginia

The 2012 United States presidential election in Virginia took place on November 6, 2012, as part of the presidential election in which all 50 states plus the District of Columbia participated. Virginia voters chose 13 electors to represent them in the Electoral College via a popular vote pitting incumbent Democratic President Barack Obama and his running mate, Vice President Joe Biden, against Republican challenger and former Massachusetts Governor Mitt Romney and his running mate, Congressman Paul Ryan.

<span class="mw-page-title-main">2012 United States presidential election in Kansas</span> Election in Kansas

The 2012 United States presidential election in Kansas took place on November 6, 2012, as part of the 2012 United States presidential election in which all 50 states plus the District of Columbia participated. Kansas voters chose six electors to represent them in the Electoral College via a popular vote pitting incumbent Democratic President Barack Obama and his running mate, Vice President Joe Biden, against Republican challenger and former Massachusetts Governor Mitt Romney and his running mate, Congressman Paul Ryan. Romney and Ryan carried the state with 59.59 percent of the popular vote to Obama's and Biden's 38.00 percent, thus winning the state's six electoral votes.

<span class="mw-page-title-main">2012 United States presidential election in Wisconsin</span>

The 2012 United States presidential election in Wisconsin took place on November 6, 2012, as part of the 2012 United States presidential election in which all 50 states plus the District of Columbia participated. Wisconsin voters chose 10 electors to represent them in the Electoral College via a popular vote pitting incumbent Democratic President Barack Obama and his running mate, Vice President Joe Biden, against Republican challenger and former Massachusetts Governor Mitt Romney and his running mate, Congressman Paul Ryan.

<span class="mw-page-title-main">2012 United States presidential election in Alabama</span> Election in Alabama

The 2012 United States presidential election in Alabama took place on November 6, 2012, as part of the 2012 general election, in which all 50 states plus the District of Columbia participated. Alabama voters chose nine electors to represent them in the Electoral College via a popular vote pitting incumbent Democratic President Barack Obama and his running mate, Vice President Joe Biden, against Republican challenger and former Massachusetts Governor Mitt Romney and his running mate, Congressman Paul Ryan.

<span class="mw-page-title-main">2012 United States presidential election in North Dakota</span> Election in North Dakota

The 2012 United States presidential election in North Dakota took place on November 6, 2012, as part of the 2012 United States presidential election in which all 50 states plus the District of Columbia participated. North Dakota voters chose three electors to represent them in the Electoral College via a popular vote pitting incumbent Democratic President Barack Obama and his running mate, Vice President Joe Biden, against Republican challenger and former Massachusetts Governor Mitt Romney and his running mate, Congressman Paul Ryan.

References

  1. "2012 ELECTIONS RESULTS". Ohio Secretary of State. Retrieved June 25, 2020.
  2. "Ohio Decides 2012 – Candidates for President". Ohio Secretary of State.[ permanent dead link ]
  3. "Ohio - Election Results 2008 - The New York Times". www.nytimes.com. Retrieved September 27, 2020.
  4. "Primary and Caucus Printable Calendar". CNN . Retrieved January 12, 2012.
  5. Nate Silver (March 4, 2012). "Romney Could Win Majority of Super Tuesday Delegates". FiveThirtyEight . Retrieved March 5, 2012.
  6. "Secretary of State results". Archived from the original on July 29, 2012. Retrieved September 21, 2012.
  7. Exclusive Super Tuesday Numbers from Hamilton County, CNN, March 6, 2012, retrieved April 26, 2016
  8. "Ohio delegates". ABC News . Retrieved March 2, 2012.
  9. 1 2 Zeleny, Jeff; Sussman, Dalia (October 31, 2012). "Ohio Working Class May Offer Key to Obama's Re-election". The New York Times.
  10. "2012 Elections Results - Ohio Secretary of State". www.ohiosos.gov. Archived from the original on September 8, 2020. Retrieved September 27, 2020.
  11. "Dave Leip's Atlas of U.S. Presidential Elections" . Retrieved February 20, 2021.
  12. 1 2 "OH US President November 06, 2012". Our Campaigns.
  13. "Daily Kos Elections' statewide election results by congressional and legislative districts". Daily Kos. Retrieved August 11, 2020.
  14. "County Population Totals: 2010-2019". The United States Census Bureau. Retrieved September 27, 2020.
  15. Emily Maxwell (February 6, 2013). "Poll worker accused of voter fraud in Hamilton County speaks out". WCPO. Archived from the original on February 8, 2013. Retrieved February 8, 2013.
    "Possible Ohio voter fraud investigation heats up". San Francisco Chronicle. Associated Press. February 6, 2013. Retrieved February 8, 2013.
  16. Eric Shawn (March 11, 2013). "Cincinnati poll worker charged with voting half dozen times in November". Fox News. Retrieved March 12, 2013.
    "Nun, Poll Worker, Widower Charged With Voter Fraud". WKRC. Sinclair Broadcast Group. March 11, 2013. Archived from the original on October 21, 2013. Retrieved March 12, 2013.
  17. "How Obama Took The Battleground States". NPR.