1940 United States presidential election in Ohio

Last updated

1940 United States presidential election in Ohio
Flag of Ohio.svg
  1936 November 5, 1940 1944  
  FDRoosevelt1938.png WendellWillkie.jpg
Nominee Franklin D. Roosevelt Wendell Willkie
Party Democratic Republican
Home state New York New York
Running mate Henry A. Wallace Charles L. McNary
Electoral vote260
Popular vote1,733,1391,586,773
Percentage52.20%47.80%

Ohio Presidential Election Results 1940.svg
County Results

President before election

Franklin D. Roosevelt
Democratic

Elected President

Franklin D. Roosevelt
Democratic

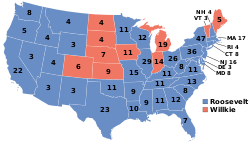
The 1940 United States presidential election in Ohio was held on November 5, 1940, as part of the 1940 United States presidential election. State voters chose 26 electors to the Electoral College, who voted for president and vice president.

Contents

Ohio was won by the Democratic Party candidate, incumbent President Franklin D. Roosevelt, with 52.20% of the popular vote. The Republican Party candidate, Wendell Willkie, garnered 47.80% of the popular vote. [1] This is the only time that Democrats won Ohio in three consecutive elections.

Results

1940 United States presidential election in Ohio
PartyCandidateVotesPercentageElectoral votes
Democratic Franklin D. Roosevelt (incumbent)1,733,13952.20%26
Republican Wendell Willkie 1,586,77347.80%0
Totals3,319,912100.0%26

Results by county

CountyFranklin Delano Roosevelt
Democratic
Wendell Willkie
Republican
MarginTotal votes cast [2]
# %# %# %
Adams 5,00744.76%6,18055.24%-1,173-10.49%11,187
Allen 14,46941.17%20,67558.83%-6,206-17.66%35,144
Ashland 7,83547.60%8,62452.40%-789-4.79%16,459
Ashtabula 14,45443.87%18,49156.13%-4,037-12.25%32,945
Athens 11,44950.52%11,21349.48%2361.04%22,662
Auglaize 5,70438.92%8,95361.08%-3,249-22.17%14,657
Belmont 28,61861.78%17,70538.22%10,91323.56%46,323
Brown 5,64450.75%5,47749.25%1671.50%11,121
Butler 30,82156.86%23,38043.14%7,44113.73%54,201
Carroll 3,58941.02%5,16058.98%-1,571-17.96%8,749
Champaign 5,92943.06%7,84156.94%-1,912-13.89%13,770
Clark 25,88855.59%20,68144.41%5,20711.18%46,569
Clermont 8,94248.84%9,36751.16%-425-2.32%18,309
Clinton 4,96441.40%7,02758.60%-2,063-17.20%11,991
Columbiana 22,34951.29%21,22148.71%1,1282.59%43,570
Coshocton 7,88947.78%8,62352.22%-734-4.45%16,512
Crawford 8,96646.45%10,33653.55%-1,370-7.10%19,302
Cuyahoga 347,11862.41%209,07037.59%138,04824.82%556,188
Darke 9,65146.40%11,14753.60%-1,496-7.19%20,798
Defiance 4,31335.00%8,01065.00%-3,697-30.00%12,323
Delaware 5,66637.19%9,57062.81%-3,904-25.62%15,236
Erie 9,25445.10%11,26754.90%-2,013-9.81%20,521
Fairfield 11,29851.10%10,81348.90%4852.19%22,111
Fayette 5,24946.73%5,98453.27%-735-6.54%11,233
Franklin 96,60151.08%92,53348.92%4,0682.15%189,134
Fulton 2,53022.62%8,65377.38%-6,123-54.75%11,183
Gallia 3,94335.12%7,28564.88%-3,342-29.76%11,228
Geauga 3,31838.19%5,37161.81%-2,053-23.63%8,689
Greene 8,88148.92%9,27351.08%-392-2.16%18,154
Guernsey 8,71046.24%10,12553.76%-1,415-7.51%18,835
Hamilton 148,90749.04%154,73350.96%-5,826-1.92%303,640
Hancock 7,75535.36%14,17464.64%-6,419-29.27%21,929
Hardin 6,54741.60%9,19258.40%-2,645-16.81%15,739
Harrison 4,55944.31%5,72955.69%-1,170-11.37%10,288
Henry 3,50831.07%7,78468.93%-4,276-37.87%11,292
Highland 6,92144.79%8,53055.21%-1,609-10.41%15,451
Hocking 5,68851.60%5,33648.40%3523.19%11,024
Holmes 3,34951.13%3,20148.87%1482.26%6,550
Huron 6,74136.44%11,75863.56%-5,017-27.12%18,499
Jackson 6,38245.80%7,55154.20%-1,169-8.39%13,933
Jefferson 29,51464.03%16,57835.97%12,93628.07%46,092
Knox 7,08140.73%10,30359.27%-3,222-18.53%17,384
Lake 12,40847.96%13,46452.04%-1,056-4.08%25,872
Lawrence 10,66150.92%10,27449.08%3871.85%20,935
Licking 16,37950.14%16,28849.86%910.28%32,667
Logan 6,35139.17%9,86160.83%-3,510-21.65%16,212
Lorain 25,83152.45%23,42247.55%2,4094.89%49,253
Lucas 77,94850.50%76,40549.50%1,5431.00%154,353
Madison 4,39042.65%5,90457.35%-1,514-14.71%10,294
Mahoning 76,44167.09%37,49632.91%38,94534.18%113,937
Marion 10,46246.96%11,81753.04%-1,355-6.08%22,279
Medina 6,72239.92%10,11660.08%-3,394-20.16%16,838
Meigs 4,98340.77%7,23959.23%-2,256-18.46%12,222
Mercer 5,11439.28%7,90560.72%-2,791-21.44%13,019
Miami 11,79944.48%14,72555.52%-2,926-11.03%26,524
Monroe 4,13847.72%4,53452.28%-396-4.57%8,672
Montgomery 86,08459.80%57,86640.20%28,21819.60%143,950
Morgan 2,63734.68%4,96665.32%-2,329-30.63%7,603
Morrow 3,21537.07%5,45762.93%-2,242-25.85%8,672
Muskingum 15,75344.82%19,39555.18%-3,642-10.36%35,148
Noble 3,03738.16%4,92261.84%-1,885-23.68%7,959
Ottawa 5,55644.71%6,87255.29%-1,316-10.59%12,428
Paulding 3,15538.93%4,94961.07%-1,794-22.14%8,104
Perry 6,95344.54%8,65655.46%-1,703-10.91%15,609
Pickaway 6,89553.58%5,97446.42%9217.16%12,869
Pike 4,96261.06%3,16538.94%1,79722.11%8,127
Portage 12,68751.86%11,77748.14%9103.72%24,464
Preble 5,73546.83%6,51153.17%-776-6.34%12,246
Putnam 3,65529.01%8,94670.99%-5,291-41.99%12,601
Richland 18,64552.08%17,15747.92%1,4884.16%35,802
Ross 12,44751.38%11,78048.62%6672.75%24,227
Sandusky 7,11633.61%14,05466.39%-6,938-32.77%21,170
Scioto 21,92652.98%19,46247.02%2,4645.95%41,388
Seneca 7,46431.45%16,27268.55%-8,808-37.11%23,736
Shelby 6,10546.13%7,13053.87%-1,025-7.74%13,235
Stark 59,49656.19%46,38443.81%13,11212.38%105,880
Summit 89,55558.55%63,40541.45%26,15017.10%152,960
Trumbull 34,61558.04%25,02641.96%9,58916.08%59,641
Tuscarawas 19,00456.43%14,67543.57%4,32912.85%33,679
Union 3,94735.36%7,21464.64%-3,267-29.27%11,161
Van Wert 6,25441.95%8,65658.05%-2,402-16.11%14,910
Vinton 2,40442.97%3,19057.03%-786-14.05%5,594
Warren 6,89544.15%8,72255.85%-1,827-11.70%15,617
Washington 8,58438.77%13,55861.23%-4,974-22.46%22,142
Wayne 10,74844.28%13,52555.72%-2,777-11.44%24,273
Williams 4,06530.05%9,46369.95%-5,398-39.90%13,528
Wood 9,71136.36%16,99863.64%-7,287-27.28%26,709
Wyandot 4,20640.14%6,27259.86%-2,066-19.72%10,478
Totals1,733,13952.20%1,586,77347.80%146,3664.41%3,319,912

Counties that flipped from Democratic to Republican

See also

References

  1. Dave Leip’s U.S. Election Atlas; 1940 Presidential General Election Results – Ohio
  2. Scammon, Richard M. (compiler); America at the Polls: A Handbook of Presidential Election Statistics 1920-1964; pp. 348-349 ISBN   0405077114