1940 United States presidential election in North Dakota

Last updated

1940 United States presidential election in North Dakota
Flag of North Dakota.svg
  1936 November 5, 1940 [1] 1944  

All 4 North Dakota votes to the Electoral College
  WendellWillkie.jpg FDRoosevelt1938.png
Nominee Wendell Willkie Franklin D. Roosevelt
Party Republican Democratic
Home state New York New York
Running mate Charles L. McNary Henry A. Wallace
Electoral vote40
Popular vote154,590124,036
Percentage55.06%44.18%

North Dakota Presidential Election Results 1940.svg
County Results

President before election

Franklin D. Roosevelt
Democratic

Elected President

Franklin D. Roosevelt
Democratic

The 1940 United States presidential election in North Dakota took place on November 5, 1940, as part of the 1940 United States presidential election. Voters chose four [2] representatives, or electors, to the Electoral College, who voted for president and vice president.

Contents

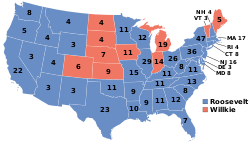
North Dakota was won by Wendell Willkie (RNew York), running with Minority Leader Charles L. McNary, with 55.06% of the popular vote, against incumbent President Franklin D. Roosevelt (DNew York), running with Secretary Henry A. Wallace, with 44.18% of the popular vote. [3] [4]

With 55.06% of the popular vote, North Dakota would prove to be Willkie's fourth strongest state in the 1940 election in terms of popular vote percentage, after fellow free-soil Plains West states South Dakota, Nebraska and Kansas. [5]

This was the first election since North Dakota's inaugural 1892 election in which it voted for a losing candidate. Then, it narrowly voted for Populist candidate James B. Weaver. However, due to a fusion between Weaver and the winning Democrat Grover Cleveland, North Dakota cast a single elector for Cleveland as well. That makes this the first election in which North Dakota did not cast a single electoral vote for the winning candidate, or in which the state backed a losing Republican candidate.

Results

1940 United States presidential election in North Dakota
PartyCandidateVotes%
Republican Wendell Willkie 154,590 55.06%
Democratic Franklin D. Roosevelt (inc.)124,03644.18%
Socialist Norman Thomas 1,2790.46%
Not Designated Alfred Knutson 5450.19%
Prohibition Roger Babson 3250.12%
Total votes280,775 100%

Results by county

County [6] Wendell Lewis Willkie
Republican
Franklin Delano Roosevelt
Democratic
Norman Mattoon Thomas
Socialist
Alfred B. Knutson
Not Designated
Roger Ward Babson
Prohibition
MarginTotal votes cast
#%#%#%#%#%#%
Adams 1,23158.76%83739.95%190.91%40.19%40.19%39418.81%2,095
Barnes 4,64957.67%3,38441.97%210.26%30.04%50.06%1,26515.69%8,062
Benson 2,48545.85%2,89853.47%300.55%20.04%50.09%-413-7.62%5,420
Billings 66362.08%40437.83%10.09%00.00%00.00%25924.25%1,068
Bottineau 3,12955.60%2,46943.87%290.52%10.02%00.00%66011.73%5,628
Bowman 92750.63%88248.17%201.09%20.11%00.00%452.46%1,831
Burke 1,95157.53%1,34239.58%802.36%70.21%110.32%60917.96%3,391
Burleigh 5,85857.06%4,35042.37%290.28%220.21%70.07%1,50814.69%10,266
Cass 12,56751.11%11,91148.45%740.30%170.07%170.07%6562.67%24,586
Cavalier 2,84550.64%2,75749.07%100.18%20.04%40.07%881.57%5,618
Dickey 2,77757.44%1,72135.59%130.27%3146.49%100.21%1,05621.84%4,835
Divide 1,43744.32%1,77154.63%290.89%10.03%40.12%-334-10.30%3,242
Dunn 2,13260.29%1,39239.37%60.17%10.03%50.14%74020.93%3,536
Eddy 1,31948.42%1,36850.22%371.36%00.00%00.00%-49-1.80%2,724
Emmons 3,51577.29%1,00422.08%210.46%10.02%70.15%2,51155.21%4,548
Foster 1,10943.20%1,44656.33%80.31%40.16%00.00%-337-13.13%2,567
Golden Valley 87355.57%68943.86%30.19%60.38%00.00%18411.71%1,571
Grand Forks 7,04345.42%8,39654.15%460.30%120.08%90.06%-1,353-8.73%15,506
Grant 2,81581.52%62718.16%110.32%00.00%00.00%2,18863.37%3,453
Griggs 1,11743.09%1,46456.48%80.31%30.12%00.00%-347-13.39%2,592
Hettinger 2,46878.32%67121.29%80.25%40.13%00.00%1,79757.03%3,151
Kidder 2,21472.31%83727.34%20.07%10.03%80.26%1,37744.97%3,062
LaMoure 2,94363.70%1,63735.43%260.56%60.13%80.17%1,30628.27%4,620
Logan 2,57283.59%49816.18%50.16%20.06%00.00%2,07467.40%3,077
McHenry 3,89463.07%2,22536.04%280.45%210.34%60.10%1,66927.03%6,174
McIntosh 3,49491.66%3188.34%00.00%00.00%00.00%3,17683.32%3,812
McKenzie 1,56338.63%2,44060.31%210.52%80.20%140.35%-877-21.68%4,046
McLean 4,11358.99%2,66638.24%1672.40%130.19%130.19%1,44720.75%6,972
Mercer 3,34185.36%56714.49%50.13%10.03%00.00%2,77470.87%3,914
Morton 5,49965.25%2,88934.28%220.26%60.07%120.14%2,61030.97%8,428
Mountrail 1,98144.67%2,39253.93%390.88%120.27%110.25%-411-9.27%4,435
Nelson 1,85943.07%2,43556.42%110.25%60.14%50.12%-576-13.35%4,316
Oliver 1,35683.55%26616.39%10.06%00.00%00.00%1,09067.16%1,623
Pembina 2,92443.94%3,71155.76%110.17%10.02%80.12%-787-11.83%6,655
Pierce 2,34961.64%1,45138.07%50.13%20.05%40.10%89823.56%3,811
Ramsey 3,62950.44%3,53049.07%250.35%60.08%40.06%991.38%7,194
Ransom 2,57956.20%1,98643.28%190.41%30.07%20.04%59312.92%4,589
Renville 1,20247.03%1,29850.78%481.88%80.31%00.00%-96-3.76%2,556
Richland 5,10258.42%3,58441.04%320.37%60.07%100.11%1,51817.38%8,734
Rolette 1,55535.41%2,82064.21%100.23%30.07%40.09%-1,265-28.80%4,392
Sargent 1,92250.01%1,89449.28%210.55%10.03%50.13%280.73%3,843
Sheridan 2,40581.33%54318.36%20.07%70.24%00.00%1,86262.97%2,957
Sioux 1,16766.84%57833.10%10.06%00.00%00.00%58933.73%1,746
Slope 80157.58%58542.06%40.29%10.07%00.00%21615.53%1,391
Stark 4,36767.63%2,07532.14%70.11%20.03%60.09%2,29235.50%6,457
Steele 1,32847.70%1,43451.51%170.61%30.11%20.07%-106-3.81%2,784
Stutsman 5,63458.92%3,89740.76%190.20%30.03%90.09%1,73718.17%9,562
Towner 1,63050.29%1,59649.24%100.31%20.06%30.09%341.05%3,241
Traill 2,88253.47%2,47645.94%150.28%80.15%90.17%4067.53%5,390
Walsh 3,05135.61%5,49964.18%40.05%10.01%130.15%-2,448-28.57%8,568
Ward 6,51945.61%7,66953.66%670.47%130.09%250.17%-1,150-8.05%14,293
Wells 3,33563.74%1,87835.89%130.25%10.02%50.10%1,45727.85%5,232
Williams 2,47034.25%4,57963.50%1211.68%310.43%100.14%-2,109-29.25%7,211
Total154,59055.06%124,03644.18%1,2790.46%5450.19%3250.12%30,55410.88%280,775

Counties that flipped from Democratic to Republican

See also

References

  1. "United States Presidential election of 1940 – Encyclopædia Britannica" . Retrieved August 19, 2018.
  2. "1940 Election for the Thirty-ninth Term (1941-45)" . Retrieved August 19, 2018.
  3. "1940 Presidential General Election Results – North Dakota" . Retrieved August 19, 2018.
  4. "The American Presidency Project – Election of 1940" . Retrieved August 19, 2018.
  5. "1940 Presidential Election Statistics". Dave Leip’s Atlas of U.S. Presidential Elections. Retrieved March 5, 2018.
  6. "ND US President Race, November 05, 1940". Our Campaigns.