The Dakota Territory legislature created the county on January 4, 1873, with territory partitioned from Buffalo County. It was not organized at that date, and was not attached to another county for judicial or administrative purposes. It was named for Joseph Rolette Jr., a fur trader and political figure from Pembina. The county government was effected on October 14, 1884, with Dunseith as the county seat. In 1885 the county seat was assigned to Saint John, and in 1889 it was assigned to Rolla.
The county boundaries were adjusted in 1883 and in 1887. It has retained its present boundary configuration since 1887.[4][5]
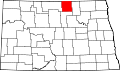
Rolette County lies on the northern border of North Dakota with Canada. Gimby Creek and Wakopa Creek flow into the county from Canada. The terrain consists of dry rolling hills in the south, and more verdant low hills in the north and northwest, dotted with lakes and ponds.[6]
Part of the Turtle Mountain plateau lies in the northwestern part of the county. The terrain slopes to the south and east; its highest point is its northwest corner, at 2,195ft (669m) ASL.[7]
According to the United States Census Bureau, the county has a total area of 939.499 square miles (2,433.29km2), of which 903.042 square miles (2,338.87km2) is land and 36.457 square miles (94.42km2) (3.88%) is water.[8] It is the 44th largest county in North Dakota by total area.[9]
U.S. Decennial Census[11] 1790–1960[12] 1900–1990[13] 1990–2000[14] 2010–2020[2]
As of the fourth quarter of 2024, the median home value in Rolette County was $98,539.[15]
As of the 2023 American Community Survey, there are 3,686 estimated households in Rolette County with an average of 3.23 persons per household. The county has a median household income of $57,355. Approximately 23.5% of the county's population lives at or below the poverty line. Rolette County has an estimated 53.1% employment rate, with 16.6% of the population holding a bachelor's degree or higher and 83.9% holding a high school diploma.[2]
The top five reported ancestries (people were allowed to report up to two ancestries, thus the figures will generally add to more than 100%) were English (93.0%), Spanish (0.9%), Indo-European (0.9%), Asian and Pacific Islander (0.6%), and Other (4.5%).
Rolette County, North Dakota – racial and ethnic composition Note: the US Census treats Hispanic/Latino as an ethnic category. This table excludes Latinos from the racial categories and assigns them to a separate category. Hispanics/Latinos may be of any race.
As of the 2024 estimate, there were 11,692 people and 3,686 households residing in the county. There were 4,596 housing units at an average density of 5.09 per square mile (2.0/km2). The racial makeup of the county was 18.5% White (18.2% NH White), 0.5% African American, 77.4% Native American, 0.3% Asian, 0.0% Pacific Islander, _% from some other races and 3.2% from two or more races. Hispanic or Latino people of any race were 1.3% of the population.[21]
2020 census
As of the 2020 census, there were 12,187 people, 4,114 households, and 2,857 families residing in the county.[22] The population density was 13.5 inhabitants per square mile (5.2/km2). There were 4,581 housing units at an average density of 5.07 per square mile (2.0/km2).
Of the residents, 33.0% were under the age of 18 and 14.2% were 65 years of age or older; the median age was 33.4 years. For every 100 females there were 99.7 males, and for every 100 females age 18 and over there were 94.6 males.[23]
There were 4,114 households in the county, of which 40.9% had children under the age of 18 living with them and 31.2% had a female householder with no spouse or partner present. About 24.5% of all households were made up of individuals and 10.0% had someone living alone who was 65 years of age or older.[23]
There were 4,581 housing units, of which 10.2% were vacant. Among occupied housing units, 68.4% were owner-occupied and 31.6% were renter-occupied. The homeowner vacancy rate was 1.3% and the rental vacancy rate was 10.2%.[23]
As of the 2010 census, there were 13,937 people, 4,783 households, and 3,413 families residing in the county. The population density was 15.4 inhabitants per square mile (5.9/km2). There were 5,372 housing units at an average density of 5.95 per square mile (2.3/km2). The racial makeup of the county was 20.27% White, 0.15% African American, 77.23%Native American, 0.11% Asian, 0.01% Pacific Islander, 0.11% from some other races and 2.12% from two or more races. Hispanic or Latino people of any race were 0.95% of the population.
There were 4,783 households, 44.9% had children under the age of 18 living with them, 39.1% were married couples living together, 23.2% had a female householder with no husband present, 28.6% were non-families, and 25.0% of all households were made up of individuals. The average household size was 2.89 and the average family size was 3.39. The median age was 30.5 years.
The median income for a household in the county was $28,265 and the median income for a family was $35,523. Males had a median income of $35,595 versus $27,459 for females. The per capita income for the county was $13,632. About 25.9% of families and 31.8% of the population were below the poverty line, including 41.5% of those under age 18 and 24.8% of those age 65 or over.
Due to its Native American majority population, Rolette County voters are historically Democratic, and it is one of the most consistently Democratic counties in North Dakota. Since 1928 the only Republican to carry the county was Dwight D. Eisenhower in 1952.[26] It was the only county in the state to support George McGovern in 1972 and is additionally the only North Dakota county to have supported Jimmy Carter in 1980.[27] In each of the five presidential elections from 1996 to 2012, the Democratic candidate received over 60% of the vote, with Barack Obama winning 75.1% in 2008 and 74.0% in 2012.[28][29] In 2016, Democratic candidate Hillary Clinton received 55.9% of the county's votes,[30] one of the two North Dakota counties that she carried.
United States presidential election results for Rolette County, North Dakota[31][32]
This page is based on this Wikipedia article Text is available under the CC BY-SA 4.0 license; additional terms may apply. Images, videos and audio are available under their respective licenses.