In the general election held November 8, 1910, the voters of Billings County chose to separate the western portion of Billings and form a new county. This result was immediately challenged in court; on September 19, 1912, the ND Supreme Court upheld the election result; therefore the legislature completed the county's organization on November 13, 1912.[4][5]
Golden Valley was called 'Rattlesnake Flats' by early settlers, due to the large number of the snakes found in the area. The region was dubbed Golden Valley in 1902 after a group of land surveyors noticed that the sunlight gave the surrounding grasses a distinct golden color.[6]
Election controversy
The vote in 1910 to create Golden Valley County was 837 for and 756 against. Shortly after the vote was certified, suit was filed against the Billings County Commission to overturn the result. The plaintiffs alleged that the certification of election was improper, and that certain pre-marked "unofficial" ballots printed by supporters of the new county were cast in place of official ballots, and should be voided. The trial court originally ruled in favor of the plaintiffs. The county appealed to the North Dakota Supreme Court, which upheld the county's certification of the election. The court also ruled the pre-marked ballots were invalid, but that the number of invalid votes was not sufficient to overturn the election results.[7] The court's decision upholding the new county was made on September 19, 1912, and Golden Valley was formally organized on November 13, 1912.
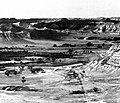
Outline map of Golden Valley County, North Dakota, 1919
Geography
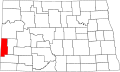
Golden Valley County lies on the west line of North Dakota. Its west boundary line abuts the east boundary line of the state of Montana. Beaver Creek flows east-northeastward through the upper portion of the county, and Little Missouri River flows northeastward through the southeastern corner of the county, with gullies flowing southeastward draining the lower county into the Little Mo River. The county terrain consists of semi-arid hills, dedicated to agriculture in the level areas.[8] The terrain slopes to the east and north, with its highest point on hills at the southwestern corner at 3,251ft (991m) ASL.[9]
According to the United States Census Bureau, the county has a total area of 1,002.487 square miles (2,596.43km2), of which 1,000.885 square miles (2,592.28km2) is land and 1.602 square miles (4.15km2) (0.16%) is water.[10] It is the 38th largest county in North Dakota by total area.[11]
U.S. Decennial Census[13] 1790–1960[14] 1900–1990[15] 1990–2000[16] 2010–2020[2]
As of the fourth quarter of 2024, the median home value in Golden Valley County was $126,299.[17]
As of the 2023 American Community Survey, there are 663 estimated households in Golden Valley County with an average of 2.48 persons per household. The county has a median household income of $76,528. Approximately 11.7% of the county's population lives at or below the poverty line. Golden Valley County has an estimated 59.3% employment rate, with 18.0% of the population holding a bachelor's degree or higher and 96.6% holding a high school diploma.[2]
The top five reported ancestries (people were allowed to report up to two ancestries, thus the figures will generally add to more than 100%) were English (98.7%), Spanish (0.5%), Indo-European (0.2%), Asian and Pacific Islander (0.6%), and Other (0.0%).
Golden Valley County, North Dakota – racial and ethnic composition Note: the US Census treats Hispanic/Latino as an ethnic category. This table excludes Latinos from the racial categories and assigns them to a separate category. Hispanics/Latinos may be of any race.
As of the 2024 estimate, there were 1,795 people and 663 households residing in the county. There were 911 housing units at an average density of 0.91 per square mile (0.4/km2). The racial makeup of the county was 95.4% White (91.5% NH White), 0.9% African American, 1.3% Native American, 0.2% Asian, 0.1% Pacific Islander, _% from some other races and 2.2% from two or more races. Hispanic or Latino people of any race were 4.5% of the population.[23]
2020 census
As of the 2020 census, there were 1,736 people, 721 households, and 445 families residing in the county.[24] The population density was 1.73 inhabitants per square mile (0.7/km2). There were 899 housing units at an average density of 0.90 per square mile (0.3/km2).
Of the residents, 26.6% were under the age of 18 and 22.8% were 65 years of age or older; the median age was 42.1 years. For every 100 females there were 106.7 males, and for every 100 females age 18 and over there were 104.2 males.[25]
There were 721 households, of which 26.5% had children under the age of 18 living with them and 21.5% had a female householder with no spouse or partner present. About 34.8% of all households were made up of individuals and 16.9% had someone living alone who was 65 years of age or older.[25]
Of those 899 housing units, 19.8% were vacant. Among occupied housing units, 78.4% were owner-occupied and 21.6% were renter-occupied. The homeowner vacancy rate was 4.7% and the rental vacancy rate was 26.1%.[25]
2010 census
As of the 2010 census, there were 1,680 people, 774 households, and 429 families residing in the county. The population density was 1.68 inhabitants per square mile (0.6/km2). There were 967 housing units at an average density of 0.97 per square mile (0.4/km2). The racial makeup of the county was 97.44% White, 0.60% African American, 0.60% Native American, 0.06% Asian, 0.06% Pacific Islander, 0.48% from some other races and 0.77% from two or more races. Hispanic or Latino people of any race were 2.08% of the population.
There were 774 households, 22.7% had children under the age of 18 living with them, 48.4% were married couples living together, 4.3% had a female householder with no husband present, 44.6% were non-families, and 39.4% of all households were made up of individuals. The average household size was 2.10 and the average family size was 2.85. The median age was 45.9 years.
The median income for a household in the county was $33,333 and the median income for a family was $47,500. Males had a median income of $32,875 versus $26,750 for females. The per capita income for the county was $21,899. About 8.9% of families and 13.0% of the population were below the poverty line, including 17.7% of those under age 18 and 11.4% of those age 65 or over.
Golden Valley County voters have been reliably Republican for decades. In no national election since 1936 has the county selected the Democratic Party candidate (as of 2024).
United States presidential election results for Golden Valley County, North Dakota[27]
↑"County History". www.nd.gov. State of North Dakota. Retrieved July 10, 2025.
12North Dakota Historical Records Survey (1941). Inventory of the County Archives of North Dakota. Vol.17, Golden Valley County. Bismarck ND: North Dakota Historical Records Survey. Retrieved via Ancestry.com.
↑Pederson v. Board of Commissioners of Billings County,23N.D.547., 137N.W.484(N.D.1912). Retrieved via Westlaw.
This page is based on this Wikipedia article Text is available under the CC BY-SA 4.0 license; additional terms may apply. Images, videos and audio are available under their respective licenses.