1940 United States presidential election in Utah

Last updated

1940 United States presidential election in Utah
Flag of Utah (1922-2011).svg
  1936
November 5, 1940
1944  
  FDRoosevelt1938.jpg WendellWillkie.jpg
Nominee Franklin D. Roosevelt Wendell Willkie
Party Democratic Republican
Home state New York New York
Running mate Henry A. Wallace Charles L. McNary
Electoral vote40
Popular vote154,27793,151
Percentage62.25%37.59%

Utah Presidential Election Results 1940.svg
County Results

President before election

Franklin D. Roosevelt
Democratic

Elected President

Franklin D. Roosevelt
Democratic

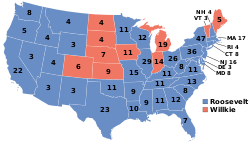
The 1940 United States presidential election in Utah took place on November 5, 1940, as part of the 1940 United States presidential election. All contemporary forty-eight states took part, and state voters selected four voters to the Electoral College, who voted for president and vice president.

Contents

Utah, like every other state west of the Continental Divide, voted for Franklin D. Roosevelt over Wendell Willkie by a substantial margin. This was the first time any Democrat won the state more than twice. Roosevelt landslided Utah with 62.25 percent of the vote. The percentage, however, wasn't as large as his victory in the state four years earlier. As of the 2024 presidential election , this is the last election in which Piute County voted for a Democratic presidential candidate. [1]

Results

General Election Results [2] [3]
PartyPledged toElectorVotes
Democratic Party Franklin D. RooseveltOscar W. McConckie154,277
Democratic Party Franklin D. RooseveltMrs. George S. Baliff153,833
Democratic Party Franklin D. RooseveltJoseph Jensen153,734
Democratic Party Franklin D. RooseveltSophus Bertleson153,473
Republican Party Wendell WillkieS. Marion Bliss93,151
Republican Party Wendell WillkieMrs. R. L. Ashby92,973
Republican Party Wendell WillkieClarence Dahl92,852
Republican Party Wendell WillkieJohn W. Guild92,356
Socialist Party Norman ThomasJ. D. DeFriez200
Socialist Party Norman ThomasIsabel Adamson198
Socialist Party Norman ThomasWilliam J. McConnell198
Socialist Party Norman ThomasEmil Munez197
Communist Party Earl BrowderDavid Douglas Jr.191
Communist Party Earl BrowderMarguerite H. Forest188
Communist Party Earl BrowderHyrum James Woolman188
Communist Party Earl BrowderWilliam Mathrus185
Votes cast [a] 247,819

Results by county

County [2] [3] Franklin D. Roosevelt
Democratic
Wendell Willkie
Republican
Norman Thomas
Socialist
Earl Browder
Communist
MarginTotal votes cast [a]
#%#%#%#%#%
Beaver 1,30354.18%1,10145.78%10.04%00.00%2028.40%2,405
Box Elder 4,73659.30%3,24840.67%20.03%00.00%1.48818.63%7,986
Cache 7,86760.25%5,18439.70%60.05%10.01%2,68320.55%13,058
Carbon 5,18069.47%2,24230.07%100.13%240.32%2,93839.40%7,456
Daggett 16062.50%9637.50%00.00%00.00%6425.00%256
Davis 3,86557.63%2,83642.28%10.01%50.07%1,02915.34%6,707
Duchesne 1,98259.92%1,32239.96%40.12%00.00%66019.95%3,308
Emery 1,90165.13%1,00634.46%100.34%20.07%89530.66%2,919
Garfield 81444.14%1,03055.86%00.00%00.00%-216-11.71%1,844
Grand 44650.62%43249.04%30.34%00.00%141.59%881
Iron 1,91547.90%2,06051.53%210.53%20.05%-145-3.63%3,998
Juab 2,13660.12%1,41239.74%50.14%00.00%72420.38%3,553
Kane 33933.43%67566.57%00.00%00.00%-336-33.14%1,014
Millard 2,30254.10%1,94345.66%70.16%30.07%3598.44%4,255
Morgan 69954.87%57545.13%00.00%00.00%1249.73%1,274
Piute 46651.21%44248.57%10.11%10.11%242.64%910
Rich 47551.52%44748.48%00.00%00.00%283.04%922
Salt Lake 67,31865.40%35,42734.42%660.06%1150.11%31,89130.98%102,926
San Juan 51549.19%52850.43%10.10%30.29%-13-1.24%1,047
Sanpete 3,52448.61%3,72251.34%30.04%10.04%-198-2.73%7,250
Sevier 2,52148.22%2,70351.70%40.08%00.00%-182-3.48%5,228
Summit 2,21556.10%1,73043.82%00.00%30.08%48512.28%3,948
Tooele 2,62563.90%1,47635.93%70.17%00.00%1,14927.97%4,108
Uintah 1,77352.16%1,62447.78%20.06%00.00%1494.38%3,399
Utah 15,16863.32%8,74036.48%230.10%250.10%6,42826.83%23,956
Wasatch 1,50255.59%1,19944.37%00.00%10.04%30311.21%2,702
Washington 1,99355.04%1,62544.88%20.06%10.03%36810.16%3,621
Wayne 50056.75%38043.13%10.11%00.00%12013.62%881
Weber 18,03769.35%7,94630.55%200.08%40.02%10,09138.80%26,007
Totals154,27762.25%93,15137.59%2000.08%1910.08%61,12624.67%247,819

Counties that flipped from Democratic to Republican

See also

Notes

  1. 1 2 Based on highest elector on each ticket

References

  1. Sullivan, Robert David; ‘How the Red and Blue Map Evolved Over the Past Century’; America Magazine in The National Catholic Review; June 29, 2016
  2. 1 2 Utah State Archives, Abstract of the Returns of an Election held in the State of Utah, Tuesday, November 5, A.D. 1940 for Presidential Electors, for United States Senator, for Representatives in the Seventy-Seventh Congress of the United States, for State Officers, and District Officers in Districts comprising more than one county, and for the adoption or rejection of the proposed amendment to the Constitution of the State of Utah.
  3. 1 2 Monson, E. E., ed. (1940). Twenty-Second Biennial Report of the Secretary of State of the State Of Utah. Salt Lake City. Retrieved December 29, 2025.{{cite book}}: CS1 maint: location missing publisher (link)