1968 United States presidential election in Utah

Last updated

1968 United States presidential election in Utah
Flag of Utah (1922-2011).svg
  1964
November 5, 1968 [1]
1972  
Turnout76.7% (voting age) [2]
  Nixon 30-0316a (cropped).jpg Hubert Humphrey in New York, 1968 (3x4 crop).jpg George Wallace (D-AL) (3x4).jpg
Nominee Richard Nixon Hubert Humphrey George Wallace
Party Republican Democratic American Independent
Home state New York [a] Minnesota Alabama
Running mate Spiro Agnew Edmund Muskie Curtis LeMay
Electoral vote400
Popular vote238,728156,66526,906
Percentage56.49%37.07%6.37%

Utah Presidential Election Results 1968.svg
County Results

President before election

Lyndon B. Johnson
Democratic

Elected President

Richard Nixon
Republican

The 1968 United States presidential election in Utah took place on November 5, 1968, as part of the 1968 United States presidential election. State voters chose four [3] representatives, or electors, to the Electoral College, who voted for president and vice president.

Contents

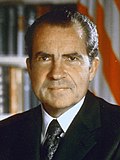
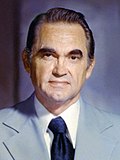
Utah was won by former Vice President Richard Nixon (RCalifornia), with 56.49 percent of the popular vote, against Vice President Hubert Humphrey (DMinnesota), with 37.07 percent of the popular vote. American Independent Party candidate George Wallace performed decently, finishing with 6.37 percent of the popular vote. [4] [5] By outpolling Humphrey in arch-Republican Kane County, Wallace became the first third-party candidate to finish even second in any non-Southern county since 1936 when William Lemke finished ahead of Alf Landon in the North Dakota counties of Bottineau, Burke, Divide, Mountrail, Towner and Williams. [6]

With 56.49 percent of the popular vote, Utah would prove to be Nixon's third strongest state in the 1968 election after Nebraska and Idaho. [7]

Utah had the highest voter turnout in terms of the voting age population out of any state in the 1968 presidential election. [8]

Results

1968 United States presidential election in Utah [9]
PartyCandidateVotes%
Republican Richard Nixon 238,728 56.49%
Democratic Hubert Humphrey 156,66537.07%
American Independent George Wallace 26,9066.37%
Peace and Freedom Eldridge Cleaver 1800.04%
Socialist Workers Fred Halstead 890.02%
Total votes422,568 100.00%

Results by county

County [9] [10] Richard Nixon
Republican
Hubert Humphrey
Democratic
George Wallace
American Independent
Eldridge Cleaver
Peace and Freedom
Fred Halstead
Socialist Workers
MarginTotal votes cast
#%#%#%#%#%#%
Beaver 98950.87%79540.90%1588.13%20.10%00.00%1949.97%1,944
Box Elder 7,68065.71%3,09326.46%9077.76%60.05%20.02%4,58739.25%11,688
Cache 11,90668.81%4,32725.01%1,0506.07%170.10%30.02%7,57943.80%17,303
Carbon 2,61836.17%4,34460.01%2713.74%20.03%40.06%-1,726-23.84%7,239
Daggett 15252.23%9733.33%4214.43%00.00%00.00%5518.90%291
Davis 20,65860.60%10,62431.17%2,7878.18%180.05%00.00%10,03429.43%34,087
Duchesne 1,73361.15%85830.28%2438.57%00.00%00.00%87530.87%2,834
Emery 1,22350.89%1,01942.41%1616.70%00.00%00.00%2048.48%2,403
Garfield 1,03369.47%31421.12%1399.35%00.00%10.07%71948.35%1,487
Grand 1,43560.88%70730.00%2159.12%00.00%00.00%72830.88%2,357
Iron 3,33766.59%1,15723.09%51410.26%20.04%10.02%2,18043.50%5,011
Juab 1,20153.95%90740.75%1185.30%00.00%00.00%29413.20%2,226
Kane 81471.72%14712.95%17415.33%00.00%00.00%640 [b] 56.39%1,135
Millard 2,31866.06%97127.67%2206.27%00.00%00.00%1,34738.39%3,509
Morgan 1,02059.89%55132.35%1307.63%10.06%10.06%46927.54%1,703
Piute 41164.42%16726.18%609.40%00.00%00.00%24438.24%638
Rich 52570.28%18324.50%395.22%00.00%00.00%34245.78%747
Salt Lake 101,94254.03%77,24740.94%9,3234.94%970.05%54 [c] 0.03%24,69513.09%188,663
San Juan 1,39359.66%68029.12%26211.22%00.00%00.00%71330.54%2,335
Sanpete 3,30462.20%1,69631.93%3075.78%50.09%00.00%1,60830.27%5,312
Sevier 3,19067.24%1,16724.60%3848.09%10.02%20.04%2,02342.64%4,744
Summit 1,78262.37%96133.64%1133.96%00.00%10.04%82128.73%2,857
Tooele 3,42241.39%4,25051.41%5927.16%30.04%00.00%-828-10.02%8,267
Uintah 3,03465.64%1,14524.77%4379.45%50.11%10.02%1,88940.87%4,622
Utah 29,22659.01%16,62933.57%3,6667.40%50.01%20.00%12,59725.44%49,528
Wasatch 1,61160.95%94135.60%863.25%10.04%40.15%67025.35%2,643
Washington 3,22664.52%97519.50%79615.92%10.02%20.04%2,25145.02%5,000
Wayne 51162.85%24830.50%546.64%00.00%00.00%26332.35%813
Weber 27,03452.82%20,46539.98%3,6587.15%140.03%110.02%6,56912.84%51,182
Totals238,72856.49%156,66537.07%26,9066.37%1800.04%890.02%82,06319.42%422,568

Counties that flipped from Democratic to Republican

Results by congressional district

This table shows the results by congressional district. The candidate who won the largest amount of the vote nationally is shown first. Nixon won both of the Utah's 2 congressional districts. [11]

District [9] [11] NixonHumphreyWallace
#%#%#%
1st122,29358.81%70,36333.84%15,1857.30%
2nd116,43554.25%86,30240.21%11,7215.46%

See also

Notes

  1. Although he was born in California and he served as a U.S. Senator from California, in 1968 Richard Nixon’s official state of residence was New York, because he moved there to practice law after his defeat in the 1962 California gubernatorial election. During his first term as president, Nixon re-established his residency in California. Consequently, most reliable reference books list Nixon's home state as New York in the 1968 election and his home state as California in the 1972 (and 1960) election.
  2. In this county where Wallace ran second ahead of Humphrey, the margin given is that between Nixon and Wallace.
  3. These votes were mistakenly assigned to San Juan County in the state's abstract.

References

  1. "United States Presidential election of 1968 - Encyclopædia Britannica" . Retrieved May 25, 2017.
  2. "Population Estimates and Projections" (PDF). United States Census Bureau. March 1972. Retrieved August 10, 2024.
  3. "1968 Election for the Forty-Sixth Term (1969-73)" . Retrieved May 25, 2017.
  4. "1968 Presidential General Election Results - Utah" . Retrieved May 25, 2017.
  5. "The American Presidency Project - Election of 1968" . Retrieved May 25, 2017.
  6. Scammon, Richard M. (compiler); America at the Polls: A Handbook of Presidential Election Statistics 1920-1964; pp. 339, 343 ISBN   0405077114
  7. "1968 Presidential Election Statistics". Dave Leip’s Atlas of U.S. Presidential Elections. Retrieved March 5, 2018.
  8. "Population Estimates and Projections" (PDF). United States Census Bureau. March 1972. Retrieved August 10, 2024.
  9. 1 2 3 "Abstract of the Returns of an Election held in the State of Utah, Tuesday, November 5, 1968" (PDF). Retrieved December 29, 2025.
  10. Scammon, Richard M., ed. (1970). America Votes 8: A Handbook of Contemporary American Election Statistics. Washington D.C.: Congressional Quarterly. p. 384. Retrieved December 29, 2025.
  11. 1 2 Park-Egan, Kiernan. "1968 United States Presidential Election, Results by Congressional District". U.S. Presidential Election Results by Congressional District, 1952 to 2020. Retrieved October 30, 2023.