1964 United States presidential election in Ohio

Last updated

1964 United States presidential election in Ohio
Flag of Ohio.svg
  1960 November 3, 1964 1968  
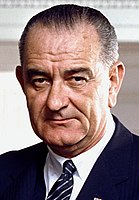
  37 Lyndon Johnson 3x4 (cropped).jpg Goldwater and Miller (cropped).jpg
Nominee Lyndon B. Johnson Barry Goldwater
Party Democratic Republican
Home state Texas Arizona
Running mate Hubert Humphrey William E. Miller
Electoral vote260
Popular vote2,498,3311,470,865
Percentage62.94%37.06%

Ohio Presidential Election Results 1964.svg
County Results

President before election

Lyndon B. Johnson
Democratic

Elected President

Lyndon B. Johnson
Democratic

The 1964 United States presidential election in Ohio was held on November 3, 1964 as part of the 1964 United States presidential election. Voters chose 26 representatives, or electors, to the Electoral College, who voted for President and Vice President.

Contents

Ohio was overwhelmingly won by the Democratic nominee, incumbent President Lyndon B. Johnson, who carried the state with 62.94% of the vote against Republican nominee Barry Goldwater’s 37.06%. The 1964 election marked the best performance for the Democratic Party in the state, as it was the only time a Democratic candidate for president won it with over 60% of the popular vote (and the last time a nominee from either party has done so), the last time the Democratic candidate carried more counties than the Republican candidate, and the last time the margin of victory for the Democratic candidate was in double digits.

This is the only election since 1848 in which Clinton, Warren and Geauga Counties have voted for a Democratic presidential candidate. [1] Ashland, Auglaize, Butler, Champaign, Clermont, Crawford, Darke, Defiance, Fairfield, Fayette, Greene, Hardin, Henry, Highland, Holmes, Knox, Licking, Logan, Madison, Marion, Medina, Miami, Morgan, Morrow, Muskingum, Paulding, Pickaway, Preble, Putnam, Richland, Shelby, Van Wert, Washington, Wayne, Williams, and Wyandot counties have never voted Democratic since, while Franklin County did not vote Democratic again until 1996 and Hamilton County did not do so again until 2008. [2]

Results

1964 United States presidential election in Ohio [3]
PartyCandidateRunning mateVotesPercentageElectoral votes
Democratic Lyndon B. Johnson Hubert Humphrey 2,498,33162.94%26
Republican Barry Goldwater William E. Miller 1,470,86537.06%0
Totals3,969,296100.00%26
Voter turnout (registered voters) %

Results by county

CountyLyndon Baines Johnson
Democratic
Barry Morris Goldwater
Republican
MarginTotal votes cast
# %# %# %
Adams 5,00557.48%3,70242.52%1,30314.96%8,707
Allen 18,99048.83%19,89751.17%-907-2.33%38,887
Ashland 8,49353.75%7,30846.25%1,1857.50%15,801
Ashtabula 24,10464.64%13,18335.36%10,92129.29%37,287
Athens 10,63363.13%6,21136.87%4,42226.25%16,844
Auglaize 8,63252.04%7,95447.96%6784.09%16,586
Belmont 28,18074.41%9,69325.59%18,48748.81%37,873
Brown 6,98364.14%3,90435.86%3,07928.28%10,887
Butler 42,27857.37%31,41342.63%10,86514.74%73,691
Carroll 5,05058.01%3,65541.99%1,39516.03%8,705
Champaign 7,13856.09%5,58843.91%1,55012.18%12,726
Clark 34,27564.20%19,11235.80%15,16328.40%53,387
Clermont 16,52355.28%13,36744.72%3,15610.56%29,890
Clinton 6,51451.71%6,08248.29%4323.43%12,596
Columbiana 28,70664.46%15,82735.54%12,87928.92%44,533
Coshocton 8,38258.42%5,96541.58%2,41716.85%14,347
Crawford 11,96857.16%8,97042.84%2,99814.32%20,938
Cuyahoga 492,91171.50%196,43628.50%296,47543.01%689,347
Darke 12,43359.17%8,58140.83%3,85218.33%21,014
Defiance 8,70763.30%5,04836.70%3,65926.60%13,755
Delaware 8,08049.04%8,39550.96%-315-1.91%16,475
Erie 15,96861.54%9,98138.46%5,98723.07%25,949
Fairfield 15,61157.62%11,48042.38%4,13115.25%27,091
Fayette 6,12857.30%4,56742.70%1,56114.60%10,695
Franklin 154,52754.05%131,34545.95%23,1828.11%285,872
Fulton 5,60448.41%5,97351.59%-369-3.19%11,577
Gallia 4,74051.81%4,40848.19%3323.63%9,148
Geauga 12,21256.45%9,42343.55%2,78912.89%21,635
Greene 21,27659.35%14,57140.65%6,70518.70%35,847
Guernsey 9,50359.65%6,42940.35%3,07419.29%15,932
Hamilton 199,12755.27%161,17944.73%37,94810.53%360,306
Hancock 11,54749.86%11,61050.14%-63-0.27%23,157
Hardin 7,32456.33%5,67943.67%1,64512.65%13,003
Harrison 5,15963.79%2,92836.21%2,23127.59%8,087
Henry 5,84553.43%5,09446.57%7516.87%10,939
Highland 7,28154.88%5,98545.12%1,2969.77%13,266
Hocking 5,95167.56%2,85832.44%3,09335.11%8,809
Holmes 3,55962.82%2,10637.18%1,45325.65%5,665
Huron 10,78058.48%7,65541.52%3,12516.95%18,435
Jackson 7,05658.78%4,94941.22%2,10717.55%12,005
Jefferson 33,03973.71%11,78426.29%21,25547.42%44,823
Knox 11,22260.73%7,25839.27%3,96421.45%18,480
Lake 38,55262.35%23,28237.65%15,27024.70%61,834
Lawrence 12,63561.96%7,75738.04%4,87823.92%20,392
Licking 23,36460.75%15,09639.25%8,26821.50%38,460
Logan 8,48455.94%6,68344.06%1,80111.87%15,167
Lorain 55,75567.63%26,68332.37%29,07235.27%82,438
Lucas 128,11068.92%57,78231.08%70,32837.83%185,892
Madison 5,26451.56%4,94548.44%3193.12%10,209
Mahoning 90,93472.92%33,77527.08%57,15945.83%124,709
Marion 14,40058.90%10,05041.10%4,35017.79%24,450
Medina 14,72959.03%10,22140.97%4,50818.07%24,950
Meigs 5,13356.37%3,97343.63%1,16012.74%9,106
Mercer 10,08169.75%4,37330.25%5,70839.49%14,454
Miami 19,37959.88%12,98540.12%6,39419.76%32,364
Monroe 4,77671.07%1,94428.93%2,83242.14%6,720
Montgomery 126,63363.76%71,97936.24%54,65427.52%198,612
Morgan 3,05357.24%2,28142.76%77214.47%5,334
Morrow 4,57252.16%4,19447.84%3784.31%8,766
Muskingum 20,79264.12%11,63535.88%9,15728.24%32,427
Noble 2,92556.52%2,25043.48%67513.04%5,175
Ottawa 9,61863.04%5,63936.96%3,97926.08%15,257
Paulding 4,46557.84%3,25442.16%1,21115.69%7,719
Perry 7,81666.74%3,89533.26%3,92133.48%11,711
Pickaway 7,31057.89%5,31742.11%1,99315.78%12,627
Pike 5,33167.50%2,56732.50%2,76435.00%7,898
Portage 23,30868.25%10,84231.75%12,46636.50%34,150
Preble 7,57456.47%5,83943.53%1,73512.94%13,413
Putnam 7,01457.33%5,22142.67%1,79314.65%12,235
Richland 24,79956.84%18,83343.16%5,96613.67%43,632
Ross 12,70456.90%9,62343.10%3,08113.80%22,327
Sandusky 13,48162.02%8,25437.98%5,22724.05%21,735
Scioto 21,55961.55%13,46538.45%8,09423.11%35,024
Seneca 14,51860.36%9,53639.64%4,98220.71%24,054
Shelby 10,00465.84%5,19034.16%4,81431.68%15,194
Stark 88,70462.32%53,63237.68%35,07224.64%142,336
Summit 142,31967.67%68,00032.33%74,31935.34%210,319
Trumbull 54,34266.76%27,05933.24%27,28333.52%81,401
Tuscarawas 23,62370.34%9,96229.66%13,66140.68%33,585
Union 4,98547.53%5,50452.47%-519-4.95%10,489
Van Wert 7,69555.40%6,19444.60%1,50110.81%13,889
Vinton 2,61857.70%1,91942.30%69915.41%4,537
Warren 12,40653.04%10,98246.96%1,4246.09%23,388
Washington 11,19355.78%8,87344.22%2,32011.56%20,066
Wayne 14,80659.95%9,89040.05%4,91619.91%24,696
Williams 7,54757.17%5,65342.83%1,89414.35%13,200
Wood 16,30457.32%12,14242.68%4,16214.63%28,446
Wyandot 5,27356.02%4,13943.98%1,13412.05%9,412
Totals2,498,33162.94%1,470,86537.06%1,027,46625.88%3,969,196

See also

Related Research Articles

<span class="mw-page-title-main">1876 United States presidential election</span> 23rd quadrennial U.S. presidential election

The 1876 United States presidential election was the 23rd quadrennial presidential election, held on Tuesday, November 7, 1876, in which Republican nominee Rutherford B. Hayes faced Democrat Samuel J. Tilden. It was one of the most contentious presidential elections in American history. Its resolution involved negotiations between the Republicans and Democrats, resulting in the Compromise of 1877, and on March 2, 1877, the counting of electoral votes by the House and Senate occurred, confirming Hayes as President. It was the second of five U.S. presidential elections in which the winner did not win a plurality of the national popular vote.

<span class="mw-page-title-main">1888 United States presidential election</span> 26th quadrennial U.S. presidential election

The 1888 United States presidential election was the 26th quadrennial presidential election, held on Tuesday, November 6, 1888. Republican nominee Benjamin Harrison, a former Senator from Indiana, defeated incumbent Democratic President Grover Cleveland of New York. It was the third of five U.S. presidential elections in which the winner did not win the national popular vote, which would not occur again until the 2000 US presidential election.

<span class="mw-page-title-main">1932 United States presidential election</span> 37th quadrennial U.S. presidential election

The 1932 United States presidential election was the 37th quadrennial presidential election, held on Tuesday, November 8, 1932. The election took place against the backdrop of the Great Depression. The incumbent Republican President Herbert Hoover was defeated in a landslide by Democrat Franklin D. Roosevelt, the governor of New York and the vice presidential nominee of the 1920 presidential election. Roosevelt was the first Democrat in 80 years to simultaneously win an outright majority of the electoral college and popular vote, a feat last accomplished by Franklin Pierce in 1852, as well as the first Democrat in 56 years to win a majority of the popular vote, which was last done by Samuel J. Tilden in 1876. Roosevelt was the last sitting governor to be elected president until Bill Clinton in 1992. Hoover became the first incumbent president to lose an election to another term since William Howard Taft in 1912, and the last to do so until Gerald Ford lost 44 years later. The election marked the effective end of the Fourth Party System, which had been dominated by Republicans. It was the first time since 1916 that a Democrat was elected president.

<span class="mw-page-title-main">1976 United States presidential election</span> 48th quadrennial U.S. presidential election

The 1976 United States presidential election was the 48th quadrennial presidential election, held on Tuesday, November 2, 1976. Democrat Jimmy Carter, former Governor of Georgia, defeated incumbent Republican president Gerald Ford in a narrow victory.

<span class="mw-page-title-main">2004 United States presidential election in Colorado</span> Election in Colorado

The 2004 United States presidential election in Colorado took place on November 2, 2004, and was part of the 2004 United States presidential election. Voters chose nine representatives, or electors to the Electoral College, who voted for president and vice president.

<span class="mw-page-title-main">2000 United States presidential election in New Hampshire</span> Election in New Hampshire

The 2000 United States presidential election in New Hampshire took place on Election Day on November 7, 2000 as part of the 2000 United States presidential election. The 2 major candidates were Texas Governor George W. Bush of the Republican Party and sitting Vice President Al Gore of the Democratic Party. When all votes were tallied, Bush was declared the winner with a plurality of the vote over Gore, receiving 48% of the vote to Gore's 47%, while Green Party candidate Ralph Nader received almost 4% of the vote in the state. Bush went on to win the election nationwide. Had incumbent Vice President Gore come out victorious in New Hampshire with its four electoral votes, he would have won the presidency, regardless of the outcome of Bush v. Gore.

<span class="mw-page-title-main">1996 United States presidential election in Georgia</span> Election in Georgia

The 1996 United States presidential election in Georgia took place on November 5, 1996, as part of the 1996 United States presidential election. Voters chose 13 representatives, or electors to the Electoral College, who voted for president and vice president.

<span class="mw-page-title-main">1988 United States presidential election in Pennsylvania</span> Election in Pennsylvania

The 1988 United States presidential election in Pennsylvania took place on November 8, 1988, and was part of the 1988 United States presidential election. Voters chose 25 representatives, or electors to the Electoral College, who voted for president and vice president.
<span class="mw-page-title-main">2012 United States presidential election in Ohio</span> Election in Ohio

The 2012 United States presidential election in Ohio took place on November 6, 2012, as part of the 2012 United States presidential election in which all 50 states plus the District of Columbia participated. Ohio voters chose 18 electors to represent them in the Electoral College via a popular vote pitting incumbent Democratic President Barack Obama and his running mate, Vice President Joe Biden, against Republican challenger and former Massachusetts Governor Mitt Romney and his running mate, Congressman Paul Ryan. This election continued Ohio's bellwether streak, as the state voted for the winner of the presidency in every election from 1964 to 2016.

<span class="mw-page-title-main">1996 United States presidential election in Connecticut</span> Election in Connecticut

The 1996 United States presidential election in Connecticut took place on November 5, 1996, as part of the 1996 United States presidential election. Voters chose eight representatives, or electors to the Electoral College, who voted for president and vice president.
<span class="mw-page-title-main">1992 United States presidential election in Colorado</span> Election in Colorado

The 1992 United States presidential election in Colorado took place on November 3, 1992, as part of the 1992 United States presidential election. Voters chose eight representatives, or electors to the Electoral College, who voted for president and vice president.

<span class="mw-page-title-main">1964 United States presidential election in New York</span>

The 1964 United States presidential election in New York took place on November 3, 1964, as part of the 1964 United States presidential election in which all 50 states plus the District of Columbia participated. New York voters chose 43 electors to represent them in the Electoral College via a popular vote pitting incumbent Democratic President Lyndon B. Johnson and his running mate, President pro tempore of the Senate Hubert Humphrey, against Republican challenger and Senator Barry Goldwater from Arizona and his running mate and Chair of the Republican National Committee, William E. Miller.

<span class="mw-page-title-main">1912 United States presidential election in New York</span>

The 1912 United States presidential election in New York took place on November 5, 1912. All contemporary 48 states were part of the 1912 United States presidential election. Voters chose 45 electors to the Electoral College, which selected the president and vice president.

<span class="mw-page-title-main">1964 United States presidential election in Massachusetts</span> Election in Massachusetts

The 1964 United States presidential election in Massachusetts took place on November 3, 1964, as part of the 1964 United States presidential election, which was held throughout all 50 states and D.C. Voters chose 14 representatives, or electors to the Electoral College, who voted for president and vice president.

<span class="mw-page-title-main">1964 United States presidential election in New Jersey</span> Election in New Jersey

The 1964 United States presidential election in New Jersey took place on November 3, 1964. All 50 states and the District of Columbia, were part of the 1964 United States presidential election. Voters chose 17 electors to the Electoral College, which selected the president and vice president.

<span class="mw-page-title-main">1912 United States presidential election in New Jersey</span> Election in New Jersey

The 1912 United States presidential election in New Jersey took place on November 5, 1912. All contemporary 48 states were part of the 1912 United States presidential election. Voters chose 14 electors to the Electoral College, which selected the president and vice president.

<span class="mw-page-title-main">1968 United States presidential election in New Hampshire</span> Election in New Hampshire

The 1968 United States presidential election in New Hampshire took place on November 5, 1968, as part of the 1968 United States presidential election, which was held throughout all 50 states and the District of Columbia. Voters chose four representatives, or electors to the Electoral College, who voted for president and vice president.

<span class="mw-page-title-main">1964 United States presidential election in New Hampshire</span> Election in New Hampshire

The 1964 United States presidential election in New Hampshire took place on November 5, 1964, as part of the 1964 United States presidential election, which was held throughout all 50 states and D.C. Voters chose four representatives, or electors to the Electoral College, who voted for president and vice president.

<span class="mw-page-title-main">1964 United States presidential election in Texas</span> Election in Texas

The 1964 United States presidential election in Texas was held on November 3, 1964, as part of the 1964 United States presidential election. The Democratic Party candidate, incumbent President Lyndon B. Johnson, comfortably won his home state of Texas with 63.32% of the vote against the Republican Party candidate, Senator Barry Goldwater of Arizona, who won 36.5%, giving him the state's 25 electoral votes and a victory margin of 26.8 percentage points. Johnson won the 1964 election in a landslide, carrying 44 states plus the District of Columbia, which participated for the first time. Goldwater only carried his home state of Arizona, along with five Deep South states which had been historically Democratic, but defected to the Republican Party due to the Democratic Party’s support for civil rights. Due to its status as Johnson's home state, in 1964, Texas was the most Democratic of the 11 states of the former Confederacy and the only one which leaned more Democratic than the nation at-large.

<span class="mw-page-title-main">1964 United States presidential election in Maine</span> Election in Maine

The 1964 United States presidential election in Maine took place on November 3, 1964, as part of the 1964 United States presidential election, which was held throughout all fifty states and D.C. Voters chose four representatives, or electors to the Electoral College, who voted for president and vice president.

References

  1. Menendez, Albert J.; The Geography of Presidential Elections in the United States, 1868-2004, pp. 275-279 ISBN   0786422173
  2. Sullivan, Robert David; ‘How the Red and Blue Map Evolved Over the Past Century’; America Magazine in The National Catholic Review; June 29, 2016
  3. Dave Leip’s U.S. Election Atlas; 1964 Presidential General Election Results – Ohio