In 2006, Progressive Farmer rated Ontario County as the "Best Place to Live" in the U.S., for its "great schools, low crime, excellent health care" and its proximity to Rochester.
History
This area was long controlled by the Seneca people, one of the Five Nations of the Iroquois Confederacy, or Haudenosaunee. They were forced to cede most of their land to the United States after the American Revolutionary War.
When the English established counties in New York Province in 1683, they designated Albany County as including all the northern part of New York State, the present State of Vermont, and, in theory, extending westward to the Pacific Ocean. On July 3, 1766 Cumberland County was organized, and on March 16, 1770 Gloucester County was founded, both containing territory now included in the state of Vermont. The English claims were their assertion; the Five and then Six Nations of the Iroquois occupied and controlled most of the territory in central and western New York until after the Revolutionary War.
As New York was more heavily settled in the 18th century, the colonial government organized additional counties, but European settlement did not proceed very far west past Little Falls, New York, about halfway through the Mohawk Valley, until after the revolutionary war. This area was ostensibly part of Montgomery County, renamed after the war for an American officer. Seth Read, a Colonel in the Battle of Bunker Hill, moved here with his family as a pioneer between 1787 and 1795. See also Geneva (town), New York.[3]
Land-hungry settlers from New England swept into upstate and western New York after the Revolution, as nearly five million acres of new lands were available for purchase since the Iroquois were forced to cede most of their territories to the United States. Four tribes had allied with the British and were mostly resettled in Canada: the Mohawk, Onondaga, Seneca and Cayuga.
Transfer of what is now Ontario County to New York formally took effect in 1789, when native title was extinguished, and the county was formally established to govern the lands of the Phelps and Gorham Purchase the year prior. The territory first organized as Ontario County was much larger than at present and ran south from the shore of Lake Ontario. As the area was settled, new counties were organized. The following counties were rapidly organized from this territory in the first decades after the war: Allegany, Cattaraugus, Chautauqua, Erie, Genesee, Livingston, Monroe, Niagara, Orleans, Steuben, Wyoming, and Yates counties, and parts of Schuyler and Wayne counties.
In 1821, portions of Genesee County were combined with portions of Ontario County to create Livingston and Monroe counties.
In 1823, a portion of Seneca County was combined with a portion of Ontario County to create Wayne County. The same year, a portion of Steuben County was combined with a portion of Ontario County to create Yates County.
Joseph Smith, founder of the Latter Day Saint movement, lived in Manchester in the 1820s on the border with Palmyra. Several events in the early history of the movement occurred in Ontario County. Hill Cumorah in Manchester is where Smith said he discovered the Golden plates said to contain the writings later known as the Book of Mormon. Smith visited the hill each year on the fall equinox (September 22) between 1823 and 1827, and claimed to be instructed by the Angel Moroni. Smith said he was finally permitted to take the record on September 22, 1827. He published the Book of Mormon in Palmyra in 1830. The 110-foot (34m) hill (which was then unnamed) is on the main road toward Canandaigua from Palmyra to Manchester (modern State Route 21); it was a few miles from Joseph Smith's home.
Since the 1930s the Church of Jesus Christ of Latter-day Saints has held the Hill Cumorah Pageant annually here. It regularly attracts thousands to its performances.[4] The church also maintains a visitors' center at the hill, the Palmyra New York Temple, and the former Smith property and homes. The latter property straddles the border between Ontario and Wayne counties.
Geography
According to the U.S. Census Bureau, the county has a total area of 663 square miles (1,720km2), of which 644 square miles (1,670km2) is land and 18 square miles (47km2) (2.8%) is water.[5]
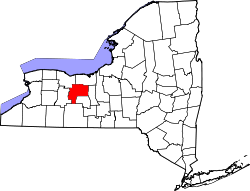
Ontario County is in western New York State, east of Buffalo, southeast of Rochester, and northwest of Ithaca. The county is within the Finger Lakes Region of the state.
The county is governed by an elected Board of Supervisors, and uses the Board-Administrator system, hiring a professional County Administrator. The Board of Supervisors has twenty-one members: one is elected from each Town, two from the city of Canandaigua and three from the city of Geneva. As of 2004, the county government has over 800 full-time employees (augmented by another 360 seasonal or available part-time workers), and a budget of $136 million.
The county is similar in its politics to much of the rest of rural upstate New York; its voters have tended to support Republican presidential candidates ever since that party was formed, and before that they supported the Whig Party.
However, beginning in the 1990s, the Democratic Party began to improve its performance in Ontario County thanks to the growth of Rochester's outer suburbs in areas such as Victor and Farmington. In 1996, Ontario County voted for the Democratic presidential candidate for the first time since 1964 and only the second time since the Whig Party contested its first presidential election in 1836. In 2008, John McCain narrowly edged a victory over Barack Obama by less than one percent, and in 2012 Obama narrowly lost the county to Republican nominee Mitt Romney by a margin of 1.5 percent. In 2016, Republican nominee Donald Trump of New York City won the county by 7.3 percent over Democratic nominee and former United States Secretary of State / former Senator from New York Hillary Clinton of Chappaqua, New York. In 2020, Democrat Joe Biden came incredibly close to winning the county, losing to Trump by just 33 votes. In 2024, Trump received just over 50% of the vote, the first time a presidential candidate gained a majority instead of a plurality in the county since 2004.
All of the county not covered by the 54th district (Towns of Bristol, Canadice, East Bloomfield, Naples, Richmond, South Bristol, Victor, West Bloomfield)[9]
According to the 2022 Census of Agriculture, Ontario County ranked fourth in New York for acres of berries grown.[11] Farmers in the county reported berries grown on 220 acres that year.
U.S. Decennial Census[12] 1790-1960[13] 1900-1990[14] 1990-2000[15] 2010-2020[1]
2020 census
Ontario County, New York – Racial and ethnic composition Note: the US Census treats Hispanic/Latino as an ethnic category. This table excludes Latinos from the racial categories and assigns them to a separate category. Hispanics/Latinos may be of any race.
As of the census[25] of 2000, there were 100,224 people, 38,370 households, and 26,360 families residing in the county. The population density was 156 inhabitants per square mile (60/km2). There were 42,647 housing units at an average density of 66 unitsper square mile (25/km2). According to respondents' self-identification, the racial makeup of the county was 95.04% White, 2.06% African American, 0.22% Native American, 0.69% Asian, 0.02% Pacific Islander, 0.70% from other races, and 1.26% from two or more races. Hispanic or Latino of any race were 2.14% of the population. Based on self-identification, 17.9% were of German, 14.9% Irish, 14.8% English, 13.8% Italian, 7.3% American and 5.1% Dutch ancestry according to Census 2000. 95.6% spoke English and 2.3% Spanish as their first language.
There were 38,370 households, out of which 32.80% had children under the age of 18 living with them, 55.00% were married couples living together, 9.90% had a female householder with no husband present, and 31.30% were non-families. 24.70% of all households were made up of individuals, and 10.10% had someone living alone who was 65 years of age or older. The average household size was 2.53 and the average family size was 3.03.
In the county, the population was spread out, with 25.40% under the age of 18, 8.30% from 18 to 24, 28.40% from 25 to 44, 24.80% from 45 to 64, and 13.20% who were 65 years of age or older. The median age was 38 years. For every 100 females there were 95.60 males. For every 100 females age 18 and over, there were 92.70 males.
The median income for a household in the county was $44,579, and the median income for a family was $52,698. Males had a median income of $36,732 versus $26,139 for females. The per capita income for the county was $21,533. About 4.90% of families and 7.30% of the population were below the poverty line, including 9.10% of those under age 18 and 6.40% of those age 65 or over.
↑ W, Eric (April 2, 2012). "Congressional District 27"(PDF). View 2012 Congressional Maps. Albany, New York: The New York State Legislative Task Force on Demographic Research and Reapportionment. Retrieved January 13, 2013.
↑ W, Eric (March 2, 2012). "Senate District 54"(PDF). View 2012 Senate District Maps. Albany, New York: The New York State Legislative Task Force on Demographic Research and Reapportionment. Retrieved January 6, 2013.
↑ W, Eric (March 2, 2012). "Senate District 55"(PDF). View 2012 Senate District Maps. Albany, New York: The New York State Legislative Task Force on Demographic Research and Reapportionment. Retrieved January 6, 2013.
↑ W, Eric (January 25, 2012). "Assembly District 131"(PDF). View Proposed 2012 Assembly District Maps. Albany, New York: The New York State Legislative Task Force on Demographic Research and Reapportionment. Retrieved January 6, 2013.
This page is based on this Wikipedia article Text is available under the CC BY-SA 4.0 license; additional terms may apply. Images, videos and audio are available under their respective licenses.