Statistics | |
---|---|
GDP | $2.3 trillion (2024) [1] |
GDP per capita | $117,332 (2024) [2] |
Population below poverty line | 13.6% [3] |
0.5157 ± 0.0029 (2023) [4] | |
Labour force | 9,645,984 (2023) [5] |
Unemployment | 4.4% (August 2024) [6] |
Public finances | |
Revenues | $63.5 billion [7] |
Expenses | $54.6 billion [8] |
The economy of the State of New York is reflected in its gross state product in 2024 of $2.284 trillion, ranking third in size behind the larger states of California and Texas. If New York State were an independent nation, it would rank as the 10th largest economy in the world by nominal GDP. However, in 2019, the multi-state, New York City-centered metropolitan statistical area produced a gross metropolitan product (GMP) of $US2.0 trillion, ranking first nationally by a wide margin and would also rank as the 10th largest GDP in the world.
The state has a large manufacturing sector, which includes printing and publishing and the production of garments, furs, railroad rolling stock, and bus line vehicles. Some industries are concentrated in upstate locations also, such as ceramics and glass (the southern tier of counties), microchips and nanotechnology (Albany) and the Greater Capital District, and photographic equipment (Rochester). New York's agricultural outputs comprise dairy products, cattle and other livestock, vegetables, nursery stock, and apples. In April 2021, GlobalFoundries, a company specializing in the semiconductor industry, moved its headquarters from Silicon Valley, California to its most advanced semiconductor-chip manufacturing facility in Saratoga County near a section of the Adirondack Northway, in Malta, New York. [9]
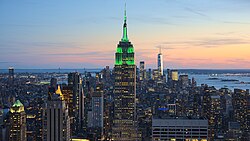
New York City, characterized as the world's principal fintech and financial center, [11] [14] [15] [16] and the surrounding New York metropolitan area dominate the economy of the state. Manhattan is the leading center of banking, finance, and communication in the United States and is the location of the New York Stock Exchange (NYSE) on Wall Street. Many of the world's largest corporations locate their home offices in Manhattan or in nearby Westchester, Nassau, and Suffolk counties. Manhattan contained over 500 million square feet (46.5 million m2) of office space in 2015, [17] making it the largest office market in the United States, [18] while Midtown Manhattan, with nearly 400 million square feet (37.2 million m2) in 2015, [17] is the largest central business district in the world. [19] New York is a top-tier global high technology hub. [20]
Long Island has played a prominent role in scientific research and in engineering. It is the home of the Brookhaven National Laboratory. Seven Nobel prizes have been awarded for work conducted at Brookhaven lab. [21]
The Erie Canal, completed in 1825, opened eastern U.S. markets to Midwest farm products. The canal also contributed to the growth of New York City, helped create large cities, and encouraged immigration to the state. Except in the mountain regions, the areas between cities are agriculturally rich. The Finger Lakes region has orchards producing apples, which are one of New York's leading crops. [22] The state is known for wines produced at vineyards in the Finger Lakes region and Long Island. The state also produces other crops, especially grapes, strawberries, cherries, pears, onions, and potatoes. New York is a major supplier of maple syrup and is the third leading producer of dairy goods in the United States. [23]
According to the Department of Agriculture and Markets, New York's agricultural production returned more than $3.6 billion to the farm economy in 2005. 36,000 farms occupy 7.6 million acres or about 25 percent of the state's land area, to produce a variety of food products. [23] Here are some of the items in which New York ranks high nationally:
New York is an agricultural leader and is one of the top five states for agricultural products, including dairy, cattle, apples, cabbages, potatoes, beets, viticulture, onions, maple syrup and many others. [24] The state is the second largest producer of cabbage in the U.S. [23] The state has about a quarter of its land in farms and produced $3.4 billion in agricultural products in 2001. The south shore of Lake Ontario provides the right mix of soils and microclimate for apple, cherry, plum, pear, and peach orchards. Apples are also grown in the Hudson Valley and near Lake Champlain. The south shore of Lake Erie and the southern Finger Lakes hillsides have vineyards. New York is the nation's third-largest grape-producing state, after California and Washington. [23]
In 2017, New York State consumed 156,370-gigawatthours (GWh) of electrical energy. Downstate regions (Hudson Valley, New York City, and Long Island) consumed 66% of that amount. Upstate regions produced 50% of that amount. The peak load in 2017 was 29,699 MW. The resource capability in 2017 was 42,839 MW. [25] [26] The NYISO's market monitor described the average all-in wholesale electric price as a range (a single value was not provided) from $25 per MWh to $53 per MWh for 2017. [27]
This article needs to be updated.(September 2022) |
In 2012, LIPA adopted a power purchase agreement (limited to 50 MW), which will pay $0.22/kWh for solar generation for installations ranging from 50 kW to 20 MW. A $500 to $5000 application fee favors larger power plants represents roughly the first 10 days of generation for a 50 kW to 500 kW system, but less than 2 hours of generation for a 20 MW installation. The term of the agreement is 20 years, and systems must be interconnected to the grid at the 13.2 kV level. Unlike the feed-in tariff programs in many other places, customers pay for their own electricity as if they were not generating any, making this actually a power purchase agreement, and not a feed-in tariff. LIPA owns the SRECs (which could be worth more than they are paying for the electricity). [30] [31] A bill to establish SRECs in New York failed to pass in 2012. [32] 50 MW of solar power will meet the average needs of about 7,000 households, or less than 1% of the electricity supplied by LIPA. 5 MW is reserved for systems less than 150 kW, and 10 MW for systems from 150 to 500 kW. The remaining 35 MW is available to systems of all sizes. If fully subscribed in the first year, the average household will pay an estimated $0.44/month to pay for the program, which will generate an estimated 79.4 million kWh/year. Estimated costs are based on an average avoided cost rate of $0.075/kWh, although peak generation costs can exceed $0.22/kWh, eliminating any cost. [33] LIPA's total generation capacity, in 2011, was 6,800 MW. [34]
In 2023, the New York State Energy Research and Development Authority approved 14 new large-scale solar projects, totaling more than 1 gigawatt of capacity. [35]
According to the Solar Energy Industries Association (SEIA) in 2023, New York has a solar capacity of 5,560 MW, ranking third nationally in solar jobs with 11,512 positions. The state aims to expand its capacity by 8,923 MW over the next five years. Solar power in New York now supplies electricity to 980,034 homes, accounting for 5.01% of the state's total electricity. With a solar market valued at $11.7 billion and $1.9 billion invested in 2023, solar costs in New York have decreased by 47% in the last decade. [36]NY State rank | US Rank | World Rank * | Company | City | Employees | Revenue (in millions, USD) | Industry | rank in its US industry |
---|---|---|---|---|---|---|---|---|
1 | 23 | 53 | JPMorgan Chase | New York | 293,723 | $154,792 | Commercial Banks | 1st |
2 | 26 | 64 | Verizon Communications | New York | 117,100 | $136,835 | Telecommunications | 1st |
3 | 36 | 99 | Citigroup | New York | 238,104 | $101,078 | Commercial Banks | 3rd |
4 | 38 | 102 | Pfizer | New York | 83,000 | $100,330 | Pharmaceuticals | 1st |
5 | 46 | 135 | PepsiCo | Purchase | 315,000 | $86,392 | Food Consumer Products | 1st |
6 | 54 | 183 | MetLife | New York | 45,000 | $69,898 | Insurance: Life, Health (Stock) | 1st |
7 | 55 | 185 | Goldman Sachs Group | New York | 48,500 | $68,711 | Commercial Banks | 5th |
8 | 59 | 198 | StoneX Group | New York | 3,615 | $66,036 | Diversified Financials | 3rd |
9 | 61 | 200 | Morgan Stanley | New York | 82,427 | $65,936 | Commercial Banks | 6th |
10 | 65 | 224 | International Business Machines | Armonk | 303,100 | $60,530 | Information Technology Services | 1st |
11 | 71 | 238 | New York Life Insurance | New York | 15,050 | $58,445 | Insurance: Life, Health (Mutual) | 1st |
12 | 76 | 248 | American International Group | New York | 26,200 | $56,437 | Insurance: Property and Casualty (Stock) | 2nd |
13 | 77 | 253 | American Express | New York | 77,300 | $55,625 | Diversified Financials | 4th |
14 | 95 | 312 | Bristol-Myers Squibb | New York | 34,300 | $46,159 | Pharmaceuticals | 5th |
15 | 103 | 366 | TIAA | New York | 16,070 | $40,911 | Insurance: Life, Health (Mutual) | 2nd |
16 | 112 | 409 | Travelers | New York | 32,175 | $36,884 | Insurance: Property and Casualty (Stock) | 6th |
17 | 118 | 449 | Warner Bros. Discovery | New York | 37,500 | $33,817 | Entertainment | 1st |
18 | 134 | 492 | Paramount Global | New York | 27,400 | $31,331 | Entertainment | 4th |
19 | 158 | * | Macy's | New York | 94,570 | $25,305 | General Merchandisers | 4th |
20 | 177 | * | Mastercard | Purchase | 29,900 | $22,237 | Financial Data Services | 3rd |
21 | 193 | * | Marsh & McLennan | New York | 85,000 | $20,720 | Diversified Financials | 5th |
22 | 201 | * | Bank of New York Mellon | New York | 51,700 | $19,991 | Commercial Banks | 11th |
23 | 225 | * | Kyndryl Holdings | New York | 90,000 | $18,317 | Information Technology Services | 4th |
24 | 228 | * | Colgate-Palmolive | New York | 33,800 | $17,967 | Household and Personal Products | 3rd |
25 | 229 | * | BlackRock | New York | 19,800 | $17,873 | Securities | 2nd |
26 | 230 | * | Estée Lauder | New York | 53,865 | $17,737 | Household and Personal Products | 4th |
27 | 264 | * | Consolidated Edison | New York | 14,319 | $15,670 | Utilities: Gas and Electric | 10th |
28 | 281 | * | Guardian Life Ins. Co. of America | New York | 8,025 | $14,653 | Insurance: Life, Health (Mutual) | 5th |
29 | 290 | * | Omnicom Group | New York | 74,200 | $14,289 | Advertising, Marketing | 1st |
30 | 292 | * | Corning | Corning | 57,500 | $14,189 | Electronics, Electrical Equip. | 3rd |
31 | 297 | * | Loews | New York | 12,050 | $14,044 | Insurance: Property and Casualty (Stock) | 9th |
32 | 298 | * | Equitable Holdings | New York | 10,250 | $14,017 | Insurance: Life, Health (Stock) | 8th |
33 | 300 | * | Fox | New York | 10,600 | $13,974 | Entertainment | 6th |
34 | 325 | * | Henry Schein | Melville | 22,000 | $12,647 | Wholesalers: Health Care | 4th |
35 | 332 | * | International Flavors & Fragrances | New York | 24,600 | $12,440 | Chemicals | 10th |
36 | 339 | * | Regeneron Pharmaceuticals | Tarrytown | 11,851 | $12,173 | Pharmaceuticals | 11th |
37 | 356 | * | Apollo Global Management | New York | 4,258 | $11,627 | Securities | 4th |
38 | 358 | * | Hess | New York | 1,623 | $11,570 | Mining, Crude-Oil Production | 12th |
39 | 366 | * | S&P Global | New York | 39,950 | $11,181 | Financial Data Services | 7th |
40 | 371 | * | Interpublic Group | New York | 58,400 | $10,928 | Advertising, Marketing | 2nd |
41 | 381 | * | News Corp. | New York | 25,500 | $10,385 | Publishing, Printing | 1st |
42 | 397 | * | Altice USA | Long Island City | 11,000 | $9,648 | Telecommunications | 7th |
43 | 417 | * | JetBlue Airways | Long Island City | 18,785 | $9,158 | Airlines | 6th |
44 | 422 | * | PVH | New York | 25,000 | $9,024 | Apparel | 3rd |
45 | 430 | * | Constellation Brands | Victor | 10,000 | $8,821 | Beverages | 4th |
46 | 432 | * | Foot Locker | New York | 31,040 | $8,759 | Specialty Retailers: Apparel | 4th |
47 | 439 | * | M&T Bank | Buffalo | 22,509 | $8,604 | Commercial Banks | 12th |
48 | 444 | * | Blackstone | New York | 4,695 | $8,518 | Diversified Financials | 11th |
49 | 475 | * | ABM Industries | New York | 127,000 | $7,807 | Diversified Outsourcing Services | 4th |
50 | 496 | * | KKR | New York | 4,150 | $7,273 | Securities | 9th |
* = not among Fortune's Global 500 Sources: Fortune , Volume 183, Number 3 (June/July 2023) and Volume 184, Number 1 (August/September 2023); Fortune website; 50pros.com |
Renewable Energy Certificates (RECs), also known as Green tags, Renewable Energy Credits, Renewable Electricity Certificates, or Tradable Renewable Certificates (TRCs), are tradable, non-tangible energy certificates in the United States that represent proof that 1 megawatt-hour (MWh) of electricity was generated from an eligible renewable energy resource and was fed into the shared system of power lines which transport energy. Solar renewable energy certificates (SRECs) are RECs that are specifically generated by solar energy.
NRG Energy, Inc. is an American energy company, headquartered in Houston, Texas. It was formerly the wholesale arm of Northern States Power Company (NSP), which became Xcel Energy, but became independent in 2000. NRG Energy is involved in energy generation and retail electricity. Their portfolio includes natural gas generation, coal generation, oil generation, nuclear generation, wind generation, utility-scale generation, and distributed solar generation. NRG serves over 7 million retail customers in 24 US states including Texas, Connecticut, Delaware, Illinois, Maryland, Massachusetts, New Jersey, New York, Pennsylvania, Ohio; the District of Columbia, and eight provinces in Canada.
Solar power is a major contributor to electricity supply in Australia. As of December 2023, Australia's over 3.69 million solar PV installations had a combined capacity of 34.2 GW photovoltaic (PV) solar power. In 2019, 59 solar PV projects with a combined capacity of 2,881 MW were either under construction, constructed or due to start construction having reached financial closure. Solar accounted for 12.4% of Australia's total electrical energy production in 2021.
Financial incentives for photovoltaics are incentives offered to electricity consumers to install and operate solar-electric generating systems, also known as photovoltaics (PV).
China is the world leader in wind power generation, with the largest installed capacity of any nation and continued rapid growth in new wind facilities. With its large land mass and long coastline, China has exceptional wind power resources: Wind power remained China's third-largest source of electricity at the end of 2021, accounting for 7.5% of total power generation.
Solar power includes solar farms as well as local distributed generation, mostly on rooftops and increasingly from community solar arrays. In 2023, utility-scale solar power generated 164.5 terawatt-hours (TWh), or 3.9% of electricity in the United States. Total solar generation that year, including estimated small-scale photovoltaic generation, was 238 TWh.
New York has 2,192 MW of installed wind power capacity as of 2022. Most of New York's wind power is located in upstate New York as onshore wind farms. New York has set a goal of developing 9,000 MW of offshore installed wind power capacity by 2035 that will power an estimated 6 million homes. As of October 2022, New York has five offshore wind farms in development with approximately 4,300 MW installed capacity.
Renewable energy in Canada represented 17.3% of the Total Energy Supply (TES) in 2020, following natural gas at 39.1% and oil at 32.7% of the TES.
New Jersey has over 4,700 MW of installed solar power capacity as of January 2024, which provides more than 7% of the state's electricity consumption. The's state's growth of solar power is aided by a renewable portfolio standard that requires that 22.5% of New Jersey's electricity come from renewable resources by 2021 and 50% by 2030, by incentives provided for generation of solar power, and by one of the most favorable net metering standards in the country, allowing customers of any size array to use net metering, although generation may not exceed annual demand. As of 2018, New Jersey has the sixth-largest installed solar capacity of all U.S. states and the largest installed solar capacity of the Northeastern States.
In 2019, North Carolina's total gross state product was around $591 billion.
The energy sector in Hawaii has rapidly adopted solar power due to the high costs of electricity, and good solar resources, and has one of the highest per capita rates of solar power in the United States. Hawaii's imported energy costs, mostly for imported petroleum and coal, are three to four times higher than the mainland, so Hawaii has motivation to become one of the highest users of solar energy. Hawaii was the first state in the United States to reach grid parity for photovoltaics. Its tropical location provides abundant ambient energy.
Energy in Malta describes energy production, consumption and import in Malta. Malta has no domestic resource of fossil fuels and no gas distribution network, and relies overwhelmingly on imports of fossil fuels and electricity to cover its energy needs. Since 2015, the Malta–Sicily interconnector allows Malta to be connected to the European power grid and import a significant share of its electricity.
Solar power in Massachusetts has been increasing rapidly, due to Section 1603 grants for installations that began before December 31, 2011, and the sale of SRECs for $0.30/kWh, which allows payback for the system within 5 or 6 years, and generates income for the life of the system. For systems installed after December 31, 2011, and before December 31, 2016, the 30% tax grant becomes a 30% tax credit. There has been an appeal to the Congress to extend the 1603 program, the grant program, for an additional year.
New York has a renewable portfolio standard of 30% from renewable sources by 2015. In 2015 24% was renewable, 6% short of the goal. Wind is the predominant generating technology. In 2018, the New York State Energy Research and Development Authority awarded long-term contracts to 22 utility-scale solar farms, totaling a combined capacity of 646 MW.
Solar power in Georgia on rooftops can provide 31% of all electricity used in Georgia.
Solar power in Maryland is supported by the state's legislation regarding the Renewable Portfolio Standard and Solar Renewable Energy Credit (SREC) program. The target for renewable energy as of 2017 is 20% by 2020, including 2% from solar power.
Solar power in Virginia on rooftops is estimated to be capable of providing 32.4% of electricity used in Virginia using 28,500 MW of solar panels. Installing solar panels provides a 6.8% return on investment in Virginia, and a 5 kW array would return a profit of $16,041 over its 25 year life.
As of 2023, wind power was the top source of energy in New Mexico, with approximately 4,400 megawatts (MW) of electricity generating capacity responsible for 38% of electricity produced that year. Wind power in New Mexico has the potential to generate more than all of the electricity consumed in the state.
The electricity sector in Australia has been historically dominated by coal-fired power stations, but renewables are forming a rapidly growing fraction of supply. In 2021, Australia's electricity production reached 265 TWh, with coal accounting for 52.9% and natural gas for 18.8%. Renewable sources, comprising solar, wind, hydro, and bioenergy with waste, collectively made up 26.7% of the total electricity generation mix.
The Bungala Solar Power Farm is a 220 MW solar power farm in Emeroo and Wami Kata near Port Augusta in South Australia. The first stage was connected to the grid in May 2018, and the second stage was connected to the grid in November 2018. The project gradually reached full power in 2020.
{{cite web}}
: CS1 maint: archived copy as title (link){{cite web}}
: CS1 maint: archived copy as title (link)The New York metro area dwarfs all other cities for economic output by a large margin.
The GDP of the New York City metropolitan area is larger than the country of South Korea...New York City was ranked as the most competitive city in the financial industry for the fifth straight year.