| |||||||||||||||||||||||||||||||
All 100 seats of the Montana House of Representatives 51 seats needed for a majority | |||||||||||||||||||||||||||||||
---|---|---|---|---|---|---|---|---|---|---|---|---|---|---|---|---|---|---|---|---|---|---|---|---|---|---|---|---|---|---|---|
Registered | 694,370 [1] 2.98% | ||||||||||||||||||||||||||||||
Turnout | 74.44% [1] 19.00% | ||||||||||||||||||||||||||||||
| |||||||||||||||||||||||||||||||
|
Elections in Montana |
---|
An election was held on November 8, 2016 to elect all 100 members to Montana's House of Representatives. The election coincided with elections for other offices, including U.S. President, U.S. House of Representatives, Governor and State Senate. The primary election was held on June 7, 2016.
There was no change in the composition of the House with the Republicans winning 59 seats and the Democrats 41 seats.
Statewide results of the 2016 Montana House of Representatives election: [2]
Party | Candi- dates | Votes | Seats | |||||
---|---|---|---|---|---|---|---|---|
No. | % | +/– | No. | +/– | % | |||
Republican Party | 84 | 258,412 | 55.18% | 1.56% | 59 | 59.00% | ||
Democratic Party | 94 | 205,981 | 43.99% | 1.13% | 41 | 41.00% | ||
Independent | 2 | 2,019 | 0.43% | 0.43% | 0 | 0.00% | ||
Libertarian Party | 5 | 1,861 | 0.40% | 0.22% | 0 | 0.00% | ||
Total | 185 | 468,273 | 100.00% | 100 | 100.00% |
Results of the 2016 Montana House of Representatives election by district: [2]
District | Democratic | Republican | Others | Total Votes | Result | |||
---|---|---|---|---|---|---|---|---|
Votes | % | Votes | % | Votes | % | |||
1st district | 1,155 | 27.50% | 3,045 | 72.50% | - | - | 4,200 | Republican Hold |
2nd district | 1,035 | 21.28% | 3,829 | 78.72% | - | - | 4,864 | Republican Hold |
3rd district | 2,474 | 52.90% | 2,203 | 47.10% | - | - | 4,677 | Democratic Hold |
4th district | 1,170 | 22.83% | 3,955 | 77.17% | - | - | 5,125 | Republican Hold |
5th district | 3,257 | 56.74% | 2,483 | 43.26% | - | - | 5,740 | Democratic Hold |
6th district | 1,612 | 28.31% | 3,770 | 66.20% | 313 | 5.50% | 5,695 | Republican Hold |
7th district | 1,392 | 34.83% | 2,604 | 65.17% | - | - | 3,996 | Republican Hold |
8th district | 1,115 | 23.33% | 3,665 | 76.67% | - | - | 4,780 | Republican Hold |
9th district | 1,052 | 27.28% | 2,804 | 72.72% | - | - | 3,856 | Republican Hold |
10th district | - | - | 4,102 | 73.02% | 1,516 | 26.98% | 5,618 | Republican Hold |
11th district | 1,305 | 25.81% | 3,752 | 74.19% | - | - | 5,057 | Republican Hold |
12th district | 1,883 | 35.62% | 3,403 | 64.38% | - | - | 5,286 | Republican Hold |
13th district | 1,293 | 24.70% | 3,942 | 75.30% | - | - | 5,235 | Republican Hold |
14th district | 1,054 | 22.26% | 3,681 | 77.74% | - | - | 4,735 | Republican Hold |
15th district | 2,453 | 100.00% | - | - | - | - | 2,453 | Democratic Hold |
16th district | 2,983 | 100.00% | - | - | - | - | 2,983 | Democratic Hold |
17th district | 1,275 | 25.63% | 3,700 | 74.37% | - | - | 4,975 | Republican Hold |
18th district | - | - | 3,670 | 100.00% | - | - | 3,670 | Republican Hold |
19th district | 1,243 | 27.19% | 3,328 | 72.81% | - | - | 4,571 | Republican Hold |
20th district | 1,625 | 28.97% | 3,985 | 71.03% | - | - | 5,610 | Republican Hold |
21st district | 3,448 | 100.00% | - | - | - | - | 3,448 | Democratic Hold |
22nd district | 1,801 | 46.17% | 2,100 | 53.83% | - | - | 3,901 | Republican GAIN |
23rd district | 1,817 | 50.83% | 1,758 | 49.17% | - | - | 3,575 | Democratic GAIN |
24th district | 2,292 | 58.51% | 1,625 | 41.49% | - | - | 3,917 | Democratic Hold |
25th district | 1,861 | 48.56% | 1,971 | 51.44% | - | - | 3,832 | Republican GAIN |
26th district | 1,375 | 50.78% | 1,333 | 49.22% | - | - | 2,708 | Democratic Hold |
27th district | 1,406 | 28.27% | 3,568 | 71.73% | - | - | 4,974 | Republican Hold |
28th district | 2,231 | 53.45% | 1,943 | 46.55% | - | - | 4,174 | Democratic GAIN |
29th district | 994 | 19.78% | 4,032 | 80.22% | - | - | 5,026 | Republican Hold |
30th district | 1,274 | 24.76% | 3,871 | 75.24% | - | - | 5,145 | Republican Hold |
31st district | 2,608 | 100.00% | - | - | - | - | 2,608 | Democratic Hold |
32nd district | 2,499 | 100.00% | - | - | - | - | 2,499 | Democratic GAIN |
33rd district | 1,058 | 22.90% | 3,562 | 77.10% | - | - | 4,620 | Republican Hold |
34th district | 1,243 | 22.51% | 4,278 | 77.49% | - | - | 5,521 | Republican Hold |
35th district | 882 | 18.74% | 3,825 | 81.26% | - | - | 4,707 | Republican Hold |
36th district | 1,177 | 23.99% | 3,730 | 76.01% | - | - | 4,907 | Republican Hold |
37th district | 834 | 14.72% | 4,831 | 85.28% | - | - | 5,665 | Republican Hold |
38th district | 1,916 | 45.94% | 2,255 | 54.06% | - | - | 4,171 | Republican Hold |
39th district | 922 | 19.09% | 3,908 | 80.91% | - | - | 4,830 | Republican Hold |
40th district | 1,654 | 33.60% | 3,269 | 66.40% | - | - | 4,923 | Republican Hold |
41st district | 2,054 | 100.00% | - | - | - | - | 2,054 | Democratic Hold |
42nd district | 2,496 | 100.00% | - | - | - | - | 2,496 | Democratic Hold |
43rd district | 1,523 | 35.05% | 2,488 | 57.26% | 334 | 7.69% | 4,345 | Republican Hold |
44th district | 1,606 | 37.11% | 2,722 | 62.89% | - | - | 4,328 | Republican Hold |
45th district | 1,453 | 30.54% | 3,305 | 69.46% | - | - | 4,758 | Republican Hold |
46th district | 1,939 | 35.31% | 3,553 | 64.69% | - | - | 5,492 | Republican Hold |
47th district | 2,272 | 58.51% | 1,611 | 41.49% | - | - | 3,883 | Democratic Hold |
48th district | 2,551 | 55.12% | 2,077 | 44.88% | - | - | 4,628 | Democratic Hold |
49th district | 1,856 | 56.72% | 1,416 | 43.28% | - | - | 3,272 | Democratic Hold |
50th district | 2,117 | 55.29% | 1,712 | 44.71% | - | - | 3,829 | Democratic Hold |
51st district | 1,759 | 46.19% | 2,049 | 53.81% | - | - | 3,808 | Republican GAIN |
52nd district | 1,801 | 47.95% | 1,955 | 52.05% | - | - | 3,756 | Republican Hold |
53rd district | 1,543 | 22.83% | 5,216 | 77.17% | - | - | 6,759 | Republican Hold |
54th district | - | - | 4,335 | 100.00% | - | - | 4,335 | Republican Hold |
55th district | 1,149 | 25.33% | 3,387 | 74.67% | - | - | 4,536 | Republican Hold |
56th district | 1,247 | 29.78% | 2,940 | 70.22% | - | - | 4,187 | Republican Hold |
57th district | - | - | 4,247 | 85.03% | 748 | 14.97% | 4,995 | Republican Hold |
58th district | 2,180 | 36.79% | 3,746 | 63.21% | - | - | 5,926 | Republican Hold |
59th district | 1,735 | 29.11% | 4,225 | 70.89% | - | - | 5,960 | Republican Hold |
60th district | 2,858 | 52.30% | 2,607 | 47.70% | - | - | 5,465 | Democratic GAIN |
61st district | 3,787 | 55.06% | 2,804 | 40.77% | 287 | 4.17% | 6,878 | Democratic Hold |
62nd district | 5,251 | 100.00% | - | - | - | - | 5,251 | Democratic Hold |
63rd district | 2,885 | 59.56% | 1,959 | 40.44% | - | - | 4,844 | Democratic Hold |
64th district | 2,510 | 39.32% | 3,873 | 60.68% | - | - | 6,383 | Republican Hold |
65th district | 3,093 | 49.55% | 3,149 | 50.45% | - | - | 6,242 | Republican GAIN |
66th district | 4,425 | 100.00% | - | - | - | - | 4,425 | Democratic Hold |
67th district | 1,491 | 31.19% | 3,290 | 68.81% | - | - | 4,781 | Republican Hold |
68th district | 1,275 | 25.63% | 3,700 | 74.37% | - | - | 4,975 | Republican Hold |
69th district | 1,291 | 23.23% | 4,266 | 76.77% | - | - | 5,557 | Republican Hold |
70th district | 1,793 | 30.75% | 4,038 | 69.25% | - | - | 5,831 | Republican Hold |
71st district | - | - | 5,088 | 100.00% | - | - | 5,088 | Republican Hold |
72nd district | 1,002 | 18.79% | 4,331 | 81.21% | - | - | 5,333 | Republican Hold |
73rd district | 3,950 | 100.00% | - | - | - | - | 3,950 | Democratic Hold |
74th district | 3,461 | 100.00% | - | - | - | - | 3,461 | Democratic Hold |
75th district | 2,390 | 41.36% | 3,389 | 58.64% | - | - | 5,779 | Republican Hold |
76th district | 4,798 | 100.00% | - | - | - | - | 4,798 | Democratic Hold |
77th district | 2,977 | 57.35% | 2,214 | 42.65% | - | - | 5,191 | Democratic Hold |
78th district | 2,153 | 59.94% | 1,439 | 40.06% | - | - | 3,592 | Democratic Hold |
79th district | 4,358 | 100.00% | - | - | - | - | 4,358 | Democratic Hold |
80th district | 1,161 | 20.35% | 4,040 | 70.83% | 503 | 8.82% | 5,704 | Republican Hold |
81st district | 3,933 | 100.00% | - | - | - | - | 3,933 | Democratic Hold |
82nd district | 4,013 | 100.00% | - | - | - | - | 4,013 | Democratic Hold |
83rd district | 2,573 | 54.54% | 2,145 | 45.46% | - | - | 4,718 | Democratic Hold |
84th district | 2,462 | 49.40% | 2,343 | 47.01% | 179 | 3.59% | 4,984 | Democratic Hold |
85th district | 1,593 | 26.94% | 4,321 | 73.06% | - | - | 5,914 | Republican Hold |
86th district | 1,889 | 34.52% | 3,583 | 65.48% | - | - | 5,472 | Republican Hold |
87th district | - | - | 4,487 | 100.00% | - | - | 4,487 | Republican Hold |
88th district | 1,818 | 33.32% | 3,639 | 66.68% | - | - | 5,457 | Republican Hold |
89th district | 2,801 | 59.32% | 1,921 | 40.68% | - | - | 4,722 | Democratic Hold |
90th district | 3,113 | 60.72% | 2,014 | 39.28% | - | - | 5,127 | Democratic Hold |
91st district | 5,142 | 100.00% | - | - | - | - | 5,142 | Democratic Hold |
92nd district | 2,416 | 49.01% | 2,514 | 50.99% | - | - | 4,930 | Republican Hold |
93rd district | 2,392 | 54.33% | 2,011 | 45.67% | - | - | 4,403 | Democratic GAIN |
94th district | 2,703 | 54.50% | 2,257 | 45.50% | - | - | 4,960 | Democratic Hold |
95th district | 3,178 | 74.03% | 1,115 | 25.97% | - | - | 4,293 | Democratic Hold |
96th district | 2,532 | 47.99% | 2,744 | 52.01% | - | - | 5,276 | Republican GAIN |
97th district | 2,096 | 40.32% | 3,103 | 59.68% | - | - | 5,199 | Republican Hold |
98th district | 2,989 | 59.65% | 2,022 | 40.35% | - | - | 5,011 | Democratic Hold |
99th district | 3,101 | 59.69% | 2,094 | 40.31% | - | - | 5,195 | Democratic Hold |
100th district | 4,379 | 79.23% | 1,148 | 20.77% | - | - | 5,527 | Democratic Hold |
Total | 205,981 | 43.99% | 258,412 | 55.18% | 3,880 | 0.83% | 468,273 |
Montana is represented in the United States House of Representatives by one at-large congressional district, among the 435 in the United States Congress. The district is the most populous U.S. congressional district, with just over 1 million constituents. It is also the second-largest by land area, after Alaska's at-large congressional district, and the largest by land area in the contiguous United States.
Matthew Martin Rosendale Sr. is an American politician and businessman from the state of Montana. He is the U.S. Representative for Montana's at-large congressional district in the U.S. House of Representatives, elected in 2020.
The 2014 congressional election in Montana was held on November 4, 2014, to determine who will represent the state of Montana in the United States House of Representatives. Montana has one at-large seat in the House, apportioned according to the 2010 United States Census.
The 2016 United States House of Representatives election in Montana was held on November 8, 2016, to elect the U.S. Representative from Montana's at-large congressional district. The election coincided with the 2016 U.S. presidential election, as well as other elections to the House of Representatives, elections to the United States Senate and various state and local elections.
The 2020 Montana gubernatorial election was held on November 3, 2020, to elect the next governor of Montana, concurrently with the U.S. presidential election, as well as elections to the U.S. Senate and the House of Representatives and various state and local elections. It resulted in voters selecting Greg Gianforte over Mike Cooney. Incumbent Democratic Governor Steve Bullock, who was term-limited and could not seek reelection to a third consecutive term in office, was instead seeking Montana's Class II Senate seat.
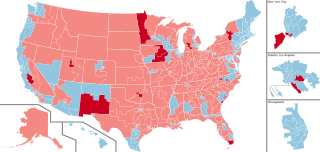
The 2020 United States House of Representatives elections were held on November 3, 2020, to elect representatives from all 435 congressional districts across each of the 50 U.S. states, as well as six non-voting delegates from the District of Columbia and the inhabited U.S. territories. Special House elections were also held on various dates throughout 2020.
In Montana, an at-large congressional district special election was held on May 25, 2017, to determine the member of the United States House of Representatives for Montana's at-large congressional district. The election was necessitated by incumbent Republican Representative Ryan Zinke's appointment as United States Secretary of the Interior. Zinke resigned on March 1, 2017, upon his confirmation.
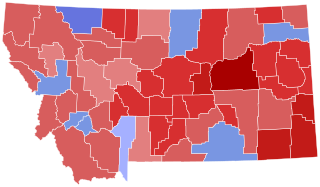
The 2020 United States House of Representatives election in Montana was held on November 3, 2020, to elect the U.S. Representative from Montana's at-large congressional district. The election coincided with the 2020 U.S. presidential election, as well as other elections to the House of Representatives, elections to the United States Senate and various state and local elections.
A general election in the state of Montana was held on Tuesday, November 3, 2020, with the primary elections being held on June 2, 2020. Voters will elect one member to United States House of Representatives and all five state constitutional offices, among other elected offices.
The 2022 United States House of Representatives election in Montana will be held on November 8, 2022, to elect two U.S. Representatives from Montana, one from each of its congressional districts. Prior to this election cycle, Montana had one at-large district, represented by Republican Matt Rosendale. However, during the 2020 redistricting cycle, Montana regained the 2nd district that it lost in 1993. As a result, Montana became the first state relegated from multi-district to at-large status that reclaimed a 2nd representative in the House of Representatives.
The 2020 Montana Secretary of State election was held on November 3, 2020, to elect the secretary of state of the U.S. state of Montana. Incumbent Republican Montana Secretary of State Corey Stapleton was elected in 2016 with 55.5% of the vote. Stapleton has announced he would not seek re-election, instead running unsuccessfully in the Republican primary for the open U.S. House seat in Montana.
An election was held on November 7, 2000 to elect all 100 members to Montana's House of Representatives. The election coincided with elections for other offices, including U.S. President, U.S. Senate, U.S. House of Representatives, Governor and State Senate. The primary election was held on June 6, 2000.
An election was held on November 5, 2002 to elect all 100 members to Montana's House of Representatives. The election coincided with elections for other offices, including U.S. Senate, U.S. House of Representatives and State Senate. The primary election was held on June 4, 2002.
An election was held on November 2, 2004 to elect all 100 members to Montana's House of Representatives. The election coincided with elections for other offices, including U.S. President, U.S. House of Representatives, Governor and State Senate. The primary election was held on June 8, 2004.
An election was held on November 7, 2006 to elect all 100 members to Montana's House of Representatives. The election coincided with elections for other offices, including U.S. Senate, U.S. House of Representatives and State Senate. The primary election was held on June 6, 2006.
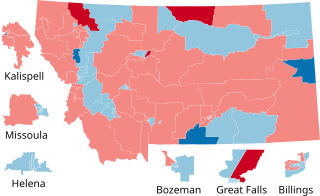
An election was held on November 4, 2008 to elect all 100 members to Montana's House of Representatives. The election coincided with elections for other offices, including U.S. President, U.S. Senate, U.S. House of Representatives, Governor and State Senate. The primary election was held on June 3, 2008.
An election was held on November 2, 2010 to elect all 100 members to Montana's House of Representatives. The election coincided with elections for other offices, including U.S. Senate, U.S. House of Representatives and State Senate. The primary election was held on June 8, 2010.
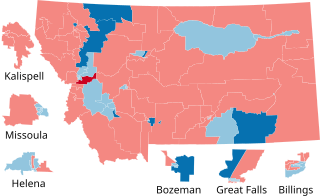
An election was held on November 6, 2012 to elect all 100 members to Montana's House of Representatives. The election coincided with elections for other offices, including U.S. President, U.S. Senate, U.S. House of Representatives, Governor and State Senate. The primary election was held on June 5, 2012.
An election was held on November 4, 2014 to elect all 100 members to Montana's House of Representatives. The election coincided with elections for other offices, including U.S. Senate, U.S. House of Representatives and State Senate. The primary election was held on June 3, 2014.
The 2020 United States Attorney General elections were held on November 3, 2020, in 10 states. The previous Attorney General elections for this group of states took place in 2016, except in Vermont where Attorneys General only serve two-year terms and elected their current Attorney General in 2018. Nine state Attorneys General ran for reelection and eight won, while Republican Tim Fox of Montana could not run again due to term limits and Republican Curtis Hill of Indiana was eliminated in the Republican convention.