This article needs additional citations for verification .(August 2022) |
| |||||||||||||||||||||||||||||||
All 65 seats in the Colorado House of Representatives 33 seats needed for a majority | |||||||||||||||||||||||||||||||
---|---|---|---|---|---|---|---|---|---|---|---|---|---|---|---|---|---|---|---|---|---|---|---|---|---|---|---|---|---|---|---|
| |||||||||||||||||||||||||||||||
Democratic hold Democratic gain Republican hold | |||||||||||||||||||||||||||||||
|
Elections in Colorado |
---|
The 2016 Colorado House of Representatives election was held on Tuesday, November 8, 2016, with the primary election being held on June 28, 2016. Voters in the 65 districts of the Colorado House of Representatives elected their representatives. The elections coincided with the elections for other offices, including for U.S. President and the state senate.
Colorado House of Representatives election, 2016 General election — November 8, 2016 | ||||||
---|---|---|---|---|---|---|
Party | Votes | Percentage | Seats | +/– | Seats contesting | |
Democratic | 1,201,949 | 47.83% | 37 | 3 | 58 | |
Republican | 1,238,154 | 49.27% | 28 | 3 | 59 | |
Libertarian | 51,103 | 2.03% | 0 | 12 | ||
Independent | 20,174 | 0.80% | 0 | 2 | ||
Green | 1,802 | 0.07% | 0 | 1 | ||
Total | 2,513,182 | 100.0% | 65 | − | − |
Seats where the margin of victory was under 10%:
District 1 • District 2 • District 3 • District 4 • District 5 • District 6 • District 7 • District 8 • District 9 • District 10 • District 11 • District 12 • District 13 • District 14 • District 15 • District 16 • District 17 • District 18 • District 19 • District 20 • District 21 • District 22 • District 23 • District 24 • District 25 • District 26 • District 27 • District 28 • District 29 • District 30 • District 31 • District 32 • District 33 • District 34 • District 35 • District 36 • District 37 • District 38 • District 39 • District 40 • District 41 • District 42 • District 43 • District 44 • District 45 • District 46 • District 47 • District 48 • District 49 • District 50 • District 51 • District 52 • District 53 • District 54 • District 55 • District 56 • District 57 • District 58 • District 59 • District 60 • District 61 • District 62 • District 63 • District 64 • District 65 |
Party | Candidate | Votes | % | |
---|---|---|---|---|
Democratic | Susan Lontine (incumbent) | 3,651 | 100.00 | |
Total votes | 3,651 | 100.00 |
Party | Candidate | Votes | % | |
---|---|---|---|---|
Republican | Raymond Garcia | 1,972 | 100.00 | |
Total votes | 1,972 | 100.00 |
Party | Candidate | Votes | % | |
---|---|---|---|---|
Democratic | Susan Lontine (incumbent) | 17,474 | 61.04 | |
Republican | Raymond Garcia | 11,154 | 38.96 | |
Total votes | 28,628 | 100.00 | ||
Democratic hold |
Party | Candidate | Votes | % | |
---|---|---|---|---|
Democratic | Alec Garnett (incumbent) | 6,301 | 100.00 | |
Total votes | 6,301 | 100.00 |
Party | Candidate | Votes | % | |
---|---|---|---|---|
Republican | Raymond Garcia | 1,573 | 100.00 | |
Total votes | 1,573 | 100.00 |
Party | Candidate | Votes | % | |
---|---|---|---|---|
Democratic | Alec Garnett (incumbent) | 34,422 | 73.28 | |
Republican | Paul A. Linton | 12,550 | 26.72 | |
Total votes | 46,972 | 100.00 | ||
Democratic hold |
Party | Candidate | Votes | % | |
---|---|---|---|---|
Democratic | Jeff Bridges | 3,178 | 56.61 | |
Democratic | Meg Froelich | 2,436 | 43.39 | |
Total votes | 5,614 | 100.00 |
Party | Candidate | Votes | % | |
---|---|---|---|---|
Republican | Katy Brown | 3,441 | 73.73 | |
Republican | Rick Gillit | 1,226 | 26.27 | |
Total votes | 4,667 | 100.00 |
Party | Candidate | Votes | % | |
---|---|---|---|---|
Democratic | Jeff Bridges (incumbent) | 22,016 | 52.53 | |
Republican | Katy Brown | 19,892 | 47.47 | |
Total votes | 41,908 | 100.00 | ||
Democratic hold |
Party | Candidate | Votes | % | |
---|---|---|---|---|
Democratic | Dan Pabón (incumbent) | 5,103 | 100.00 | |
Total votes | 5,103 | 100.00 |
Party | Candidate | Votes | % | |
---|---|---|---|---|
Republican | Willie Pinkston | 870 | 100.00 | |
Total votes | 870 | 100.00 |
Party | Candidate | Votes | % | |
---|---|---|---|---|
Democratic | Dan Pabón (incumbent) | 25,224 | 76.90 | |
Republican | Willie Pinkston | 7,577 | 23.10 | |
Total votes | 32,801 | 100.00 | ||
Democratic hold |
Party | Candidate | Votes | % | |
---|---|---|---|---|
Democratic | Crisanta Duran (incumbent) | 4,191 | 100.00 | |
Total votes | 4,191 | 100.00 |
Party | Candidate | Votes | % | |
---|---|---|---|---|
Republican | Ronnie Nelson | 813 | 100.00 | |
Total votes | 813 | 100.00 |
Party | Candidate | Votes | % | |
---|---|---|---|---|
Democratic | Crisanta Duran (incumbent) | 26,130 | 77.31 | |
Republican | Ronnie Nelson | 7,668 | 22.69 | |
Total votes | 33,798 | 100.00 | ||
Democratic hold |
Party | Candidate | Votes | % | |
---|---|---|---|---|
Democratic | Chris Hansen | 5,532 | 59.27 | |
Democratic | Jeff Hart | 3,962 | 41.73 | |
Total votes | 9,494 | 100.00 |
Party | Candidate | Votes | % | |
---|---|---|---|---|
Democratic | Chris Hansen | 32,624 | 100.00 | |
Total votes | 32,624 | 100.0 | ||
Democratic hold |
Party | Candidate | Votes | % | |
---|---|---|---|---|
Democratic | James Rashad Coleman | 2,629 | 41.37 | |
Democratic | Michele Wheeler | 2,546 | 40.06 | |
Democratic | Elet Valentine | 1,180 | 18.57 | |
Total votes | 6,355 | 100.00 |
Party | Candidate | Votes | % | |
---|---|---|---|---|
Democratic | James Rashad Coleman | 28,557 | 100.00 | |
Total votes | 28,557 | 100.00 | ||
Democratic hold |
Party | Candidate | Votes | % | |
---|---|---|---|---|
Democratic | Leslie Herod | 7,113 | 61.01 | |
Democratic | Aaron D. Goldhamer | 4,546 | 38.99 | |
Total votes | 11,659 | 100.00 |
Party | Candidate | Votes | % | |
---|---|---|---|---|
Republican | Evan J. Vanderpool | 842 | 100.00 | |
Total votes | 842 | 100.00 |
Party | Candidate | Votes | % | |
---|---|---|---|---|
Democratic | Leslie Herod | 38,101 | 84.81 | |
Republican | Evan J. Vanderpool | 6,822 | 15.19 | |
Total votes | 44,923 | 100.00 | ||
Democratic hold |
Party | Candidate | Votes | % | |
---|---|---|---|---|
Democratic | Paul Rosenthal (incumbent) | 6,092 | 100.00 | |
Total votes | 6,092 | 100.00 |
Party | Candidate | Votes | % | |
---|---|---|---|---|
Republican | Paul Stevens Martin | 2,511 | 100.00 | |
Total votes | 2,511 | 100.00 |
Party | Candidate | Votes | % | |
---|---|---|---|---|
Democratic | Paul Rosenthal (incumbent) | 25,709 | 65.86 | |
Republican | Paul Stevens Martin | 13,328 | 34.14 | |
Total votes | 39,037 | 100.00 | ||
Democratic hold |
Party | Candidate | Votes | % | |
---|---|---|---|---|
Democratic | Edie Hooton | 4,364 | 51.24 | |
Democratic | Angelique Espinoza | 4,152 | 48.76 | |
Total votes | 8,516 | 100.00 |
Party | Candidate | Votes | % | |
---|---|---|---|---|
Democratic | Edie Hooton | 35,984 | 100.00 | |
Total votes | 35,984 | 100.00 | ||
Democratic hold |
Party | Candidate | Votes | % | |
---|---|---|---|---|
Republican | Corey Piper | 3,607 | 100.00 | |
Total votes | 3,607 | 100.00 |
Party | Candidate | Votes | % | |
---|---|---|---|---|
Democratic | Jonathan Singer (incumbent) | 4,475 | 100.00 | |
Total votes | 4,475 | 100.00 |
Party | Candidate | Votes | % | |
---|---|---|---|---|
Democratic | Jonathan Singer (incumbent) | 25,327 | 60.19 | |
Republican | Corey Piper | 16,749 | 39.81 | |
Total votes | 42,076 | 100.00 | ||
Democratic hold |
Party | Candidate | Votes | % | |
---|---|---|---|---|
Democratic | Mike Foote (incumbent) | 5,688 | 100.00 | |
Total votes | 5,688 | 100.00 |
Party | Candidate | Votes | % | |
---|---|---|---|---|
Republican | Bob Dillon | 3,006 | 100.00 | |
Total votes | 3,006 | 100.00 |
Party | Candidate | Votes | % | |
---|---|---|---|---|
Democratic | Mike Foote (incumbent) | 29,663 | 65.09 | |
Republican | Corey Piper | 15,906 | 34.91 | |
Total votes | 45,569 | 100.00 | ||
Democratic hold |
Party | Candidate | Votes | % | |
---|---|---|---|---|
Democratic | KC Becker (incumbent) | 5,879 | 100.00 | |
Total votes | 5,879 | 100.00 |
Party | Candidate | Votes | % | |
---|---|---|---|---|
Democratic | KC Becker (incumbent) | 34,114 | 100.00 | |
Total votes | 34,114 | 100.00 | ||
Democratic hold |
Party | Candidate | Votes | % | |
---|---|---|---|---|
Republican | Dan Nordberg (incumbent) | 8,247 | 100.00 | |
Total votes | 8,247 | 100.00 |
Party | Candidate | Votes | % | |
---|---|---|---|---|
Republican | Dan Nordberg (incumbent) | 31,766 | 72.45 | |
Democratic | Chris Walters | 12,077 | 27.55 | |
Total votes | 43,843 | 100.0 | ||
Republican hold |
Party | Candidate | Votes | % | |
---|---|---|---|---|
Democratic | Sharon Huff | 1,809 | 100.00 | |
Total votes | 1,809 | 100.00 |
Party | Candidate | Votes | % | |
---|---|---|---|---|
Republican | Dave Williams | 5,855 | 100.00 | |
Total votes | 5,855 | 100.00 |
Party | Candidate | Votes | % | |
---|---|---|---|---|
Republican | Dave Williams | 25,239 | 67.84 | |
Democratic | Sharon Huff | 11,962 | 32.16 | |
Total votes | 37,201 | 100.0 | ||
Republican hold |
Party | Candidate | Votes | % | |
---|---|---|---|---|
Republican | Larry Liston | 5,459 | 60.87 | |
Republican | Janak Joshi | 3,510 | 39.13 | |
Total votes | 8,969 | 100.00 |
Party | Candidate | Votes | % | |
---|---|---|---|---|
Republican | Larry Liston | 26,225 | 71.87 | |
Libertarian | John Hjersman | 10,262 | 28.13 | |
Total votes | 36,487 | 100.00 | ||
Republican hold |
Party | Candidate | Votes | % | |
---|---|---|---|---|
Democratic | Thomas "Tony" Exum, Sr | 2,034 | 100.00 | |
Total votes | 2,034 | 100.00 |
Party | Candidate | Votes | % | |
---|---|---|---|---|
Republican | Kit Roupe (incumbent) | 2,473 | 100.00 | |
Total votes | 2,473 | 100.00 |
Party | Candidate | Votes | % | |
---|---|---|---|---|
Democratic | Thomas "Tony" Exum, Sr | 11,445 | 49.39 | |
Republican | Kit Roupe (incumbent) | 9,613 | 41.48 | |
Libertarian | Susan Quilleash | 2,116 | 9.13 | |
Total votes | 23,174 | 100.00 | ||
Democratic gain from Republican | ||||
Party | Candidate | Votes | % | |
---|---|---|---|---|
Democratic | Pete Lee (incumbent) | 3,940 | 100.00 | |
Total votes | 3,940 | 100.00 |
Party | Candidate | Votes | % | |
---|---|---|---|---|
Republican | Sonya Rose | 4,145 | 100.00 | |
Total votes | 4,145 | 100.00 |
Party | Candidate | Votes | % | |
---|---|---|---|---|
Democratic | Pete Lee (incumbent) | 21,145 | 53.30 | |
Republican | Cameron Forth | 15,556 | 39.21 | |
Libertarian | Norman Dawson | 2,972 | 7.49 | |
Total votes | 39,673 | 100.00 | ||
Democratic hold |
Party | Candidate | Votes | % | |
---|---|---|---|---|
Republican | Paul Lundeen (incumbent) | 10,531 | 100.00 | |
Total votes | 10,531 | 100.00 |
Party | Candidate | Votes | % | |
---|---|---|---|---|
Democratic | Tom Reynolds | 1,681 | 100.00 | |
Total votes | 1,681 | 100.00 |
Party | Candidate | Votes | % | |
---|---|---|---|---|
Republican | Paul Lundeen (incumbent) | 40,011 | 79.59 | |
Democratic | Tom Reynolds | 10,258 | 20.41 | |
Total votes | 50,269 | 100.00 | ||
Republican hold |
Party | Candidate | Votes | % | |
---|---|---|---|---|
Republican | Terri Carver (incumbent) | 8,108 | 100.00 | |
Total votes | 8,108 | 100.00 |
Party | Candidate | Votes | % | |
---|---|---|---|---|
Democratic | Julia Endicott | 2,598 | 100.00 | |
Total votes | 2,598 | 100.00 |
Party | Candidate | Votes | % | |
---|---|---|---|---|
Republican | Terri Carver (incumbent) | 26,517 | 64.05 | |
Democratic | Julia Endicott | 12,461 | 30.10 | |
Libertarian | Judith Darcy | 2,425 | 5.86 | |
Total votes | 41,403 | 100.00 | ||
Republican hold |
Party | Candidate | Votes | % | |
---|---|---|---|---|
Republican | Lois Landgraf (incumbent) | 2,921 | 67.06 | |
Republican | Steve Elisha | 1,435 | 32.94 | |
Total votes | 4,356 | 100.00 |
Party | Candidate | Votes | % | |
---|---|---|---|---|
Republican | Lois Landgraf (incumbent) | 17,358 | 68.71 | |
Libertarian | Michael Seebeck | 7,904 | 31.29 | |
Total votes | 25,262 | 100.0 | ||
Republican hold |
Party | Candidate | Votes | % | |
---|---|---|---|---|
Republican | Justin Everett (incumbent) | 5,375 | 100.00 | |
Total votes | 5,375 | 100.0 |
Party | Candidate | Votes | % | |
---|---|---|---|---|
Republican | Justin Everett (incumbent) | 26,311 | 60.46 | |
Independent | Mary Parker | 17,207 | 39.54 | |
Total votes | 43,518 | 100.00 | ||
Republican hold |
Party | Candidate | Votes | % | |
---|---|---|---|---|
Democratic | Chris Kennedy | 4,291 | 100.0 | |
Total votes | 4,291 | 100.0 |
Party | Candidate | Votes | % | |
---|---|---|---|---|
Republican | Chris Hadsall | 3,954 | 100.0 | |
Total votes | 3,954 | 100.0 |
Party | Candidate | Votes | % | |
---|---|---|---|---|
Democratic | Chris Kennedy | 23,872 | 55.88 | |
Republican | Chris Hadsall | 18,850 | 44.12 | |
Total votes | 42,722 | 100.00 | ||
Democratic hold |
Party | Candidate | Votes | % | |
---|---|---|---|---|
Democratic | Jessie Danielson (Incumbent) | 4,336 | 100.00 | |
Total votes | 4,336 | 100.00 |
Party | Candidate | Votes | % | |
---|---|---|---|---|
Republican | Joy Bowman | 3,861 | 100.00 | |
Total votes | 3,861 | 100.00 |
Party | Candidate | Votes | % | |
---|---|---|---|---|
Democratic | Jessie Danielson (Incumbent) | 24,103 | 56.99 | |
Republican | Joseph DeMott | 18,191 | 43.01 | |
Total votes | 42,294 | 100.0 | ||
Democratic hold |
Party | Candidate | Votes | % | |
---|---|---|---|---|
Democratic | Tammy Story | 3,963 | 100.0 | |
Total votes | 3,963 | 100.0 |
Party | Candidate | Votes | % | |
---|---|---|---|---|
Republican | Tim Leonard (incumbent) | 5,576 | 100.0 | |
Total votes | 5,576 | 100.0 |
Party | Candidate | Votes | % | |
---|---|---|---|---|
Republican | Tim Leonard (incumbent) | 26,232 | 51.83 | |
Democratic | Tammy Story | 24,381 | 48.17 | |
Total votes | 50,613 | 100.00 | ||
Republican hold |
Party | Candidate | Votes | % | |
---|---|---|---|---|
Democratic | Diane Mitsch Bush (Incumbent) | 2,342 | 100.0 | |
Total votes | 2,342 | 100.0 |
Party | Candidate | Votes | % | |
---|---|---|---|---|
Republican | Michael Cacioppo | 1,985 | 100.00 | |
Total votes | 1,985 | 100.00 |
Party | Candidate | Votes | % | |
---|---|---|---|---|
Democratic | Diane Mitsch Bush (Incumbent) | 22,442 | 60.75 | |
Republican | Michael Cacioppo | 14,498 | 39.25 | |
Total votes | 36,940 | 100.00 | ||
Democratic hold |
Party | Candidate | Votes | % | |
---|---|---|---|---|
Democratic | Wade Michael Norris | 4,154 | 100.0 | |
Total votes | 4,154 | 100.0 |
Party | Candidate | Votes | % | |
---|---|---|---|---|
Republican | Lang Sias (incumbent) | 5,810 | 100.00 | |
Total votes | 5,810 | 100.0 |
Party | Candidate | Votes | % | |
---|---|---|---|---|
Republican | Lang Sias (incumbent) | 26,554 | 53.52 | |
Democratic | Wade Michael Norris | 20,098 | 40.51 | |
Independent | Doug Miracle | 2,966 | 5.98 | |
Total votes | 49,618 | 100.00 | ||
Republican hold |
Party | Candidate | Votes | % | |
---|---|---|---|---|
Democratic | Brittany Pettersen (incumbent) | 22,431 | 55.58 | |
Republican | Nancy Pallozzi | 14,522 | 35.99 | |
Libertarian | Matthew Hess | 3,402 | 8.43 | |
Total votes | 40,355 | 100.00 | ||
Democratic hold |
Party | Candidate | Votes | % | |
---|---|---|---|---|
Democratic | Tracy Kraft-Tharp (Incumbent) | 21,701 | 54.56 | |
Republican | Susan Kochevar | 18,072 | 45.44 | |
Total votes | 39,773 | 100.00 | ||
Democratic hold |
Party | Candidate | Votes | % | |
---|---|---|---|---|
Democratic | Dafna Michaelson Jenet | 15,844 | 54.19 | |
Republican | JoAnn Windholz (Incumbent) | 13,395 | 45.81 | |
Total votes | 29,239 | 100.00 | ||
Democratic gain from Republican | ||||
Party | Candidate | Votes | % | |
---|---|---|---|---|
Democratic | Joe Salazar (Incumbent) | 18,452 | 55.39 | |
Republican | Jessica Sandgren | 14,861 | 44.61 | |
Total votes | 33,313 | 100.00 | ||
Democratic hold |
Party | Candidate | Votes | % | |
---|---|---|---|---|
Democratic | Adrienne Benavidez | 15,736 | 64.34 | |
Republican | Alexander D. Jacobson | 8,710 | 35.61 | |
Democratic | Steve Zorn (write-in) | 10 | 0.04 | |
Total votes | 24,456 | 100.00 | ||
Democratic hold |
Party | Candidate | Votes | % | |
---|---|---|---|---|
Democratic | Matt Gray | 25,268 | 52.16 | |
Republican | Karen Nelson | 20,197 | 41.69 | |
Libertarian | Kim Tavendale | 2,982 | 6.16 | |
Total votes | 48,447 | 100.00 | ||
Democratic hold |
Party | Candidate | Votes | % | |
---|---|---|---|---|
Democratic | Steve Lebsock (Incumbent) | 14,865 | 50.00 | |
Republican | Dustin Johnson | 13,061 | 43.94 | |
Green | Jenice "JJ" Dove | 1,802 | 6.06 | |
Total votes | 29,728 | 100.00 | ||
Democratic hold |
Party | Candidate | Votes | % | |
---|---|---|---|---|
Democratic | Faith Winter (Incumbent) | 20,198 | 56.33 | |
Republican | Emily Voss | 15,660 | 43.67 | |
Total votes | 35,858 | 100.00 | ||
Democratic hold |
Party | Candidate | Votes | % | |
---|---|---|---|---|
Democratic | Mike Weissman | 19,423 | 55.29 | |
Republican | Richard J. Bowman | 15,708 | 44.71 | |
Total votes | 35,131 | 100.00 | ||
Democratic hold |
Party | Candidate | Votes | % | |
---|---|---|---|---|
Republican | Cole Wist (incumbent) | 23,518 | 54.65 | |
Democratic | Carol A. Barrett | 19,516 | 45.35 | |
Total votes | 43,034 | 100.00 | ||
Republican hold |
Party | Candidate | Votes | % | |
---|---|---|---|---|
Republican | Susan Beckman | 29,316 | 57.83 | |
Democratic | Robert Bowen | 21,380 | 42.17 | |
Total votes | 50,696 | 100.00 | ||
Republican hold |
Party | Candidate | Votes | % | |
---|---|---|---|---|
Republican | Polly Lawrence (incumbent) | 33,472 | 71.29 | |
Democratic | Richard Opler | 13,478 | 28.71 | |
Total votes | 46,950 | 100.00 | ||
Republican hold |
Party | Candidate | Votes | % | |
---|---|---|---|---|
Democratic | Janet Buckner (Incumbent) | 21,391 | 57.69 | |
Republican | Todd Brophy | 15,691 | 42.31 | |
Total votes | 37,082 | 100.00 | ||
Democratic hold |
Party | Candidate | Votes | % | |
---|---|---|---|---|
Democratic | Jovan Melton (Incumbent) | 20,933 | 60.14 | |
Republican | Linda Garrison | 13,874 | 39.86 | |
Total votes | 34,807 | 100.00 | ||
Democratic hold |
Party | Candidate | Votes | % | |
---|---|---|---|---|
Democratic | Dominique Jackson | 16,103 | 68.91 | |
Republican | Mike Donald | 7,265 | 31.09 | |
Total votes | 23,368 | 100.00 | ||
Democratic hold |
Party | Candidate | Votes | % | |
---|---|---|---|---|
Republican | Kevin Van Winkle (incumbent) | 26,595 | 60.34 | |
Democratic | Scott Wagner | 17,483 | 39.66 | |
Total votes | 44,078 | 100.00 | ||
Republican hold |
Party | Candidate | Votes | % | |
---|---|---|---|---|
Republican | Kim Ransom (incumbent) | 29,710 | 64.64 | |
Democratic | Tim Hicks | 16,250 | 35.36 | |
Total votes | 45,960 | 100.00 | ||
Republican hold |
Party | Candidate | Votes | % | |
---|---|---|---|---|
Republican | Patrick Neville (incumbent) | 35,321 | 70.04 | |
Democratic | Shantell Schweikart | 15,109 | 29.96 | |
Total votes | 50,430 | 100.00 | ||
Republican hold |
Party | Candidate | Votes | % | |
---|---|---|---|---|
Democratic | Daneya Esgar (incumbent) | 29,797 | 100.00 | |
Total votes | 29,797 | 100.00 | ||
Democratic hold |
Party | Candidate | Votes | % | |
---|---|---|---|---|
Republican | Clarice Navarro (incumbent) | 21,714 | 57.74 | |
Democratic | Jason Munoz | 15,891 | 42.26 | |
Total votes | 37,605 | 100.00 | ||
Republican hold |
Party | Candidate | Votes | % | |
---|---|---|---|---|
Republican | Steve Humphrey (incumbent) | 30,417 | 68.22 | |
Democratic | Annie King | 14,168 | 31.78 | |
Total votes | 44,585 | 100.00 | ||
Republican hold |
Party | Candidate | Votes | % | |
---|---|---|---|---|
Republican | Perry L. Buck (incumbent) | 35,412 | 62.54 | |
Democratic | Adrian "Buzz" Sweeney | 21,210 | 37.46 | |
Total votes | 56,622 | 100.00 | ||
Republican hold |
Party | Candidate | Votes | % | |
---|---|---|---|---|
Democratic | Dave Young (incumbent) | 14,803 | 55.48 | |
Republican | John Alan Honeycutt | 10,479 | 39.27 | |
Libertarian | Roy Dakroub | 1,401 | 5.25 | |
Total votes | 26,683 | 100.00 | ||
Democratic hold |
Party | Candidate | Votes | % | |
---|---|---|---|---|
Republican | Hugh McKean | 28,823 | 60.72 | |
Democratic | Jody Shadduck-McNally | 18,642 | 39.28 | |
Total votes | 47,465 | 100.00 | ||
Republican hold |
Party | Candidate | Votes | % | |
---|---|---|---|---|
Democratic | Joann Ginal (Incumbent) | 25,876 | 54.70 | |
Republican | Donna Walter | 21,428 | 45.30 | |
Total votes | 47,304 | 100.00 | ||
Democratic hold |
Party | Candidate | Votes | % | |
---|---|---|---|---|
Democratic | Jeni Arndt (incumbent) | 30,594 | 100.00 | |
Total votes | 30,594 | 100.00 | ||
Democratic hold |
Party | Candidate | Votes | % | |
---|---|---|---|---|
Republican | Yeulin Willett | 28,790 | 77.08 | |
Libertarian | Gilbert Fuller | 8,563 | 22.92 | |
Total votes | 37,353 | 100.00 | ||
Republican hold |
Party | Candidate | Votes | % | |
---|---|---|---|---|
Republican | Dan Thurlow (incumbent) | 31,732 | 100.00 | |
Total votes | 31,732 | 100.00 | ||
Republican hold |
Party | Candidate | Votes | % | |
---|---|---|---|---|
Republican | Philip Covarrubias | 26,858 | 58.60 | |
Democratic | Matt Snider | 16,228 | 35.41 | |
Libertarian | Glenn Ingalls | 2,747 | 5.99 | |
Total votes | 45,833 | 100.00 | ||
Republican hold |
Party | Candidate | Votes | % | |
---|---|---|---|---|
Republican | Bob Rankin (incumbent) | 26,002 | 100.00 | |
Total votes | 26,002 | 100.00 | ||
Republican hold |
Party | Candidate | Votes | % | |
---|---|---|---|---|
Republican | Don Coram (incumbent) | 28,195 | 100.00 | |
Total votes | 28,195 | 100.00 | ||
Republican hold |
Party | Candidate | Votes | % | |
---|---|---|---|---|
Democratic | Barbara Hall McLachlan | 23,336 | 50.73 | |
Republican | J. Paul Brown (Incumbent) | 22,661 | 49.27 | |
Total votes | 45,997 | 100.00 | ||
Democratic gain from Republican | ||||
Party | Candidate | Votes | % | |
---|---|---|---|---|
Republican | James Wilson (incumbent) | 26,246 | 63.55 | |
Democratic | David Higginbotham | 12,406 | 30.04 | |
Libertarian | Glenn Ingalls | 2,651 | 6.42 | |
Total votes | 41,303 | 100.00 | ||
Republican hold |
Party | Candidate | Votes | % | |
---|---|---|---|---|
Democratic | Millie Hamner (Incumbent) | 24,562 | 56.12 | |
Republican | Bob Schutt | 19,208 | 39.25 | |
Total votes | 43,770 | 100.00 | ||
Democratic hold |
Party | Candidate | Votes | % | |
---|---|---|---|---|
Democratic | Donald Valdez | 19,720 | 55.51 | |
Republican | Bob Mattive | 15,805 | 44.49 | |
Total votes | 35,525 | 100.00 | ||
Democratic hold |
Party | Candidate | Votes | % | |
---|---|---|---|---|
Republican | Lori Saine (incumbent) | 26,952 | 60.87 | |
Democratic | Thomas A. Hudson | 13,651 | 30.83 | |
Libertarian | Joe Johnson | 3,678 | 8.31 | |
Total votes | 44,281 | 100.00 | ||
Republican hold |
Party | Candidate | Votes | % | |
---|---|---|---|---|
Republican | Kimmi Lewis | 27,952 | 75.42 | |
Democratic | Kathleen J. Conway | 9,108 | 24.58 | |
Total votes | 37,060 | 100.00 | ||
Republican hold |
Party | Candidate | Votes | % | |
---|---|---|---|---|
Democratic | Anthony Engelhaupt | 1,939 | 100.0 | |
Total votes | 1,939 | 100.0 |
Party | Candidate | Votes | % | |
---|---|---|---|---|
Republican | Jon Becker (incumbent) | 7,674 | 100.00 | |
Total votes | 7,674 | 100.0 |
Party | Candidate | Votes | % | |
---|---|---|---|---|
Republican | Jon Becker (incumbent) | 25,965 | 79.25 | |
Democratic | Anthony Engelhaupt | 6,797 | 20.75 | |
Total votes | 32,762 | 100.00 | ||
Republican hold |
The United States Marijuana Party is a cannabis political party in the United States founded in 2002 by Loretta Nall specifically to end the war on drugs and to legalize cannabis. Their policies also include other socially libertarian positions. U.S. Marijuana Party candidates in Vermont have run campaigns as recently as 2016. The party has had local chapters in several other states, and has been affiliated with international cannabis political parties.
Pete Lee is a legislator in the U.S. state of Colorado. A Democrat, Lee was elected in 2018 to the 11th district of the Colorado Senate. Lee is a former member of the Colorado House of Representatives, elected in 2010 to House District 18, which includes central Colorado Springs and Manitou Springs in El Paso County.
Don Coram is an American politician serving as a member of the Colorado Senate. He represents District 6, comprising the counties of: Archuleta, Dolores, La Plata, Montezuma, Montrose, Ouray, San Juan, and San Miguel. Previously, he served in the Colorado House of Representatives representing District 58 from January 2011 to January 2017. In 2022, Coram ran against Lauren Boebert in the Republican primary for the 3rd Congressional district in Colorado. On June 28, 2022, Boebert defeated Coram by 31 points.
Nancy Janann Todd is an American politician and a former Democratic member of the Colorado Senate. In the state senate, she represented District 28 from January 2013 to 2021. Previously, from January 2005 to January 9, 2013, Todd served in the Colorado House of Representatives, representing District 41.
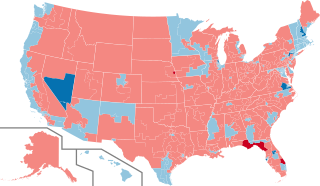
The 2020 United States Senate elections were held on November 3, 2020, with the 33 class 2 seats of the Senate contested in regular elections. Of these, 21 were held by Republicans, and 12 by Democrats. The winners were elected to six-year terms from January 3, 2021, to January 3, 2027. Two special elections for seats held by Republicans were also held in conjunction with the general elections: one in Arizona, to fill the vacancy created by John McCain's death in 2018; and one in Georgia, following Johnny Isakson's resignation in 2019. These elections ran concurrently with the 2020 United States presidential election in which incumbent Republican president Donald Trump lost to Democratic nominee Joe Biden.
The 2018 United States House of Representatives elections were held on November 6, 2018, as part of the 2018 midterm elections during President Donald Trump's term, with early voting taking place in some states in the weeks preceding that date. Voters chose representatives from all 435 congressional districts across each of the 50 U.S. states. Non-voting delegates from the District of Columbia and four of the five inhabited U.S. territories were also elected. On Election Day, Republicans had held a House majority since January 2011.
The 2022 United States Senate election in Colorado was held on November 8, 2022, to elect a member of the United States Senate to represent the State of Colorado. Incumbent Democratic Senator Michael Bennet won reelection to a third full term, defeating Republican businessman Joe O'Dea. Originally appointed to the seat in 2009, Bennet won a full term in 2010 and a second full term in 2016.
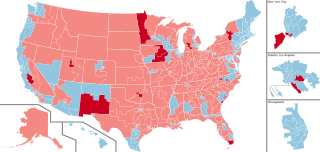
The 2020 United States House of Representatives elections were held on November 3, 2020, to elect representatives from all 435 congressional districts across each of the 50 U.S. states, as well as six non-voting delegates from the District of Columbia and the inhabited U.S. territories. Special House elections were also held on various dates throughout 2020.
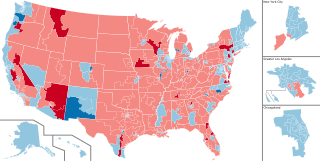
The 2022 United States House of Representatives elections were held on November 8, 2022, as part of the 2022 United States elections during incumbent president Joe Biden's term. The elections were held to elect representatives from all 435 U.S. congressional districts across each of the 50 states, as well as five non-voting members of the U.S. House of Representatives from the District of Columbia and four of the five inhabited insular areas. Numerous other federal, state, and local elections, including the 2022 U.S. Senate elections, were also held on the same date. At the time of the election, the Democratic Party had held a majority in the House since January 3, 2019, as a result of the 2018 elections, when they won 235 seats; their majority was reduced to 222 seats in 2020.
Dave Williams is an American far-right politician from Colorado Springs, Colorado. A Republican, Williams represents Colorado House of Representatives District 15, which encompasses Colorado Springs and Cimarron Hills in El Paso County.
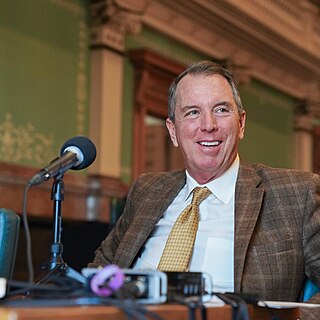
Paul Lundeen is a Colorado politician and a member of the Colorado State Senate, representing District 9. Previously he served in the Colorado House of Representatives as the representative from the 19th District, which encompassed portions of El Paso County, including the communities of Black Forest, Calhan, Ellicott, Gleneagle, Monument, Peyton, Ramah, and Woodmoor.
The 2018 Texas House of Representatives elections took place as part of the biennial United States elections. Texas voters elected state representatives in all 150 of the state house's districts. State representatives serve two-year terms in the Texas State House. A statewide map of Texas' state House districts can be obtained from the Texas Legislative Council here, and individual district maps can be obtained from the U.S. Census here.
The 2018 Georgia House of Representatives elections took place as part of the biennial United States elections. Georgia voters elected state representatives in all 180 of the state house's districts. State representatives serve two-year terms in the Georgia House of Representatives.
The 2018 Colorado House of Representatives elections took place as part of the biennial United States elections. Colorado voters elected state representatives in all 65 of the state house's districts. State representatives serve two-year terms in the Colorado House of Representatives. The Colorado Reapportionment Commission provides a statewide map of the state House here, and individual district maps are available from the U.S. Census here.
The 2016 Colorado State Senate elections were held on November 8, 2016 to elect 18 of the 35 members of Colorado's Senate. The election coincided with elections for other offices, including U.S. President, U.S. Senate, U.S. House of Representatives and state senate. The primary election was held on June 28, 2016.
The 2020 United States House of Representatives elections in Colorado was held on November 3, 2020, to elect the seven U.S. representatives from the state of Colorado, one from each of the state's seven congressional districts. The elections coincided with the 2020 U.S. presidential election, as well as other elections to the House of Representatives, elections to the United States Senate and various state and local elections.
The 2020 Colorado House of Representatives elections took place on November 3, 2020, with the primary elections held on June 30, 2020. Voters in all 65 districts of the state House elected their representative for a two-year term. It coincided with the state Senate elections and the biennial United States elections. The Democratic Party retained control of the House of Representatives. The Democrats gained the 38th District while the Republicans gained the 47th District, resulting in no net seat change.
The 2022 United States House of Representatives elections in Colorado were held on November 8, 2022, to elect the eight U.S. representatives from the state of Colorado, one from each of the state's eight congressional districts. The elections coincided with the Colorado gubernatorial election, as well as other elections to the U.S. House of Representatives, elections to the U.S. Senate, and various state and local elections.
Mary Bradfield is a state representative from Colorado Springs, Colorado. A Republican, Bradfield represents Colorado House of Representatives District 21, which includes portions of El Paso County, including the communities of Fort Carson, Fountain, Rock Creek Park, and Security-Widefield.
The 2022 Colorado House of Representatives elections took place on November 8, 2022, with the primary elections being held on June 28, 2022. Voters in all 65 districts of the state House elected their representative for a two-year term. It coincided with other Colorado elections of the same year and the biennial United States elections.