| ||||||||||||||||||||||||||||
26 seats of the Washington State Senate 25 seats needed for a majority | ||||||||||||||||||||||||||||
---|---|---|---|---|---|---|---|---|---|---|---|---|---|---|---|---|---|---|---|---|---|---|---|---|---|---|---|---|
| ||||||||||||||||||||||||||||
Results: Democratic gain Republican hold Democratic hold No election | ||||||||||||||||||||||||||||
|
Elections in Washington |
---|
The 2016 Washington State Senate elections is one of the biennial legislative elections in Washington in which about half of the state's 49 legislative districts choose a state senator for a four-year term to the Washington State Senate. The other half of state senators are chosen in the next biennial election, so that about half of the senators, along with all the members of the Washington State House of Representatives, are elected every two years. 25 seats are regularly scheduled to be up this cycle, along with 1 additional seat holding a special election to fill an unexpired term: the 36th district, currently held by appointed Senator Reuven Carlyle, whose former incumbent Jeanne Kohl-Welles vacated the seat.
A top two primary election on August 9, 2016 determines which candidates appear on the November ballot. Candidates were allowed to declare a party preference. [1] The general election took place on November 8, 2016. [2]
The 2016 Election maintained effective Republican control of the Senate, because self-identified Democrat Tim Sheldon caucuses with the Republicans.
Washington State Senate election, 2016 | |||||
---|---|---|---|---|---|
Party | Votes | Percentage | Seats | +/– | |
Republican | 787,912 | 50.86% | 25 [lower-alpha 2] | 1 | |
Democratic | 709,898 | 45.82% | 24 | 1 | |
Libertarian | 28,405 | 1.83% | 0 | 0 | |
Independent | 22,986 | 1.48% | 0 | 0 | |
Totals | 1,549,201 | 100.0% | 49 | — |
Races by type | Seats | |
Democratic Incumbent uncontested | 5 | |
Democratic Incumbent vs. Democrat | 0 | |
Democratic Incumbent vs. Republican | 5 | |
Contested, Open Seats [lower-alpha 3] | 6 | |
Republican Incumbent vs. Democrat | 5 | |
Republican Incumbent vs. Republican | 0 | |
Republican Incumbent uncontested | 5 | |
District 1 • District 2 • District 3 • District 4 • District 5 • District 9 • District 10 • District 11 • District 12 • District 14 • District 16 • District 17 • District 18 • District 19 • District 20 • District 22 • District 23 • District 24 • District 25 • District 27 • District 28 • District 36 • District 39 • District 40 • District 41 • District 49 |
Primary election | ||||
---|---|---|---|---|
Party | Candidate | Votes | % | |
Republican | Mindie Wirth | 11,959 | 40.0 | |
Democratic | Guy Palumbo | 9,369 | 31.3 | |
Democratic | Luis Moscoso | 8,568 | 28.7 | |
Total votes | 29,896 | 100.0 | ||
General election | ||||
Democratic | Guy Palumbo | 40,758 | 56.9 | |
Republican | Mindie Wirth | 30,850 | 43.1 | |
Total votes | 71,608 | 100.0 | ||
Democratic hold | ||||
Primary election | ||||
---|---|---|---|---|
Party | Candidate | Votes | % | |
Republican | Randi Becker (incumbent) | 14,103 | 58.1 | |
Democratic | Marilyn Rasmussen | 6,517 | 26.8 | |
Democratic | Tamborine Borrelli | 3,680 | 15.1 | |
Total votes | 24,300 | 100.0 | ||
General election | ||||
Republican | Randi Becker (incumbent) | 36,739 | 61.3 | |
Democratic | Marilyn Rasmussen | 23,149 | 38.7 | |
Total votes | 59,888 | 100.0 | ||
Republican hold | ||||
Primary election | ||||
---|---|---|---|---|
Party | Candidate | Votes | % | |
Democratic | Andy Billig (incumbent) | 14,751 | 73.1 | |
Libertarian | James R. Apker | 5,428 | 26.9 | |
Total votes | 20,179 | 100.0 | ||
General election | ||||
Democratic | Andy Billig (incumbent) | 33,777 | 67.3 | |
Libertarian | James R. Apker | 16,395 | 32.7 | |
Total votes | 50,172 | 100.0 | ||
Democratic hold | ||||
Primary election | ||||
---|---|---|---|---|
Party | Candidate | Votes | % | |
Republican | Mike Padden (incumbent) | 21,255 | 100.0 | |
General election | ||||
Republican | Mike Padden (incumbent) | 55,715 | 100.0 | |
Republican hold | ||||
Primary election | ||||
---|---|---|---|---|
Party | Candidate | Votes | % | |
Democratic | Mark Mullet (incumbent) | 15,199 | 50.7 | |
Republican | Chad Magendanz | 14,787 | 49.3 | |
Total votes | 29,986 | 100.0 | ||
General election | ||||
Democratic | Mark Mullet (incumbent) | 37,342 | 50.3 | |
Republican | Chad Magendanz | 36,826 | 49.7 | |
Total votes | 74,168 | 100.0 | ||
Democratic hold | ||||
Primary election | ||||
---|---|---|---|---|
Party | Candidate | Votes | % | |
Republican | Mark Schoesler (incumbent) | 16,271 | 100.0 | |
General election | ||||
Republican | Mark Schoesler (incumbent) | 41,951 | 100.0 | |
Republican hold | ||||
Primary election | ||||
---|---|---|---|---|
Party | Candidate | Votes | % | |
Republican | Barbara Bailey (incumbent) | 18,860 | 51.5 | |
Democratic | Angie Homola | 13,928 | 38.0 | |
Democratic | Nick Petrish | 3,851 | 10.5 | |
Total votes | 36,639 | 100.0 | ||
General election | ||||
Republican | Barbara Bailey (incumbent) | 42,309 | 56.7 | |
Democratic | Angie Homola | 32,309 | 43.3 | |
Total votes | 74,618 | 100.0 | ||
Republican hold | ||||
Primary election | ||||
---|---|---|---|---|
Party | Candidate | Votes | % | |
Democratic | Bob Hasegawa (incumbent) | 15,283 | 79.0 | |
Libertarian | Dennis Price | 4,058 | 21.0 | |
Total votes | 19,341 | 100.0 | ||
General election | ||||
Democratic | Bob Hasegawa (incumbent) | 38,785 | 76.4 | |
Libertarian | Dennis Price | 12,010 | 23.6 | |
Total votes | 50,795 | 100.0 | ||
Democratic hold | ||||
Primary election | ||||
---|---|---|---|---|
Party | Candidate | Votes | % | |
Republican | Brad Hawkins | 16,723 | 66.2 | |
Republican | Jon Wyss | 8,538 | 33.8 | |
Total votes | 25,261 | 100.0 | ||
General election | ||||
Republican | Brad Hawkins | 30,882 | 56.0 | |
Republican | Jon Wyss | 24,258 | 44.0 | |
Total votes | 55,140 | 100.0 | ||
Republican hold | ||||
Primary election | ||||
---|---|---|---|---|
Party | Candidate | Votes | % | |
Republican | Curtis King (incumbent) | 14,153 | 69.8 | |
Republican | Amanda Richards | 6,132 | 30.2 | |
Total votes | 20,285 | 100.0 | ||
General election | ||||
Republican | Curtis King (incumbent) | 31,156 | 61.0 | |
Republican | Amanda Richards [lower-alpha 4] | 19,900 | 39.0 | |
Total votes | 51,056 | 100.0 | ||
Republican hold | ||||
Primary election | ||||
---|---|---|---|---|
Party | Candidate | Votes | % | |
Republican | Maureen Walsh | 16,044 | 100.0 | |
General election | ||||
Republican | Maureen Walsh | 40,354 | 100.0 | |
Republican hold | ||||
Primary election | ||||
---|---|---|---|---|
Party | Candidate | Votes | % | |
Republican | Lynda Wilson | 11,603 | 50.1 | |
Democratic | Tim Probst | 11,553 | 49.9 | |
Total votes | 23,156 | 100.0 | ||
General election | ||||
Republican | Lynda Wilson | 32,766 | 55.1 | |
Democratic | Tim Probst [lower-alpha 5] | 26,686 | 44.9 | |
Total votes | 59,452 | 100.0 | ||
Republican hold | ||||
Primary election | ||||
---|---|---|---|---|
Party | Candidate | Votes | % | |
Republican | Ann Rivers (incumbent) | 16,717 | 60.2 | |
Democratic | Eric K. Holt | 11,029 | 37.8 | |
Total votes | 24,300 | 100.0 | ||
General election | ||||
Republican | Ann Rivers (incumbent) | 45,316 | 63.8 | |
Democratic | Eric K. Holt | 25,699 | 36.2 | |
Total votes | 71,015 | 100.0 | ||
Republican hold | ||||
Primary election | ||||
---|---|---|---|---|
Party | Candidate | Votes | % | |
Democratic | Dean Takko (incumbent) | 14,848 | 57.7 | |
Republican | Sue Kuehl Pederson | 10,909 | 42.3 | |
Total votes | 25,757 | 100.0 | ||
General election | ||||
Democratic | Dean Takko (incumbent) | 30,850 | 55.2 | |
Republican | Sue Kuehl Pederson [lower-alpha 6] | 25,064 | 44.8 | |
Total votes | 55,914 | 100.0 | ||
Democratic hold | ||||
Primary election | ||||
---|---|---|---|---|
Party | Candidate | Votes | % | |
Republican | John E. Braun (incumbent) | 20,063 | 100.0 | |
General election | ||||
Republican | John E. Braun (incumbent) | 49,936 | 100.0 | |
Republican hold | ||||
Primary election | ||||
---|---|---|---|---|
Party | Candidate | Votes | % | |
Democratic | Sam Hunt | 17,992 | 55.4 | |
Independent | Steve Owens | 6,934 | 21.4 | |
Democratic | Erik Lee | 4,872 | 15.0 | |
Democratic | Spencer Baldwin | 2,662 | 8.2 | |
Total votes | 32,460 | 100.0 | ||
General election | ||||
Democratic | Sam Hunt | 45,882 | 66.6 | |
Independent | Steve Owens | 22,986 | 33.4 | |
Total votes | 68,868 | 100.0 | ||
Democratic hold | ||||
Primary election | ||||
---|---|---|---|---|
Party | Candidate | Votes | % | |
Democratic | Christine Rolfes (incumbent) | 22,794 | 100.0 | |
General election | ||||
Democratic | Christine Rolfes (incumbent) | 51,541 | 100.0 | |
Democratic hold | ||||
Primary election | ||||
---|---|---|---|---|
Party | Candidate | Votes | % | |
Democratic | Kevin Van De Wege | 21,700 | 60.8 | |
Republican | Danille Turissini | 14,016 | 39.2 | |
Total votes | 35,716 | 100.0 | ||
General election | ||||
Democratic | Kevin Van De Wege | 40,808 | 56.6 | |
Republican | Danille Turissini [lower-alpha 7] | 31,342 | 43.4 | |
Total votes | 72,150 | 100.0 | ||
Democratic hold | ||||
Primary election | ||||
---|---|---|---|---|
Party | Candidate | Votes | % | |
Republican | Hans Zeiger | 14,492 | 59.4 | |
Democratic | Karl Mecklenburg | 9,912 | 40.6 | |
Total votes | 24,404 | 100.0 | ||
General election | ||||
Republican | Hans Zeiger | 35,138 | 59.3 | |
Democratic | Karl Mecklenburg | 24,088 | 40.7 | |
Total votes | 59,226 | 100.0 | ||
Republican hold | ||||
Primary election | ||||
---|---|---|---|---|
Party | Candidate | Votes | % | |
Democratic | Jeannie Darneille (incumbent) | 15,141 | 62.1 | |
Republican | Greg Taylor | 6,356 | 26.1 | |
Democratic | Martin Cline | 2,882 | 11.8 | |
Total votes | 24,379 | 100.0 | ||
General election | ||||
Democratic | Jeannie Darneille (incumbent) | 40,241 | 69.3 | |
Republican | Greg Taylor | 17,859 | 30.7 | |
Total votes | 58,100 | 100.0 | ||
Democratic hold | ||||
Primary election | ||||
---|---|---|---|---|
Party | Candidate | Votes | % | |
Republican | Steve O'Ban (incumbent) | 14,229 | 53.6 | |
Democratic | Marisa Peloquin | 12,309 | 46.4 | |
Total votes | 26,538 | 100.0 | ||
General election | ||||
Republican | Steve O'Ban (incumbent) | 30,139 | 52.9 | |
Democratic | Marisa Peloquin | 26,835 | 47.1 | |
Total votes | 56,974 | 100.0 | ||
Republican hold | ||||
Primary election | ||||
---|---|---|---|---|
Party | Candidate | Votes | % | |
Democratic | Reuven Carlyle (incumbent) | 34,600 | 100.0 | |
General election | ||||
Democratic | Reuven Carlyle (incumbent) | 72,385 | 100.0 | |
Democratic hold | ||||
Primary election | ||||
---|---|---|---|---|
Party | Candidate | Votes | % | |
Republican | Kirk Pearson (incumbent) | 19,810 | 100.0 | |
General election | ||||
Republican | Kirk Pearson (incumbent) | 50,942 | 100.0 | |
Republican hold | ||||
Primary election | ||||
---|---|---|---|---|
Party | Candidate | Votes | % | |
Democratic | Kevin Ranker (incumbent) | 21,404 | 67.4 | |
Republican | Daniel R. Miller | 10,377 | 32.6 | |
Total votes | 31,781 | 100.0 | ||
General election | ||||
Democratic | Kevin Ranker (incumbent) | 47,108 | 67.1 | |
Republican | Daniel R. Miller | 23,081 | 32.9 | |
Total votes | 70,189 | 100.0 | ||
Democratic hold | ||||
Primary election | ||||||
---|---|---|---|---|---|---|
Party | Candidate | Votes | % | |||
Democratic | Lisa Wellman | 14,800 | 48.8 | |||
Republican | Steve Litzow (incumbent) | 14,344 | 47.3 | |||
Libertarian | Bryan Simonson | 1,189 | 3.9 | |||
Total votes | 30,333 | 100.0 | ||||
General election | ||||||
Democratic | Lisa Wellman | 37,107 | 51.9 | |||
Republican | Steve Litzow (incumbent) | 34,446 | 48.1 | |||
Total votes | 71,553 | 100.0 | ||||
Democratic gain from Republican | ||||||
Primary election | ||||
---|---|---|---|---|
Party | Candidate | Votes | % | |
Democratic | Annette Cleveland (incumbent) | 12,581 | 56.9 | |
Republican | Lewis Gerhardt | 6,980 | 31.5 | |
Democratic | Vaughn Gregor Henderson | 1,366 | 6.2 | |
Independent | Justin M. Forsman | 1,194 | 5.4 | |
Total votes | 22,121 | 100.0 | ||
General election | ||||
Democratic | Annette Cleveland (incumbent) | 34,548 | 62.3 | |
Republican | Lewis Gerhardt | 20,943 | 37.7 | |
Total votes | 55,491 | 100.0 | ||
Democratic hold | ||||
The Kansas Republican Party is the state affiliate political party in Kansas of the United States Republican Party. The Kansas Republican Party was organized in May 1859.
Oregon's 2006 statewide election included a May 16 primary election and a November 7 general election.
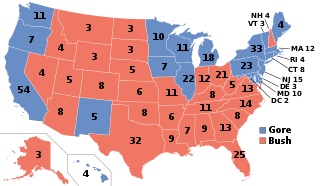
The 1880–81 United States Senate elections were held on various dates in various states, coinciding with the presidential election of 1880. As these U.S. Senate elections were prior to the ratification of the Seventeenth Amendment in 1913, senators were chosen by state legislatures. Senators were elected over a wide range of time throughout 1880 and 1881, and a seat may have been filled months late or remained vacant due to legislative deadlock. In these elections, terms were up for the senators in Class 1.
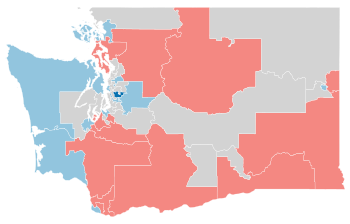
The 2012 Washington State Senate elections took place on November 6, 2012. Twenty-five of Washington's forty-nine state senators were elected. Each state legislative district has one senator elected to a four-year term, but state senate elections alternate so that about half of the senators are elected in presidential election years and the other half are elected in non-presidential even numbered election years. A top two primary election on August 7, 2012 determined which candidates appear on the November ballot. Candidates were allowed to self-declare a party preference.
The 2014 Washington State Senate elections is one of the biennial legislative elections in Washington took place on November 4, 2014. In this election, about half of the 49 legislative districts in Washington chose a state senator for a four-year term to the Washington State Senate. The other half of state senators were chosen in the next biennial election, so that about half of the senators are elected at a time: one group in presidential election years and the other in other even-numbered election years. All the members of the Washington State House of Representatives are elected concurrently with half of the senators every two years.
The 2018 United States Senate elections were held on November 6, 2018. Among the 100 seats, the 33 of Class 1 were contested in regular elections while 2 others were contested in special elections due to Senate vacancies in Minnesota and Mississippi. The winners were elected to 6-year terms running from January 3, 2019, to January 3, 2025. Senate Democrats had 26 seats up for election, while Senate Republicans had 9 seats up for election.
The 2016 United States elections were held on Tuesday, November 8, 2016. Republican nominee Donald Trump defeated Democratic former Secretary of State Hillary Clinton in the presidential election, while Republicans retained control of Congress. This marked the first and most recent time Republicans won or held unified control of the presidency and Congress since 2004.
The Washington State House elections, 2016 are biennial elections in which each of the 49 legislative districts in Washington choose two people to represent them in the Washington State House of Representatives. Roughly half of the members of the Washington Senate are elected concurrently to four-year terms from identical legislative districts. The election was held on November 8, 2016.
The 2020 United States Senate elections were held on November 3, 2020, with the 33 class 2 seats of the Senate contested in regular elections. Of these, 21 were held by Republicans, and 12 by Democrats. The winners were elected to 6-year terms from January 3, 2021, to January 3, 2027. Two special elections for seats held by Republicans were also held in conjunction with the general elections: one in Arizona, to fill the vacancy created by John McCain's death in 2018; and one in Georgia, following Johnny Isakson's resignation in 2019. These elections ran concurrently with the 2020 United States presidential election in which incumbent President Donald Trump lost to Democratic nominee Joe Biden.
The 2022 United States Senate elections were held on November 8, 2022, concurrently with the midterm elections at the federal, state and local level, including the 2022 U.S. House of Representatives elections. Regularly scheduled elections were held for 34 of the 100 seats in the U.S. Senate, the winners of which will serve six-year terms in the U.S. Congress from January 3, 2023, to January 3, 2029, starting with the 118th United States Congress. One special election was also held to complete an unexpired term ending January 3, 2027. While pundits considered the Republican Party a slight favorite to gain control of the Senate, the Democratic Party outperformed expectations and expanded the majority they had held since 2021.
The 2018 Washington State Senate elections took place as part of the biennial United States elections. Washington state voters elected state senators in 25 of the state's 49 Senate districts. The other 24 state senators were not up for re-election until the next biennial election in 2020. State senators serve four-year terms in the Washington State Senate. A statewide map of Washington's state legislative districts is provided by the Washington State Legislature here, Archived 2018-10-24 at the Wayback Machine.
The 2018 Colorado State Senate elections took place as part of the biennial United States elections. Colorado voters elected state senators in 17 of the 35 districts in the state senate. State senators serve four-year terms in the Colorado State Senate. The Colorado Reapportionment Commission provides a statewide map of the state Senate here, and individual district maps are available from the U.S. Census here.
The 2018 Nebraska State Legislature elections took place as part of the biennial United States elections. Nebraska voters elected state senators in the 24 even-numbered seats of the 49 legislative districts in the Nebraska Unicameral. Nebraska is unique among American| states in that there is only one chamber in its state legislature, and this chamber is called the Unicameral and the State Legislature interchangeably. State senators serve four-year terms in the Nebraska Unicameral.
The 2018 Alabama Senate elections took place on November 3, 2018, as part of the 2018 United States elections. Alabama voters elected state senators in all 35 of the state's Senate districts. State senators serve four-year terms in the Alabama Senate.
The 2018 Nevada Senate election took place as part of the biennial United States elections. Nevada voters elected state senators in 11 of the state senate's 21 districts. State senators serve four-year terms in the Nevada State Senate.
The 2018 Iowa State Senate elections took place as part of the biennial 2018 United States elections. Iowa voters elected state senators in half of the state senate's districts—the 25 odd-numbered state senate districts. State senators serve four-year terms in the Iowa State Senate, with half of the seats up for election each cycle.
The 2020 Alaska Senate elections took place as part of the biennial 2020 United States elections. Voters in Alaska elected state senators in 11 of the state's 20 senate districts – the usual ten plus one special election. State senators serve four-year terms in the Alaska Senate, with half seats up for election every two years. Primary elections on August 18, 2020, determined which candidates appeared on the general election ballot on November 3, 2020.
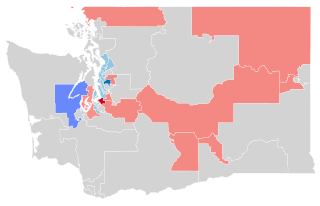
The 2022 Washington State Senate elections took place as part of the biennial United States elections. Washington state voters elected state senators in 25 of the state's 49 Senate districts. The other 24 state senators were not up for re-election until the next biennial election in 2024. State senators served four-year terms in the Washington State Senate.
The 2022 Washington House of Representatives elections took place as part of the biennial United States elections on November 8, 2022. Washington state voters elected state representatives in all 98 seats of the House, electing 2 state representatives in each of the 49 Washington state legislative districts. State representatives serve two-year terms in the Washington House of Representatives.
The 2022 Alaska Senate elections took place on November 8, 2022, with the primary elections being held on August 16, 2022. State senators serve four-year terms in the Alaska Senate, with half of the seats normally up for election every two years. However, because most districts were greatly changed in redistricting, elections were held for 19 of the 20 seats; the only exception is District T, represented by Democrat Donny Olson, which was mostly unchanged in redistricting and thus did not have an election. Some senators were elected to serve four-year terms, while others would serve shortened two-year terms.