1898 Colorado gubernatorial election

Last updated

1898 Colorado gubernatorial election
Flag of Colorado.svg
  1896 November 8, 1898 1900  
  Charles Spalding Thomas.jpg Henry Roger Wolcott.png
Nominee Charles S. Thomas Henry R. Wolcott
Party Democratic Republican
Popular vote93,96651,051
Percentage62.89%34.17%

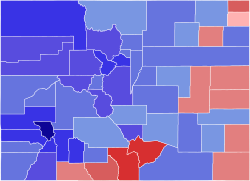
1898 Colorado gubernatorial election results map by county.svg
County results
Thomas:     50–60%     60–70%     70–80%     80–90%     90–100%
Wolcott:     40–50%     50–60%     60–70%     70–80%

Governor before election

Alva Adams
Democratic

Elected Governor

Charles S. Thomas
Democratic

The 1898 Colorado gubernatorial election was held on November 8, 1898. Democratic nominee Charles S. Thomas defeated Republican nominee Henry R. Wolcott with 62.89% of the vote.

Contents

General election

Candidates

Major party candidates

Other candidates

Results

1898 Colorado gubernatorial election [1]
PartyCandidateVotes%±%
Democratic Charles S. Thomas 93,966 62.89% +16.67%
Republican Henry R. Wolcott51,05134.17%+21.51%
Prohibition Robert H. Rhodes2,7111.81%
Socialist Labor Nixon Elliott1,6961.14%N/A
Majority 42,91528.72%
Turnout 149,424
Democratic hold Swing
CountyThomas %Thomas #Wolcott %Wolcott #Rhodes %Rhodes #Elliott %Elliott #Total
Arapahoe 62.54%33,85834.18%13,0381.84%7041.42%54438,144
Archuleta 43.98%22354.43%2761.38%70.19%1507
Baca 41.47%9058.52%1270.00%00.00%0217
Bent 53.01%38744.52%3252.19%160.27%2730
Boulder 66.11%4,06930.32%1,8662.71%1670.84%526,154
Chaffee 75.35%1,61422.12%4741.91%410.60%132,142
Cheyenne 44.38%7955.61%990.00%00.00%0178
Clear Creek 82.67%1,85115.23%3411.33%300.75%172,239
Conejos 31.68%65367.44%1,3900.38%80.48%102,061
Costilla 29.10%46870.08%1,1270.68%110.12%21,608
Custer 72.77%71125.58%2501.02%100.61%6977
Delta 68.53%95224.83%3453.74%522.87%401,389
Dolores 88.79%4367.94%391.42%71.83%9491
Douglas 62.01%68436.80%4060.99%110.18%21,103
Eagle 76.63%70521.52%1980.54%51.30%12920
El Paso 63.64%10,59634.50%5,7451.25%2090.59%9916,649
Elbert 59.46%53737.98%3432.10%190.44%4903
Fremont 55.07%2,41337.75%1,6542.64%1164.51%1984,381
Garfield 75.32%1,44721.44%4122.13%411.09%211,921
Gilpin 61.81%1,76633.32%9522.41%692.45%702,857
Grand 79.51%16319.51%400.97%20.00%0205
Gunnison 64.90%1,28731.82%6312.21%441.05%211,983
Hinsdale 82.14%48316.15%951.02%60.68%4588
Huerfano 29.13%80070.28%1,9300.36%100.21%62,746
Jefferson 61.66%2,13036.24%1,2521.47%510.60%213,454
Kiowa 58.46%14540.32%1001.20%30.00%0248
Kit Carson 37.68%17656.31%2635.78%270.21%1467
La Plata 78.54%1,56719.74%3941.35%270.35%71,995
Lake 65.94%3,76332.19%1,8371.06%610.78%455,706
Larimer 56.85%1,91739.65%1,3373.35%1130.14%53,372
Las Animas 66.36%3,75932.83%1,8600.58%330.21%125,664
Lincoln 47.63%12150.00%1272.36%60.00%0254
Logan 50.42%41245.53%3723.79%310.24%2817
Mesa 61.07%1,42330.68%7156.69%1561.54%362,330
Mineral 81.51%63516.68%1300.64%51.15%9779
Montezuma 82.01%49713.86%842.47%151.65%10606
Montrose 61.35%75926.27%3254.76%597.59%941,237
Morgan 51.56%46045.29%4042.69%240.44%4892
Otero 60.32%1,32634.57%7604.68%1030.40%92,198
Ouray 90.38%1,9396.29%1350.69%152.51%542,143
Park 71.05%93327.41%3600.60%80.91%121,313
Phillips 47.24%18049.34%1883.41%130.00%0381
Pitkin 75.84%1,56722.02%4551.01%211.11%232,066
Prowers 45.28%42351.71%4832.78%260.21%2934
Pueblo 53.33%4,27543.00%3,4471.99%1601.67%1348,016
Rio Blanco 75.79%33520.81%922.48%110.90%4442
Rio Grande 69.98%1,04026.58%3953.02%450.40%61,486
Routt 81.64%1,00516.97%2090.73%90.64%81,231
Saguache 59.84%85738.40%5500.62%91.11%161,432
San Juan 81.74%1,01217.04%2110.48%60.72%91,238
San Miguel 69.21%1,23229.04%5170.95%170.78%141,780
Sedgwick 34.90%7460.84%1293.30%70.94%2212
Summit 83.81%73014.58%1271.49%130.11%1871
Washington 40.25%15955.18%2184.05%160.50%2395
Weld 63.77%2,59532.41%1,3193.34%1360.46%194,069
Yuma 61.53%24837.96%1530.00%00.49%2403

[2]

References

  1. Guide to U.S. elections. CQ Press. 2005. ISBN   9781568029818 . Retrieved June 8, 2020.
  2. https://babel.hathitrust.org/cgi/pt?id=njp.32101062210032&view=1up&seq=129 [ bare URL ]