Summit County was organized as one of the seventeen original Colorado counties by the First Territorial Legislature on November 1, 1861. It was named for the many mountain summits in the county. Until February 2, 1874, its boundaries included the area now comprising Summit County, Grand County, Routt County, Moffat County, Garfield County, Eagle County, and Rio Blanco County.
In 1874, the northern half of the original Summit County was split off to form Grand County; with the creation of Garfield and Eagle counties in 1883, Summit County arrived at its present boundaries. In addition, Summit County has seen two major boom eras.
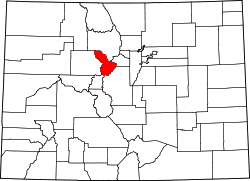
Geography
According to the United States Census Bureau, the county has a total area of 619.259 square miles (1,603.87km2), of which 608.328 square miles (1,575.56km2) is land and 10.931 square miles (28.31km2) (1.77%) is water.[6] It is the 55th largest county in Colorado by total area.[7]
The terrain of the county is mountainous with elevations ranging from 7,957 feet (2,425m) at Green Mountain Reservoir to 14,270 feet (4,350m) at Grays Peak. The elevation of the county seat of Breckenridge is 9,602 feet (2,927m), making it one of the highest cities in the state of Colorado and the United States.[8] Much of the county has an alpine climate (ET in the Köppen Classification) characterized by tundra vegetation. Breckenridge and other similar elevations in the county have a subarctic climate (Dfc) characterized by cool summers and abundant snowfall in winter.
U.S. Decennial Census[10] 1790–1960[11] 1900–1990[12] 1990–2000[13] 2010–2020[2]
2020 census
As of the 2020 census, the county had a population of 31,055. Of the residents, 16.8% were under the age of 18 and 13.0% were 65 years of age or older; the median age was 38.1 years. For every 100 females there were 119.5 males, and for every 100 females age 18 and over there were 120.7 males. 83.9% of residents lived in urban areas and 16.1% lived in rural areas.[14][15][16]
There were 12,939 households in the county, of which 24.8% had children under the age of 18 living with them and 18.0% had a female householder with no spouse or partner present. About 26.5% of all households were made up of individuals and 6.6% had someone living alone who was 65 years of age or older.[15]
There were 31,342 housing units, of which 58.7% were vacant. Among occupied housing units, 63.9% were owner-occupied and 36.1% were renter-occupied. The homeowner vacancy rate was 1.9% and the rental vacancy rate was 26.6%.[15]
2000 census
As of the 2000 census, there were 23,548 people, 9,120 households, and 4,769 families residing in the county. The population density was 39.0 inhabitants per square mile (15.1/km2). There were 24,201 housing units at an average density of 40.0 per square mile (15.4/km2). The racial makeup of the county was 91.84% White, 0.68% African American, 0.48% Native American, 0.87% Asian, 0.07% Pacific Islander, 3.96% from some other races and 2.10% from two or more races. Hispanic or Latino people of any race were 9.79% of the population.
There were 9,120 households, out of which 24.00% had children under the age of 18 living with them, 44.00% were married couples living together, 4.40% had a female householder with no husband present, and 47.70% were non-families. 21.60% of all households were made up of individuals, and 1.60% had someone living alone who was 65 years of age or older. The average household size was 2.48 and the average family size was 2.86.
In the county, the population was spread out, with 17.40% under the age of 18, 15.70% from 18 to 24, 44.30% from 25 to 44, 19.40% from 45 to 64, and 3.30% who were 65 years of age or older. The median age was 31 years. As of 2014, the life expectancy in Summit County was 86.83 years, the longest average life expectancy of any county in the United States.[17] For every 100 females there were 139.00 males. For every 100 females age 18 and over, there were 144.90 males.
The median income for a household in the county was $56,587, and the median income for a family was $66,914 (these figures had risen to $65,281 and $80,441 respectively as of a 2007 estimate). Males had a median income of $33,741 versus $27,017 for females. The per capita income for the county was $28,676. About 3.10% of families and 9.00% of the population were below the poverty line, including 4.30% of those under age 18 and 3.40% of those age 65 or over.
Snowmelt runoff fills Lake Dillon in Summit County
Life expectancy
According to a report in the Journal of the American Medical Association, residents of Summit County had a 2014 life expectancy from birth of 86.83 years in 2014, the longest in the United States.[18] Both men and women live longer in Summit County than in any other county in the United States: 85.5 years for men and 88.0 years for women is the life expectancy at birth.[19] Two contiguous counties, Pitkin and Eagle Counties, rank numbers two and three in the nation in life expectancy. Factors contributing to the high life expectancy in Summit County are "high education, high income, high access to medical care, the people are physically active, obesity is lower than anywhere else — so you’re doing it right,” said Dr. Ali Mokdad, one of the study's co-authors.[20]
Education
K–12 schools
Elementary schools
Breckenridge Elementary School
Dillon Valley Elementary School (Dillon)
Frisco Elementary School
Silverthorne Elementary School
Summit Cove Elementary School (Dillon)
Upper Blue Elementary School (Breckenridge)
Middle school
Summit Middle School (Frisco)
High schools
Snowy Peaks Junior/Senior High School (Frisco)
Summit High School (between Frisco and Breckenridge)
Summit County is liberal in most elections. Since 1988 the county has trended strongly toward the Democratic Party, like many other counties in Colorado dominated by ski towns. In 2020, Joe Biden's performance was the best by a Democrat since 1916, and Kamala Harris' performance was only slightly worse in 2024.
United States presidential election results for Summit County, Colorado[21]
This page is based on this Wikipedia article Text is available under the CC BY-SA 4.0 license; additional terms may apply. Images, videos and audio are available under their respective licenses.