2016 Florida Democratic presidential primary

Last updated

2016 Florida Democratic presidential primary
Flag of Florida.svg
  2008 March 15, 2016 (2016-03-15) 2020  
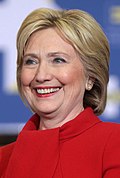
  Hillary Clinton by Gage Skidmore 2.jpg Bernie Sanders September 2015 cropped.jpg
Candidate Hillary Clinton Bernie Sanders
Home state New York Vermont
Delegate count14173
Popular vote1,101,414 [1] 568,839
Percentage64.4%33.3%

2016 Florida Democratic Presidential Primary by couny.svg
Results by county
Clinton:     40-50%     50-60%     60-70%     70-80%
Sanders:     40-50%     50-60%

The 2016 Florida Democratic presidential primary took place on March 15 in the U.S. state of Florida as one of the Democratic Party's primaries ahead of the 2016 presidential election.

Contents

On the same day, the Democratic Party held primaries in Illinois, Missouri, North Carolina and Ohio, while the Republican Party held primaries in the same five states, including their own Florida primary, plus the Northern Mariana Islands.

Clinton's landslide was fueled by support from retirees, [2] and Jewish [2] and Latino [3] voters in South Florida.

Debates and forums

March 2016 debate in Miami

On March 9, 2016, the Democratic Party held an eighth presidential debate at Miami Dade College in Miami, Florida. It was broadcast through a partnership between Univision and The Washington Post .

Opinion polling

Poll sourceDate1st2ndOther
Official Primary results March 15, 2016Hillary Clinton
64.4%
Bernie Sanders
33.3%
Other
2.3%
ARG [4]

Margin of error: ± 5.0%
Sample size: 400

March 11–13, 2016Hillary Clinton
58%
Bernie Sanders
37%
Others / Undecided 5%
Quinnipiac [5]

Margin of error: ± 4.3%
Sample size: 519

March 8–13, 2016Hillary Clinton
60%
Bernie Sanders
34%
Others / Undecided 6%
Public Policy Polling [6]

Margin of error: ± 3.9%
Sample size: 627

March 11–12, 2016Hillary Clinton
57%
Bernie Sanders
32%
Others / Undecided 11%
CBS News/YouGov [7]

Margin of error: ± 4.5%
Sample size: 796

March 9–11, 2016Hillary Clinton
62%
Bernie Sanders
34%
Others / Undecided 4%
Florida Atlantic University [8]

Margin of error: ± 5%
Sample size: 414

March 8–11, 2016Hillary Clinton
59%
Bernie Sanders
31%
Others / Undecided 10%
NBC News/Wall Street Journal/Marist [9]

Margin of error: ± 4.4%
Sample size: 500

March 4–10, 2016Hillary Clinton
61%
Bernie Sanders
34%
Others / Undecided 5%
WTSP/Mason-Dixon [10]

Margin of error: ± 4.5%
Sample size: 500

March 7–9, 2016Hillary Clinton
68%
Bernie Sanders
23%
Others / Undecided 9%
Quinnipiac [11]

Margin of error: ± 4.3%
Sample size: 511

March 2–7, 2016Hillary Clinton
62%
Bernie Sanders
32%
Others / Undecided 6%
SurveyUSA/Bay News 9/News 13 [12]

Margin of error: ± 3.4%
Sample size: 823

March 4–6, 2016Hillary Clinton
61%
Bernie Sanders
30%
Others / Undecided 9%
CNN/ORC [13]

Margin of error: ± 6.0%
Sample size: 264

March 2–6, 2016Hillary Clinton
61%
Bernie Sanders
34%
Others / Undecided 5%
Wash Post/Univision [14]

Margin of error: ± 6.0%
Sample size: 449

March 2-5, 2016Hillary Clinton
64%
Bernie Sanders
26%
Others / Undecided 10%
University of North Florida [15]

Margin of error: ± 3.7%
Sample size: 685

February 22–27, 2016Hillary Clinton
54%
Bernie Sanders
24%
Others / Undecided 22%
Public Policy Polling [16]

Margin of error: ± 5%
Sample size: 388

February 24–25, 2016Hillary Clinton
57%
Bernie Sanders
32%
Others / Undecided 11%
Gravis Marketing [17]

Margin of error: ± 4.3%
Sample size: 514

February 24, 2016Hillary Clinton
58%
Bernie Sanders
42%
Quinnipiac [18]

Margin of error: ± 4.5%
Sample size: 476

February 21–24, 2016Hillary Clinton
59%
Bernie Sanders
33%
Others / Undecided 8%
Florida Southern College [19]

Margin of error: ± 4.0%
Sample Size: 608

January 30 – February 6, 2016Hillary Clinton
43%
Bernie Sanders
26%
Others / Undecided 31%
Florida Atlantic University [20]

Margin of error: ± 5.0%
Sample Size: 371

January 15–18, 2016Hillary Clinton
62%
Bernie Sanders
26%
Martin O'Malley 2%
Not Reported
Polls in 2015
Poll sourceDate1st2ndOther
Florida Atlantic University [20]

Margin of error: ± 5.2%
Sample Size: 355

November 15–16, 2015Hillary Clinton
66%
Bernie Sanders
22%
Martin O'Malley 4%
Other 4.5%
Undecided 3.7%
Bay News 9/ News13 [21]

Margin of error: ± 3.9%
Sample size: 826

October 28 – November 1, 2015Hillary Clinton
66%
Bernie Sanders
24%
Martin O'Malley 3%
Other 2%
Undecided 6%
Saint Leo University Polling Institute [22]

Margin of error: ±6.0%
Sample size: 165

October 17–22, 2015Hillary Clinton
50.9%
Joe Biden 15.2%Bernie Sanders 13.3%
Unsure/Don't Know 8.5%
Quinnipiac University [23]

Margin of error: ± 4.8%
Sample size: 411

September 25 – October 5, 2015Hillary Clinton
43%
Joe Biden
19%
Bernie Sanders 19%
Someone else/Undecided 13%
Public Policy Polling [24]

Margin of error: ± 5.1%
Sample size: 368

September 11–13, 2015Hillary Clinton
55%
Bernie Sanders
18%
Joe Biden 17%
Martin O'Malley 2%
Jim Webb 1%
Lincoln Chafee 1%
Lawrence Lessig 0%
Someone else/Undecided 6%
Gravis Marketing [25]

Margin of error: ± 4%
Sample size: 693

September 5–11, 2015Hillary Clinton
41.6%
Joe Biden
21.4%
Bernie Sanders 12.5%
Martin O'Malley 1.5%
Jim Webb 1.3%
Lincoln Chafee 0.4%
Unsure 21.3%
Quinnipiac University [26]

Margin of error: ± 5%
Sample size: 419

Posted September 4, 2015Hillary Clinton
52%
Bernie Sanders
20%
Joe Biden 15%
Lincoln Chafee 4%
Martin O'Malley 1%
Jim Webb 1%
Other 1%
Undecided 6%
Quinnipiac University [27]

Margin of error: ± 5.3%
Sample size: 345

August 7–18, 2015Hillary Clinton
48%
Bernie Sanders
15%
Joe Biden 11%
Martin O'Malley 1%
Jim Webb 1%
Lincoln Chafee 0%
Other 2%
Wouldn't vote 6%
Undecided 17%
St Pete Polls [28]

Margin of error: ± 3.0%
Sample size: 1080

July 18–28, 2015Hillary Clinton
55%
Bernie Sanders
29%
Jim Webb 2%
Martin O'Malley 1%
Lincoln Chafee <1%
Unsure or someone else 13%
Mason-Dixon [29]

Margin of error: ± 4.5%
Sample size: 500

July 20–23, 2015Hillary Clinton
58%
Bernie Sanders
17%
Martin O'Malley 2%
Lincoln Chafee 0%
Jim Webb 0%
Undecided 23%
Gravis Marketing [30]

Margin of error: ± 3%
Sample size: 881

June 16–20, 2015Hillary Clinton
64.8%
Bernie Sanders
20.6%
Martin O'Malley 2.1%
Bill De Blasio 1.7%
Jim Webb 0.9%
Lincoln Chafee 0.4%
Unsure 9.5%
Quinnipiac University [31]

Margin of error: ± 5%
Sample size: 378

June 4–15, 2015Hillary Clinton
64%
Joe Biden
9%
Bernie Sanders 8%
Martin O'Malley 1%
Lincoln Chafee 0%
Jim Webb 0%
Other 1%
Wouldn't vote 5%
Undecided 13%
Quinnipiac University [32]

Margin of error: ± 5.3%
Sample size: 344

March 17–28, 2015Hillary Clinton
65%
Joe Biden
11%
Elizabeth Warren 7%
Bernie Sanders 3%
Jim Webb 2%
Martin O'Malley 0%
Other 1%
Wouldn't vote 2%
Undecided 10%
Joe Biden
42%
Elizabeth Warren
19%
Bernie Sanders 6%
Jim Webb 3%
Martin O'Malley 1%
Other 2%
Wouldn't vote 4%
Undecided 22%
Public Policy Polling [33]

Margin of error: ± 5.1%
Sample size: 371

March 19–22, 2015Hillary Clinton
58%
Joe Biden
14%
Elizabeth Warren 10%
Bernie Sanders 3%
Martin O'Malley 2%
Jim Webb 1%
Other/Undecided 11%
[34]

Margin of error: ± 5%
Sample size: 435

February 24–25, 2015Hillary Clinton
52%
Elizabeth Warren
14%
Joe Biden 9%
Martin O'Malley 2%
Mark Warner 2%
Jim Webb 2%
Undecided 18%
Quinnipiac University [35]

Margin of error: ± 5.5%
Sample size: 322

January 22 – February 1, 2015Hillary Clinton
61%
Joe Biden
11%
Elizabeth Warren 9%
Bernie Sanders 2%
Martin O'Malley 1%
Jim Webb 1%
Other 2%
Wouldn't vote 4%
Undecided 10%
Joe Biden
39%
Elizabeth Warren
22%
Bernie Sanders 3%
Martin O'Malley 2%
Jim Webb 2%
Other 4%
Wouldn't vote 5%
Undecided 23%
Polls in 2014
Poll sourceDate1st2ndOther
Quinnipiac University [36]

Margin of error: ± 4.6%
Sample size: 457

July 17–21, 2014Hillary Clinton
67%
Joe Biden
8%
Elizabeth Warren 8%
Andrew Cuomo 1%
Martin O'Malley 0%
Brian Schweitzer 0%
Other 1%
Wouldn't vote 3%
Undecided 11%
Public Policy Polling [37]

Margin of error: ± 6.2%
Sample size: 251

June 6–9, 2014Hillary Clinton
66%
Elizabeth Warren
8%
Joe Biden 7%
Cory Booker 5%
Andrew Cuomo 4%
Mark Warner 1%
Kirsten Gillibrand 0%
Martin O'Malley 0%
Brian Schweitzer 0%
Someone else/Undecided 9%
Quinnipiac University [38]

Margin of error: ± 4.4%
Sample size: 501

April 23–28, 2014Hillary Clinton
64%
Joe Biden
11%
Elizabeth Warren 6%
Andrew Cuomo 1%
Martin O'Malley 1%
Brian Schweitzer 1%
Other 1%
Wouldn't vote 3%
Undecided 13%
Quinnipiac University [39]

Margin of error: ± 4.3%
Sample size: 529

January 22–27, 2014Hillary Clinton
64%
Joe Biden
9%
Elizabeth Warren 5%
Andrew Cuomo 1%
Martin O'Malley 1%
Mark Warner 1%
Other 2%
Wouldn't vote 2%
Undecided 16%
Polls in 2013
Poll sourceDate1st2ndOther
Quinnipiac University [40]

Margin of error: ± 4.2%
Sample size: 544

November 12–17, 2013Hillary Clinton
70%
Joe Biden
9%
Elizabeth Warren 4%
Andrew Cuomo 2%
Martin O'Malley 1%
Mark Warner 1%
Other 2%
Wouldn't vote 2%
Undecided 10%
Public Policy Polling

Margin of error: ± 5.7%
Sample size: 300

March 15–18, 2013Hillary Clinton
62%
Joe Biden
12%
Andrew Cuomo 5%
Elizabeth Warren 3%
Martin O'Malley 1%
Brian Schweitzer 1%
Mark Warner 1%
Kirsten Gillibrand 0%
Deval Patrick 0%
Someone Else/Undecided 14%
Public Policy Polling

Margin of error: ± 4.9%
Sample size: 401

January 11–13, 2013Hillary Clinton
65%
Joe Biden
15%
Andrew Cuomo 4%
Elizabeth Warren 4%
Deval Patrick 1%
Mark Warner 1%
Kirsten Gillibrand 0%
Martin O'Malley 0%
Brian Schweitzer 0%
Someone Else/Undecided 11%
Andrew Cuomo
22%
Elizabeth Warren
15%
Deval Patrick 5%
Martin O'Malley 4%
Kirsten Gillibrand 3%
Mark Warner 2%
Brian Schweitzer 1%
Someone Else/Undecided 48%

Results

e    d   2016 Democratic Party's presidential nominating process in Florida
– Summary of results –
CandidatePopular voteEstimated delegates
CountPercentagePledgedUnpledgedTotal
Hillary Clinton 1,101,41464.44%14124165
Bernie Sanders 568,83933.28%73275
Martin O'Malley (withdrawn)38,9302.28%
Uncommitted066
Total1,709,183100%21432246
Source: The Green Papers , Florida Division of Elections - Official Primary Results

Results by district

Florida Democratic primary, March 15, 2016
DistrictDelegatesVotes ClintonVotes SandersVotes QualifiedClinton delegatesSanders delegates
1326987184974548421
2650190340738426342
3432070279746004422
4433920227655668522
5655855186397449442
6537995244436243832
7537410267956420532
8539384243766376032
9540609198806048932
10538011222136022432
11538061215905965132
12535498231725867032
13644121297077382842
14649146236177276342
15532793207125350532
16643921258566977742
17429899170454694431
18642804206206342442
19431958172354919331
20761998157617775961
21757723221007982352
22649602222097181142
23644510199746448442
24859274138937316762
2532489792873418421
26432069141484621731
27430709122584296731
Total140110141456883916702539347
PLEO28110141456883916702531810
At Large46110141456883916702533016
Gr. Total2141101414568839167025314173
Total vote64.44%33.28%1,709,183
Source: Florida Department of State Division of Elections

Results by county

County [41] ClintonVotesSandersVotes
Alachua 49.2%17,73348.8%17,590
Baker 38.5%65447.4%805
Bay 52.6%5,20941.7%4,131
Bradford 48.7%1,05641.8%908
Brevard 59.7%31,83537.7%20,083
Broward 72.5%132,52726.4%48,330
Calhoun 36.2%43745.2%545
Charlotte 62.1%8,12535.4%4,634
Citrus 56.3%6,86339.2%4,776
Clay 57.1%5,34539.5%3,698
Collier 66.1%12,71231.9%6,127
Columbia 52.9%2,29938.6%1,676
DeSoto 52.6%98738.7%726
Dixie 40.2%40945.1%459
Duval 67.2%58,63230.6%26,716
Escambia 62.2%16,76534.6%9,318
Flagler 65.8%6,15231.9%2,977
Franklin 47.0%66545.7%647
Gadsden 76.4%7,44620.0%1,944
Gilchrist 37.5%42850.7%578
Glades 49.9%38740.3%313
Gulf 47.4%56843.4%520
Hamilton 54.7%75834.6%479
Hardee 52.7%52939.1%393
Hendry 60.6%1,15633.9%647
Hernando 59.6%8,88237.0%5,512
Highlands 61.4%3,71134.0%2,054
Hillsborough 62.8%68,93635.1%38,505
Holmes 28.3%33951.7%619
Indian River 62.4%6,89735.5%3,926
Jackson 53.9%2,79835.5%1,840
Jefferson 64.6%1,67129.5%762
Lafayette 30.0%29550.9%501
Lake 63.5%15,91433.8%8,465
Lee 62.7%27,94035.0%15,624
Leon 56.5%27,33341.1%19,866
Levy 50.0%1,57043.1%1,354
Liberty 38.0%31647.1%392
Madison 62.4%1,54230.0%741
Manatee 62.5%18,11635.1%10,165
Marion 62.7%18,22034.1%9,892
Martin 59.8%6,52337.6%4,101
Miami-Dade 74.7%129,46724.3%42,009
Monroe 55.3%4,83042.8%3,739
Nassau 56.2%2,91039.8%2,060
Okaloosa 52.0%4,55943.1%3,782
Okeechobee 55.2%1,15037.6%784
Orange 63.8%66,65435.1%36,639
Osceola 68.2%16,51230.0%7,273
Palm Beach 71.5%103,36927.2%39,314
Pasco 58.3%21,76038.9%14,493
Pinellas 60.3%63,69937.6%39,742
Polk 63.0%29,32833.3%15,473
Putnam 49.4%3,18242.7%2,747
Santa Rosa 49.2%3,93845.0%3,602
Sarasota 61.1%25,88137.3%15,776
Seminole 58.3%22,06939.9%15,100
St. Johns 57.0%9,73440.7%6,953
St. Lucie 66.9%17,55430.8%8,091
Sumter 68.1%7,02229.3%3,022
Suwannee 42.2%1,47544.3%1,550
Taylor 45.9%98342.4%907
Union 36.7%33651.6%472
Volusia 60.2%26,27637.1%16,170
Wakulla 48.9%1,65942.0%1,424
Walton 50.0%1,51544.9%1,361
Washington 47.1%85842.9%781
Total64.4%1,101,41433.3%568,839

Analysis

Florida was generally viewed as a state Hillary Clinton would win, given her strong performance in previous contests with older voters (who comprised 65% of the Democratic electorate in Florida, the largest in any contest) and non-white voters (who made up 52% of the electorate). Clinton won the Florida Primary by 31 points, winning older voters by a margin of 71–26, and non-white voters by a margin of 74–25. Specifically, she won Hispanic/Latino voters by a margin of 68-32 (who made up 20% of the electorate), and African American voters 81-18 (who comprised 27% of the electorate). Clinton also won white voters by a narrower margin of 53–43. She won across all income and educational attainment levels. [42]

In terms of religious affiliation, Clinton won Protestants in Florida 69-29 (36% of the electorate), Catholics 69-29 (22% of the electorate), and other religious affiliations 68-31 (Jews were 4% of the electorate but were unaccounted for in exit polls). Sanders won voters who identified as agnostic/atheist 56–31. In terms of political ideology, Clinton won liberals 59-41 and moderates/conservatives 70–26. And while Clinton won Democrats 71–28, Sanders won self-identified Independents 55–41. [43]

Clinton won in Miami and along the Gold Coast 73–26, where there is a larger population of Hispanic/Latino voters who in South Florida are predominantly of Cuban or Nicaraguan descent. Clinton also won the Gulf Coast and Mid-Florida 64–35, the Tampa Bay Area 63–37, the Orlando area 62–34, and the Northern Panhandle which is whiter, more conservative and more rural by a smaller margin of 58–37. [44]

Related Research Articles

This is a list of nationwide public opinion polls that were conducted relating to the Republican primaries for the 2016 United States presidential election. The persons named in the polls were either declared candidates, former candidates, or received media speculation about their possible candidacy. On May 4, 2016, Donald Trump became the sole contender and presumptive nominee.

<span class="mw-page-title-main">Statewide opinion polling for the 2016 Republican Party presidential primaries</span>

This article contains opinion polling by U.S. state for the 2016 Republican Party presidential primaries. The shading for each poll indicates the candidate(s) which are within one margin of error of the poll's leader.

<span class="mw-page-title-main">Statewide opinion polling for the 2016 Democratic Party presidential primaries</span>

This article contains opinion polling by U.S. state for the 2016 Democratic Party presidential primaries. For currency and accuracy, please note the specific dates for each polling as listed below. For the significance of the earliest state votes, the Iowa caucuses and the New Hampshire primary, see United States presidential primary – Iowa and New Hampshire. To know when any given state votes, see the timeline of primaries and caucuses.

The following is a timeline of major events leading up to, during, and after the 2016 United States presidential election. The election was the 58th quadrennial United States presidential election, held on November 8, 2016. The presidential primaries and caucuses were held between February 1 and June 14, 2016, staggered among the 50 states, Washington, D.C., and U.S. territories. The U.S. Congress certified the electoral result on January 6, 2017, and the new President and Vice President were inaugurated on January 20, 2017.

<span class="mw-page-title-main">2016 New Hampshire Republican presidential primary</span>

The 2016 New Hampshire Republican presidential primary, which took place on February 9, was the second major vote of the cycle. Donald Trump was declared the winner with 35.3% of the popular vote and picked up 11 delegates, while John Kasich emerged from a pack of candidates between 10-20% to capture second place with 15.8% of the vote and picked up four delegates.

<span class="mw-page-title-main">2016 New Hampshire Democratic presidential primary</span>

The 2016 New Hampshire Democratic presidential primary was held on Tuesday February 9. As per tradition, it was the first primary and second nominating contest overall to take place in the cycle. Bernie Sanders defeated Hillary Clinton in the primary by a margin of more than 22% in the popular vote. Sanders claimed 15 delegates to Clinton's 9.

<span class="mw-page-title-main">2016 Iowa Democratic presidential caucuses</span>

The 2016 Iowa Democratic presidential caucuses were held on Monday February 1 in Iowa, as usual marking the Democratic Party's first nominating contest in their series of presidential primaries ahead of the 2016 presidential election.

<span class="mw-page-title-main">2016 Iowa Republican presidential caucuses</span>

The 2016 Iowa Republican presidential caucuses took place on February 1 in the U.S. state of Iowa, traditionally marking the Republican Party's first nominating contest in their series of presidential primaries ahead of the 2016 presidential election.

Statewide polls for the 2016 United States presidential election are as follows. The polls listed here, by state, are from 2013 to December 31, 2015, and provide early data on opinion polling between a possible Republican candidate against a possible Democratic candidate.

<span class="mw-page-title-main">2016 Illinois Democratic presidential primary</span>

The 2016 Illinois Democratic presidential primary took place on March 15 in the U.S. state of Illinois as one of the 2016 Democratic Party presidential primaries ahead of the 2016 presidential election.

<span class="mw-page-title-main">2016 Ohio Democratic presidential primary</span>

The 2016 Ohio Democratic presidential primary took place on March 15 in the U.S. state of Ohio as one of the Democratic Party's primaries prior to the 2016 presidential election.

<span class="mw-page-title-main">2016 New York Democratic presidential primary</span>

The 2016 New York Democratic presidential primary was held on April 19 in the U.S. state of New York as one of the Democratic Party's primaries ahead of the 2016 presidential election. Hillary Clinton, who had previously represented New York in the United States Senate from 2001 to 2009, won a comfortable majority in both the popular vote and delegate count over Bernie Sanders, who was born in Brooklyn.

<span class="mw-page-title-main">2016 Connecticut Democratic presidential primary</span>

The 2016 Connecticut Democratic presidential primary were held on April 26 in the U.S. state of Connecticut as one of the Democratic Party's primaries ahead of the 2016 presidential election.

<span class="mw-page-title-main">2016 Pennsylvania Democratic presidential primary</span> Selecting presidential candidate

The 2016 Pennsylvania Democratic presidential primary was held on April 26 in the U.S. state of Pennsylvania as one of the Democratic Party's primaries ahead of the 2016 presidential election.

<span class="mw-page-title-main">2016 New York Republican presidential primary</span>

The 2016 New York Republican presidential primary was held on April 19 in the U.S. state of New York as one of the Republican Party's primaries ahead of the 2016 presidential election.

<span class="mw-page-title-main">2016 Ohio Republican presidential primary</span>

The 2016 Ohio Republican presidential primary took place March 15 in the U.S. state of Ohio, as a part of the Republican Party's series of presidential primaries ahead of the 2016 presidential election. The Ohio primary was held alongside Republican primary elections in Florida, Illinois, Missouri and North Carolina, along with the Democratic contest in Ohio.

Statewide polls for the 2016 United States presidential election are as follows. The polls listed here, by state, are from January 1 to August 31, 2016 and provide early data on opinion polling between a possible Republican candidate against a possible Democratic candidate.

This page lists nationwide public opinion polls that have been conducted relating to the 2016 United States presidential election in Florida, contested by Hillary Clinton, Donald Trump, Gary Johnson and Jill Stein. The state was won by Donald Trump with 49.02% of the vote against 47.82% for Hillary Clinton.

This article contains opinion polling in New Hampshire for the 2016 Republican Party presidential primaries. The shading for each poll indicates the candidate(s) which are within one margin of error of the poll's leader.

<span class="mw-page-title-main">2016 Massachusetts Republican presidential primary</span> 2016 Republican Party presidential primary in Massachusetts

The 2016 Massachusetts Republican presidential primary was held on Tuesday March 1, as one of the Republican Party's 2016 presidential primaries. Massachusetts was one of eleven states that held both their Democratic and Republican presidential primaries on that day, dubbed "Super Tuesday". 42 delegates were allocated proportionally to all candidates who received at least 5 percent of the vote in the primary.

References

  1. Florida Division of Elections - Official Primary Results Archived 2016-03-16 at the Wayback Machine
  2. 1 2 What Do Florida's Senior Citizens Want? - America's Election 2016 , retrieved August 24, 2021
  3. "Trump Won Florida But Clinton Is Winning the Latino Vote". Fortune. Retrieved August 24, 2021.
  4. "ARG Florida Poll March 11-13, 2016".
  5. "March 14, 2016 - Trump Tops Rubio In Florida, Ties Kasich In Ohio, Quinnipiac University Poll Finds; Clinton Leads Sanders In Two Critical Primaries".
  6. "Midwestern States a Toss Up Tuesday" (PDF).
  7. "Poll: Trump and Kasich neck-and-neck in Ohio; Trump leads in Florida".
  8. "Poll: Marco Rubio, Ted Cruz split anti-Donald Trump vote in Florida".
  9. "Polls: Trump Ahead in Florida, Illinois; Kasich Leads in Ohio".
  10. "Poll: Rubio closing in on Trump in Florida".
  11. "WOMEN DRIVE CLINTON TO 2-1 LEAD AMONG FLORIDA DEMS, QUINNIPIAC UNIVERSITY POLL FINDS; SHE HAS 9-POINT LEAD IN OHIO" (PDF).
  12. "Exclusive Florida Decides Poll: Trump, Clinton lead Florida's presidential primaries".
  13. "CNN/ORC Poll: Trump, Clinton leading in Florida, Ohio".
  14. "Washington Post-Univision News Florida Democratic primary survey March 2016". The Washington Post. Retrieved March 10, 2016.
  15. "Minority voters help Clinton dominate Sanders in Florida poll". Politico Florida. Retrieved February 29, 2016.
  16. "Trump Leads Rubio in Florida- Even Head to Head" (PDF). Public Polling Policy. Retrieved February 26, 2016.
  17. "Florida Polling Results". One America News Network. Retrieved March 5, 2016.
  18. "WOMEN GIVE CLINTON BIG LEAD AMONG FLORIDA DEMOCRATS, QUINNIPIAC UNIVERSITY POLL FINDS; YOUNG VOTERS GO TO SANDERS" (PDF). Quinnipiac. Retrieved February 26, 2016.
  19. "The Florida Southern College Center for Polling and Policy Research" (PDF). Quinnipiac University. February 6, 2016.
  20. 1 2 "Polls". FAU College of Business. Retrieved January 22, 2016.
  21. "Florida Decides Poll: Trump dominates among Florida voters". baynews9.com.
  22. "Polling Institute at Saint Leo University – Ben Carson Nearly Ties with Frontrunner Trump Nationally Among Likely GOP Voters, while Jeb Bush Trails, Nationally and in Florida". Polling Institute at Saint Leo University.
  23. "2016 Presidential Swing State Polls Poll". Quinnipiac University. October 7, 2015.
  24. "Florida Down on Bush, Rubio Campaigns" (PDF). Public Policy Polling. September 15, 2015.
  25. "Florida Poll (September 12, 2015)3 (2)". Scribd.
  26. "Poll: Hillary Clinton, Donald Trump lead in Florida" . Retrieved September 6, 2015.
  27. "Quinnipiac poll" (PDF). Quinnipiac.edu. Retrieved August 20, 2015.
  28. "Florida Statewide Democratic Primary Election survey" (PDF). Retrieved July 30, 2015.
  29. "BUSH TOP CHOICE OF STATE GOP VOTERS RUBIO DROPS, WALKER RUNS 3RD – AHEAD OF TRUMP, CLINTON HAS WIDE LEAD AMONG DEMOCRATS" . Retrieved July 24, 2015.
  30. "Current Democratic and Republican Polling in Florida – Gravis" . Retrieved July 9, 2015.
  31. http://www.quinnipiac.edu/images/polling/ps/ps06182015_Sk32gth.pdf
  32. Quinnipiac University. "2016 Presidential Swing State Polls Poll – April 2, 2015 – Bush Slips In Florida, Stalls – Quinnipiac University Connecticut". QU Poll.
  33. http://www.publicpolicypolling.com/pdf/2015/PPP_Release_FL_32415.pdf
  34. "Gravis Insights Florida Political Primary Poll Republican and Democrat". Gravis.
  35. Quinnipiac University. "2016 Presidential Swing State Polls Poll – – – Quinnipiac University Connecticut". QU Poll.
  36. Quinnipiac University. "Florida (FL) Poll – July 24, 2014 – Obama In Slump, But Clinton Sc – Quinnipiac University Connecticut". QU Poll.
  37. http://www.publicpolicypolling.com/pdf/2014/PPP_Release_FL_611.pdf
  38. Quinnipiac University. "Florida (FL) Poll – May 1, 2014 – Jeb Bush Is Top Dog In Florida – Quinnipiac University Connecticut". QU Poll.
  39. Quinnipiac University. "Florida (FL) Poll – January 31, 2014 – Bridgegate Drives Christie To – Quinnipiac University Connecticut". QU Poll.
  40. Quinnipiac University. "Florida (FL) Poll – November 22, 2013 – Jeb Bush, Clinton Tops In Flor – Quinnipiac University Connecticut". QU Poll.
  41. "2016 Election Center". CNN . Retrieved June 4, 2018.
  42. "2016 Election Center". CNN. Retrieved August 7, 2016.
  43. "2016 Election Center". CNN. Retrieved September 25, 2016.
  44. "2016 Election Center". CNN. Retrieved September 25, 2016.