Indian Wells, California

Last updated

Indian Wells
Indian Wells CA.JPG
City limit as seen from Palm Desert, California
Nickname: 
I.W.
Riverside County California Incorporated and Unincorporated areas Indian Wells Highlighted 0636434.svg
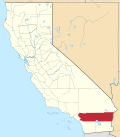
Location of Indian Wells in Riverside County, California
Usa edcp relief location map.png
Red pog.svg
Indian Wells
Location in the United States
Coordinates: 33°43′07″N116°18′30″W / 33.71861°N 116.30833°W / 33.71861; -116.30833 [1]
Country United States
State Flag of California.svg  California
County Riverside
Incorporated July 14, 1967 [2]
Government
  Type Council–manager
   Mayor Bruce Whitman
   Mayor Pro Tem Dana Reed
   City Council
  • Toper Taylor
  • Brian Penna
  • Greg Sanders
Area
[3]
  Total
14.58 sq mi (37.77 km2)
  Land14.32 sq mi (37.09 km2)
  Water0.26 sq mi (0.68 km2)  1.85%
Elevation
[1]
89 ft (27 m)
Population
 (2020) [4]
  Total
4,757
  Density332.2/sq mi (128.25/km2)
Time zone UTC−8 (Pacific)
  Summer (DST) UTC−7 (PDT)
ZIP Code
92210
Area codes 442/760
FIPS code 06-36434
GNIS feature IDs 1660797, 2410100
Website cityofindianwells.org

Indian Wells is a city in Riverside County, California, United States, in the Coachella Valley. Incorporated in 1967, it lies in between the cities of Palm Desert and La Quinta. As of the 2020 census, the city population was 4,757.

Contents

Indian Wells Tennis Garden in 2014 2143-0029 the-venue.jpg
Indian Wells Tennis Garden in 2014

The city hosts the sixth-largest tennis tournament in the world, the Indian Wells Masters tennis tournament, presently known as the BNP Paribas Open. The Indian Wells Masters is one of nine ATP World Tour Masters 1000 high-level events operated by the Association of Tennis Professionals, and one of the four WTA Premier Mandatory tournaments of the Women's Tennis Association. It is held at the Indian Wells Tennis Garden, which contains the second-largest tennis-specific stadium in the world.

History

The city derived its name from a historic Cahuilla Native American water reservoir, which served as a crucial water supply for nearby tribes. [5]

As early as 1820, the area now known as Indian Wells was the site of a thriving Indian village, as reported by W.P. Blade, a Smithsonian Institution geologist. A decade later, when gold was discovered on the Colorado River, William D. Bradshaw built a trail from Los Angeles through the desert to the gold mines. The Alexander and Company Stage Line used the trail to transport prospectors and Indian Wells became an important stop along the trail. Competition from the Southern Pacific Railroad caused the route to be abandoned briefly in 1875 before being reactivated by the Wells Fargo company the following year. [6]

Over the next decades, settlers gradually arrived in the area and date palm ranches became profitable. The area's first golf courses were opened in the 1950s at the Eldorado Country Club and the Indian Wells Country Club. In 1957, Desi Arnaz opened his Indian Wells Hotel (forerunner to the Indian Wells Resort Hotel). In 1960, Arnold Palmer won the first Bob Hope Desert Classic golf tournament. President Dwight D. Eisenhower was a regular Indian Wells visitor and later an Eldorado homeowner. [7]

In an election held June 27, 1967, to avoid being annexed by neighboring cities such as Palm Desert, the inhabitants of Indian Wells voted to incorporate as a city. On July 14, 1967, Indian Wells became California's 400th city and the 16th in Riverside County. Since then, Indian Wells has continued to grow, with the development of resort hotels, golf courses and luxury residential areas. [8]

Demographics

Historical population
CensusPop.Note
1970 760
1980 1,39483.4%
1990 2,64789.9%
2000 3,81644.2%
2010 4,95829.9%
2020 4,757−4.1%
U.S. Decennial Census [9]

2010

The 2010 United States Census [10] reported that Indian Wells had a population of 4,958. The population density was 339.8 inhabitants per square mile (131.2/km2). The racial makeup of Indian Wells was 4,721 (95.2%) White (92.3% Non-Hispanic White), [11] 29 (0.6%) African American, 20 (0.4%) Native American, 83 (1.7%) Asian, 2 (0.0%) Pacific Islander, 52 (1.0%) from other races, and 51 (1.0%) from two or more races. Hispanic or Latino of any race were 209 persons (4.2%).

The Census reported that 4,952 people (99.9% of the population) lived in households, 6 (0.1%) lived in non-institutionalized group quarters, and 0 (0%) were institutionalized.

There were 2,745 households, out of which 193 (7.0%) had children under the age of 18 living in them, 1,519 (55.3%) were opposite-sex married couples living together, 85 (3.1%) had a female householder with no husband present, 46 (1.7%) had a male householder with no wife present. There were 85 (3.1%) unmarried opposite-sex partnerships, and 36 (1.3%) same-sex married couples or partnerships. 944 households (34.4%) were made up of individuals, and 690 (25.1%) had someone living alone who was 65 years of age or older. The average household size was 1.80. There were 1,650 families (60.1% of all households); the average family size was 2.22.

The age distribution was: 310 people (6.3%) under the age of 18, 76 people (1.5%) aged 18 to 24, 283 people (5.7%) aged 25 to 44, 1,558 people (31.4%) aged 45 to 64, and 2,731 people (55.1%) who were 65 years of age or older. The median age was 66.7 years. For every 100 females, there were 84.6 males. For every 100 females age 18 and over, there were 84.2 males.

There were 5,137 housing units at an average density of 352.1 per square mile (135.9/km2), of which 2,285 (83.2%) were owner-occupied, and 460 (16.8%) were occupied by renters. The homeowner vacancy rate was 5.1%; the rental vacancy rate was 15.4%. 4,251 people (85.7% of the population) lived in owner-occupied housing units and 701 people (14.1%) lived in rental housing units.

During 20092013, Indian Wells had a median household income of $83,884, with 5.2% of the population living below the federal poverty line. [12]

2000

As of the census [13] of 2000, there were 3,816 people, 1,982 households, and 1,323 families residing in the city. The population density was 288.5 inhabitants per square mile (111.4/km2). There were 3,843 housing units at an average density of 290.5 per square mile (112.2/km2). The racial makeup of the city was 96.3% White, 1.5% Asian, 0.4% Black or African American, 0.2% Native American, 0.1% Pacific Islander, 0.5% from other races, and 1.0% from two or more races. 3.0% of the population were Hispanic or Latino of any race.

There were 1,982 households, out of which 8.4% had children under the age of 18 living with them, 63.1% were married couples living together, 3.0% had a female householder with no husband present, and 33.2% were non-families. 28.4% of all households were made up of individuals, and 17.6% had someone living alone who was 65 years of age or older. The average household size was 1.9 and the average family size was 2.3.

The age distribution is 7.6% under the age of 18, 1.5% from 18 to 24, 9.4% from 25 to 44, 35.3% from 45 to 64, and 46.2% who were 65 years of age or older. The median age was 63 years. For every 100 females, there were 89.5 males. For every 100 females age 18 and over, there were 89.3 males.

The median income for a household in the city was $93,986, and the median income for a family was $119,110. Males had a median income of $88,709 versus $49,539 for females. The per capita income for the city was $76,187. About 1.2% of families and 3.4% of the population were below the poverty line, including none of those under age 18 and 2.6% of those age 65 or over.

Geography

Indian Wells is located at 33°42′57″N116°20′28″W / 33.71583°N 116.34111°W / 33.71583; -116.34111 (33.715755, 116.341109). [14]

Hiking trails in the undeveloped area of Indian Wells Desert View Indian Wells.jpg
Hiking trails in the undeveloped area of Indian Wells

According to the United States Census Bureau, the city has a total area of 14.6 square miles (38 km2), of which 14.3 square miles (37 km2) is land and 0.3 square miles (0.78 km2), comprising 1.85%, is water.

Climate

This climate is dominated in all months by the subtropical anticyclone, or subtropical high, with its descending air, elevated inversions, and clear skies. Such an atmospheric environment inhibits precipitation. [15]

Climate data for Palm Springs, CA (1991–2020 normals)
MonthJanFebMarAprMayJunJulAugSepOctNovDecYear
Record high °F (°C)95
(35)
99
(37)
104
(40)
112
(44)
116
(47)
121
(49)
123
(51)
123
(51)
121
(49)
116
(47)
102
(39)
93
(34)
123
(51)
Mean daily maximum °F (°C)70.5
(21.4)
73.7
(23.2)
80.6
(27.0)
86.7
(30.4)
94.7
(34.8)
103.6
(39.8)
108.6
(42.6)
108.1
(42.3)
101.8
(38.8)
91.1
(32.8)
78.7
(25.9)
69.2
(20.7)
88.9
(31.6)
Daily mean °F (°C)59.0
(15.0)
61.7
(16.5)
67.5
(19.7)
72.9
(22.7)
80.3
(26.8)
88.2
(31.2)
94.0
(34.4)
94.0
(34.4)
88.1
(31.2)
77.8
(25.4)
66.0
(18.9)
57.7
(14.3)
75.6
(24.2)
Mean daily minimum °F (°C)47.6
(8.7)
49.7
(9.8)
54.4
(12.4)
59.1
(15.1)
65.9
(18.8)
72.7
(22.6)
79.4
(26.3)
79.8
(26.6)
74.4
(23.6)
64.5
(18.1)
53.4
(11.9)
46.2
(7.9)
62.3
(16.8)
Record low °F (°C)19
(−7)
24
(−4)
29
(−2)
34
(1)
36
(2)
44
(7)
54
(12)
52
(11)
46
(8)
30
(−1)
23
(−5)
23
(−5)
19
(−7)
Average precipitation inches (mm)1.16
(29)
1.16
(29)
0.49
(12)
0.05
(1.3)
0.02
(0.51)
0.02
(0.51)
0.14
(3.6)
0.29
(7.4)
0.22
(5.6)
0.20
(5.1)
0.38
(9.7)
0.70
(18)
4.83
(123)
Average precipitation days3.83.52.40.70.40.20.71.11.00.81.02.618.2
Source: NOAA [16]

Politics

Indian Wells is a largely Republican city. Since its incorporation in 1967, all Republican candidates for president and governor have carried Indian Wells, with the six Republican presidential candidates from 1968 to 1988, and the seven Republican gubernatorial candidates from 1970 to 1994 each carrying the city by a margin of at least 53 points.

Even as both the state of California and Riverside County trended more Democratic from the 1990s onward, the Republican presidential and gubernatorial candidates have continued to carry Indian Wells by large, albeit smaller margins.

The GOP also retains a very strong voter registration advantage in the city. As of August 30, 2021, there are 3,343 registered voters in the city of Indian Wells. Of these voters, 1,720 (51.45%) are registered Republicans, 868 (25.96%) are registered Democrats, and 557 (16.66%) are not registered with a political party. Indian Wells is one of three incorporated cities in Riverside County where the Republican party retains an outright majority of registered voters as of August 30, 2021, the other two being Canyon Lake and Norco. [17]

Indian Wells city vote
by party in presidential elections
Year Democratic Republican Third Parties
2020 [18] 38.96% 1,15059.65%1,7611.39% 41
2016 [19] 31.22% 77365.59%1,6243.19% 79
2012 [20] 25.80% 67473.24%1,9130.96% 25
2008 [21] 31.65% 85167.09%1,8041.26% 34
2004 [22] 26.27% 68673.11%1,9090.61% 16
2000 [23] 23.61% 54774.97%1,7371.42% 33
1996 [24] 20.91% 40373.22%1,4115.86% 113
1992 [25] 16.56% 29960.63%1,09522.81% 412
1988 [26] 15.64% 23983.51%1,2760.85% 13
1984 [27] 11.28% 13788.23%1,0720.49% 6
1980 [28] 15.32% 13878.47%7076.22% 56
1976 [29] 14.11% 8185.54%4910.35% 2
1972 [30] 11.26% 4287.67%3271.07% 4
1968 [31] 14.38% 4281.16%2374.45% 13
Indian Wells city vote
by party in gubernatorial elections
Year Democratic Republican Third Parties
2022 [32] 37.42% 91262.58%1,589
2018 [33] 32.02% 76367.98%1,620
2014 [34] 33.88% 66166.12%1,290
2010 [35] 23.89% 56774.34%1,7641.77% 42
2006 [36] 13.31% 29385.69%1,8861.00% 22
2002 [37] 20.86% 38776.66%1,4222.48% 46
1998 [38] 28.50% 50970.60%1,2610.90% 16
1994 [39] 14.69% 26884.48%1,5410.82% 15
1990 [40] 19.53% 28479.30%1,1531.17% 17
1986 [41] 11.91% 13787.22%1,0030.87% 10
1982 [42] 20.41% 17979.13%6940.46% 4
1978 [43] 21.14% 11974.96%4223.91% 22
1974 [44] 15.80% 7083.52%3700.68% 3
1970 [30] 12.80% 3786.16%2491.04% 3

Representation

In the California State Legislature, Indian Wells is in the 19th Senate District , represented by Republican Rosilicie Ochoa Bogh, and in the 47th Assembly District , represented by Republican Greg Wallis. [45]

In the United States House of Representatives, Indian Wells is in California's 41st congressional district , represented by Republican Ken Calvert. [46]

Notable residents

 Deceased

Related Research Articles

<span class="mw-page-title-main">San Ramon, California</span> City in California, United States

San Ramon is a city in Contra Costa County, California, United States, located within the San Ramon Valley, and 34 miles (55 km) east of San Francisco. San Ramon's population was 84,605 per the 2020 census, making it the 4th largest city in Contra Costa County, behind Concord, Richmond and Antioch.

<span class="mw-page-title-main">Calexico, California</span> City in California, United States

Calexico is a city in southern Imperial County, California. Situated on the Mexican border, it is linked economically with the much larger city of Mexicali, the capital of the Mexican state of Baja California. It is about 122 miles (196 km) east of San Diego and 62 miles (100 km) west of Yuma, Arizona. Calexico, along with six other incorporated Imperial County cities, forms part of the larger populated area known as the Imperial Valley. First explored by Europeans in the 18th century, Calexico began as a small tent community which was ultimately incorporated in 1908.

<span class="mw-page-title-main">Avalon, California</span> City in California, United States

Avalon is the only incorporated city on Santa Catalina Island, in the California Channel Islands, and the southernmost city in Los Angeles County. The city is a resort community with the waterfront dominated by tourism-oriented businesses. The older parts of the town on the valley floor consist primarily of small houses and two and three-story buildings in various traditional architectural styles.

<span class="mw-page-title-main">Bradbury, California</span> City in California, United States

Bradbury is a city in the San Gabriel Valley region of Los Angeles County, California, United States. It is located in the foothills of the San Gabriel Mountains below Angeles National Forest. Bradbury is bordered by the city of Monrovia to the west and south, and Duarte to the south and east. The population was 1,048 at the 2010 census, up from 855 at the 2000 census. The city has three distinct areas—the Bradbury Estates, which is a gated community consisting of 5-acre (20,000 m2) minimum estates; Woodlyn Lane, which is also a gated community with minimum 2-acre (8,100 m2) lots; and the balance of the city, which is not gated, which has lots generally ranging in size from 7,500 square feet (700 m2) to 1-acre (4,000 m2). A significant portion of the properties in Bradbury Estates and Woodlyn Lane are zoned for horses, and several horse ranches still exist within these communities today.

<span class="mw-page-title-main">Lomita, California</span> City in California, United States

Lomita is a city in Los Angeles County, California, United States. The population was 20,921 at the 2020 census, up slightly from 20,256 at the 2010 census.

<span class="mw-page-title-main">Walnut, California</span> City in California, United States

Walnut is a city in the eastern part of Los Angeles County in the U.S. state of California. According to the 2010 census, the city had a population of 29,172, and the population was estimated to be 29,685 in 2019.

<span class="mw-page-title-main">Dana Point, California</span> City in California, United States

Dana Point is a city located in southern Orange County, California, United States. The population was 33,107 at the 2020 census. It has one of the few harbors along the Orange County coast, and with ready access via State Route 1, it is a popular local destination for surfing.

<span class="mw-page-title-main">Newport Beach, California</span> City in California, United States

Newport Beach is a coastal city of about 85,000 in southern Orange County, California, United States. Located about 40 miles (64 km) southeast of downtown Los Angeles, Newport Beach is known for its sandy beaches. The city's harbor once supported maritime industries. Today it is used mostly for recreation. Balboa Island draws visitors with a waterfront path and easy access from the ferry to the shops and restaurants.

<span class="mw-page-title-main">Villa Park, California</span> City in California, United States

Villa Park is a city in northern Orange County, California, United States. It was founded in 1962. At the 2010 census, the city had a population of 5,812, making it the smallest city in Orange County.

<span class="mw-page-title-main">Banning, California</span> City in California, United States

Banning is a city in Riverside County, California, United States. Its population was 29,505 as of the 2020 census, down from 29,603 at the 2010 census. It is situated in the San Gorgonio Pass, also known as Banning Pass. It is named for Phineas Banning, stagecoach line owner and the "Father of the Port of Los Angeles."

<span class="mw-page-title-main">Beaumont, California</span> City in California, United States

Beaumont is a city in Riverside County, California, United States, located at the summit of the San Gorgonio Pass, between the San Bernardino Mountains and Mount San Gorgonio to the north, and the San Jacinto Mountains to the south. Over 18 Miles East-Southeast of Beaumont is Mount San Jacinto - Which is part of the San Jacinto Mountains and visible from the city.

<span class="mw-page-title-main">Canyon Lake, California</span> American city in California, United States

Canyon Lake is a city and gated community in Riverside County, California, United States, located on Canyon Lake reservoir. Canyon Lake began as a master-planned community developed by the Corona Land Company in 1968. The City of Canyon Lake was incorporated on December 1, 1990. Railroad Canyon Dam was built in 1927, and impounds the San Jacinto River to fill the reservoir, which covers 383 acres (1.55 km2) and has 14.9 miles (24.0 km) of shoreline.

<span class="mw-page-title-main">Moreno Valley, California</span> City in California, United States

Moreno Valley is a city in Riverside County, California, United States, and is part of the Riverside–San Bernardino–Ontario metropolitan area. It is the second-largest city in Riverside County by population and one of the Inland Empire's population centers. The city's population was 208,634 at the 2020 census. Moreno Valley is also part of the greater Los Angeles area.

<span class="mw-page-title-main">Murrieta, California</span> City in California, United States

Murrieta is a city in southwestern Riverside County, California, United States. The population of Murrieta was 110,949 as of the 2020 census. Murrieta experienced a 133.7% population increase between 2000 and 2010, making Murrieta one of the fastest-growing cities in the state during that period. Largely residential in character, Murrieta is typically characterized as a bedroom community. Murrieta is bordered by the city of Temecula to the south, the cities of Menifee and Wildomar to the north, and the unincorporated community of French Valley to the east. Murrieta is located in the center of the Los Angeles-San Diego mega-region. Murrieta is named for Juan Murrieta, a Californio ranchero who founded the town.

<span class="mw-page-title-main">Norco, California</span> City in California, United States

Norco is a city in Riverside County, California, United States. Located roughly 40 miles (64 km) inland from the Pacific Ocean, Norco is known as “Horsetown, USA” and prides itself on being a "horse community”. The area is dotted with corrals, farms, hitching posts, ranches, riding trails, and tack-and-feed supply stores; there are also city ordinances in-place requiring new construction to have a "traditional, rustic... Western flavor".

<span class="mw-page-title-main">Rancho Cucamonga, California</span> City in California, United States

Rancho Cucamonga is a city located just south of the foothills of the San Gabriel Mountains and Angeles National Forest in San Bernardino County, California, United States. About 37 mi (60 km) east of Downtown Los Angeles, Rancho Cucamonga is the 28th most populous city in California. The city's seal, which centers on a cluster of grapes, alludes to the city's agricultural history including wine-making. The city's proximity to major transportation hubs, airports, and highways has attracted the business of several large corporations, including Coca-Cola, Frito-Lay, Big Lots, Mercury Insurance Group, Southern California Edison, and Amphastar Pharmaceuticals.

<span class="mw-page-title-main">Manteca, California</span> City in California, United States

Manteca is a city in San Joaquin County, California. The city had a population of 83,498 as of the 2020 Census. It is part of the Stockton-Lodi, CA Metropolitan Statistical Area.

<span class="mw-page-title-main">Turlock, California</span> City in California, United States

Turlock is a city in Stanislaus County, California, United States. Its population was 72,740 at the 2020 United States Census, making it the second-largest city in Stanislaus County after Modesto.

California's 5th congressional district is a U.S. congressional district in California.

California's 3rd congressional district is a U.S. congressional district in California. It includes the northern Sierra Nevada and northeastern suburbs of Sacramento, stretching south to Death Valley. It encompasses Alpine, Inyo, Mono, Nevada, Placer, Plumas, and Sierra counties, as well as parts of El Dorado, Sacramento, and Yuba counties. It includes the Sacramento suburbs of Roseville, Folsom, Orangevale, Rocklin, Auburn, and Lincoln, along with the mountain towns of Quincy, South Lake Tahoe, Truckee, Mammoth Lakes, and Bishop. The district is represented by Republican Kevin Kiley.

References

  1. 1 2 "Indian Wells". Geographic Names Information System . United States Geological Survey, United States Department of the Interior . Retrieved November 11, 2014.
  2. "California Cities by Incorporation Date". California Association of Local Agency Formation Commissions. Archived from the original (Word) on November 3, 2014. Retrieved August 25, 2014.
  3. "2019 U.S. Gazetteer Files". United States Census Bureau. Archived from the original on January 16, 2020. Retrieved July 1, 2020.
  4. "Indian Wells city; California". Archived from the original on May 22, 2023. Retrieved May 22, 2023.
  5. rbcushman3 (August 3, 2019). "History of Indian Wells, CA - A Brief History". Town Square Publications. Retrieved July 16, 2024.{{cite web}}: CS1 maint: numeric names: authors list (link)
  6. "Indian Wells, CA - The Early Years". Cityofindianwells.org. Archived from the original on October 29, 2013. Retrieved March 12, 2017.
  7. "Indian Wells, CA - The 1950s & 1960s". Cityofindianwells.org. February 24, 1967. Archived from the original on October 29, 2013. Retrieved March 12, 2017.
  8. "Indian Wells, CA - Becoming A City". Cityofindianwells.org. June 27, 1967. Archived from the original on October 29, 2013. Retrieved March 12, 2017.
  9. "Census of Population and Housing". Census.gov. Archived from the original on October 3, 2014. Retrieved June 4, 2015.
  10. "2010 Census Interactive Population Search: CA - Indian Wells city". U.S. Census Bureau. Archived from the original on July 15, 2014. Retrieved July 12, 2014.
  11. "U.S. Census website". United States Census Bureau. Archived from the original on July 1, 2021. Retrieved August 30, 2013.
  12. "Indian Wells (city) QuickFacts". United States Census Bureau. Archived from the original on March 22, 2015. Retrieved March 19, 2015.
  13. "U.S. Census website". United States Census Bureau. Archived from the original on July 1, 2021. Retrieved January 31, 2008.
  14. "US Gazetteer files: 2010, 2000, and 1990". United States Census Bureau. February 12, 2011. Archived from the original on August 24, 2019. Retrieved April 23, 2011.
  15. "Indio, California Travel Weather Averages". Weatherbase. Retrieved March 12, 2017.
  16. "NOAA's 1991–2020 Climate Normals (1991–2020)". National Oceanic and Atmospheric Administration. 2021. Archived from the original on October 9, 2021. Retrieved May 5, 2021.
  17. "Report of Registration as of August 30, 2021 Registration by Political Subdivision by County" (PDF). ca.gov. August 30, 2021.
  18. "Supplement to Statement of Vote GENERAL ELECTION NOVEMBER 3, 2020" (PDF). ca.gov.
  19. "Supplement to the Statement of Vote Political Districts within Counties for President" (PDF). ca.gov.
  20. "Election data" (PDF). elections.cdn.sos.ca.gov. Archived (PDF) from the original on July 9, 2019. Retrieved August 10, 2020.
  21. "Election data" (PDF). elections.cdn.sos.ca.gov. Archived (PDF) from the original on April 12, 2019. Retrieved August 10, 2020.
  22. "Election data" (PDF). elections.cdn.sos.ca.gov. Archived (PDF) from the original on December 1, 2018. Retrieved August 10, 2020.
  23. "Election data" (PDF). elections.cdn.sos.ca.gov. Archived (PDF) from the original on February 4, 2020. Retrieved August 10, 2020.
  24. "Election data" (PDF). elections.cdn.sos.ca.gov. Archived (PDF) from the original on February 4, 2020. Retrieved August 10, 2020.
  25. "Election data" (PDF). elections.cdn.sos.ca.gov. Archived (PDF) from the original on February 4, 2020. Retrieved August 10, 2020.
  26. "Statement of vote : California. Secretary of State : Free Download, Borrow, and Streaming". Internet Archive. 1968.
  27. "Statement of vote : California. Secretary of State : Free Download, Borrow, and Streaming". Internet Archive. 1968.
  28. "Statement of vote : California. Secretary of State : Free Download, Borrow, and Streaming". Internet Archive. 1968.
  29. "Statement of vote : California. Secretary of State : Free Download, Borrow, and Streaming". Internet Archive. 1968.
  30. 1 2 "Statement of vote : California. Secretary of State : Free Download, Borrow, and Streaming". Internet Archive. 1968.
  31. "California statement of vote : California. Secretary of State : Free Download, Borrow, and Streaming". Internet Archive. 1962.
  32. "Election data" (PDF). elections.cdn.sos.ca.gov. Archived (PDF) from the original on December 7, 2022. Retrieved December 7, 2022.
  33. "Election data" (PDF). elections.cdn.sos.ca.gov. Archived (PDF) from the original on July 16, 2024. Retrieved August 10, 2020.
  34. "Election data" (PDF). elections.cdn.sos.ca.gov. Archived (PDF) from the original on July 31, 2019. Retrieved August 10, 2020.
  35. "Election data" (PDF). elections.cdn.sos.ca.gov. Archived (PDF) from the original on July 16, 2024. Retrieved August 10, 2020.
  36. "Election data" (PDF). elections.cdn.sos.ca.gov. Archived (PDF) from the original on December 1, 2018. Retrieved August 10, 2020.
  37. "Election data" (PDF). elections.cdn.sos.ca.gov. Archived (PDF) from the original on September 21, 2020. Retrieved August 10, 2020.
  38. "Statement of vote : California. Secretary of State : Free Download, Borrow, and Streaming". Internet Archive. 1968.
  39. "Election data" (PDF). elections.cdn.sos.ca.gov. Archived (PDF) from the original on September 21, 2020. Retrieved August 10, 2020.
  40. "Election data" (PDF). elections.cdn.sos.ca.gov. Archived (PDF) from the original on August 4, 2020. Retrieved August 10, 2020.
  41. "Statement of vote : California. Secretary of State : Free Download, Borrow, and Streaming". Internet Archive. 1968.
  42. "Statement of vote : California. Secretary of State : Free Download, Borrow, and Streaming". Internet Archive. 1968.
  43. "Statement of vote : California. Secretary of State : Free Download, Borrow, and Streaming". Internet Archive. 1968.
  44. "Statement of vote : California. Secretary of State : Free Download, Borrow, and Streaming". Internet Archive. 1968.
  45. "Statewide Database". UC Regents. Archived from the original on February 1, 2015. Retrieved November 23, 2014.
  46. "California's 41st Congressional District - Representatives & District Map". Civic Impulse, LLC.
  47. Meeks, Eric G. (2011). P.S. I Love Lucy: The Story of Lucille Ball in Palm Springs. Horatio Limburger Oglethorpe. p. 26. ISBN   978-1-4680-9854-9.
  48. "James G. Boswell II dies at 86; cotton magnate built family farm into agribusiness giant". Los Angeles Times. April 7, 2009. Archived from the original on November 14, 2023. Retrieved November 15, 2023.
  49. "Obituary: Cargill MacMillan, 84, company heir". StarTribune. Archived from the original on November 29, 2014. Retrieved November 20, 2014.